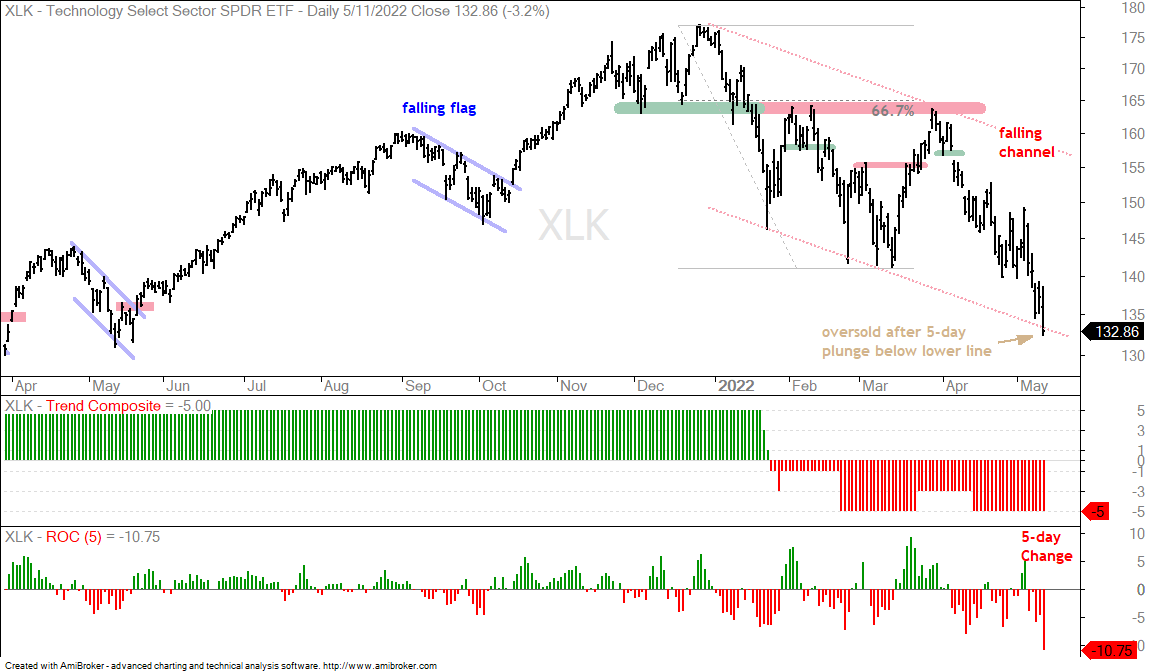
Stocks remain under pressure and failed to bounce after becoming quite oversold after a three-day decline on Tuesday. This decline continued with many stocks and ETFs becoming even more oversold. Two of the ARK ETFs, ARKF and ARKW, fell over 30% the last five days. Almost all tech-related ETFs are down more than 10% the last five trading days. This decline is looking like a washout or selling climax that could give way to a sharp bounce, but the knife is still falling with the blade pointed down. The chart below shows XLK falling 10.75% the last five days and breaching the lower line of a falling channel. XLY is down 14.23% and below the lower line as well.
About the ETF Trends, Patterns and Setups Report
This report contains discretionary chart analysis based on my interpretation of the price charts. This is different from the fully systematic approach in the Trend Composite strategy series. In this ETF Trends, Patterns and Setups report, I am looking for leading uptrends and tradable setups within these uptrends. While I use indicators to help define the trend and identify oversold conditions within uptrends, the assessments are mostly based on price action and the price chart (higher highs, higher lows, patterns in play). Sometimes the chart assessment can be at odds with the indicators.
Percent above 200-day Sinks, but Does not Quite Stink
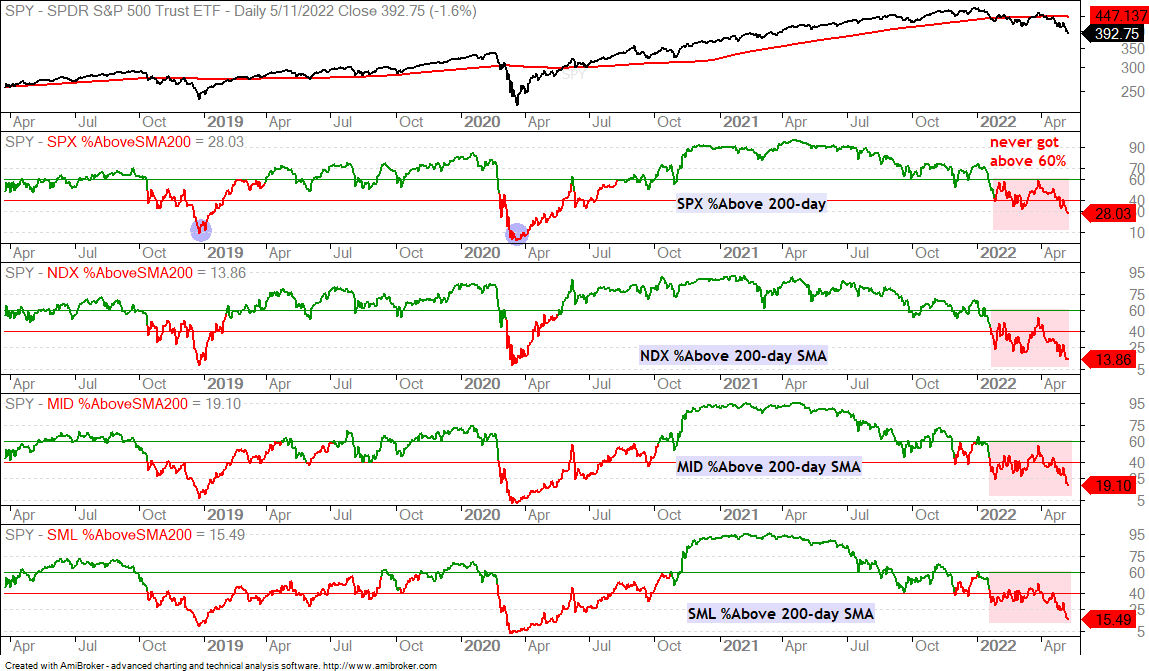
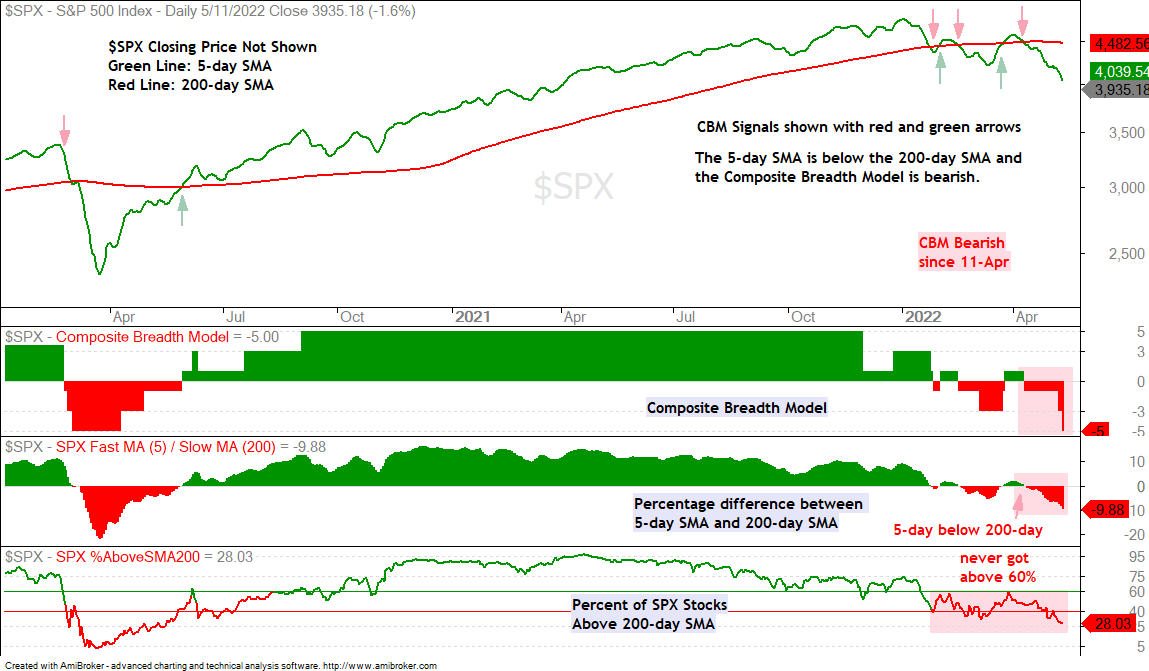
The percentage of stocks above the 200-day SMA continues to deteriorate as the bear extends its grip. Less than 30% of S&P 500 stocks are above their 200-day SMAs, while fewer than 20% of stocks in the Nasdaq 100, S&P MidCap 400 and S&P SmallCap 600 are above their 200-day SMAs. These are bear market numbers that show the vast majority of stocks in downtrends.
The blue ovals on the SPX %Above 200-day SMA chart show this indicator dipping to 10% in December 2018 and below 10% in March 2020. Those looking for a stink bid (holding your nose and buying at the darkest hour) can wait for this level to be breached. The indicator also hit this level in July 2011 and on October 6th, 2008. The July 2011 breach led to a reversal, but the market continued lower after the October 2008 breach.
You can learn more about my chart strategy in this article covering the different timeframes, chart settings, StochClose, RSI and StochRSI.
New Lows Expand, but Have yet to Hit Stink Levels
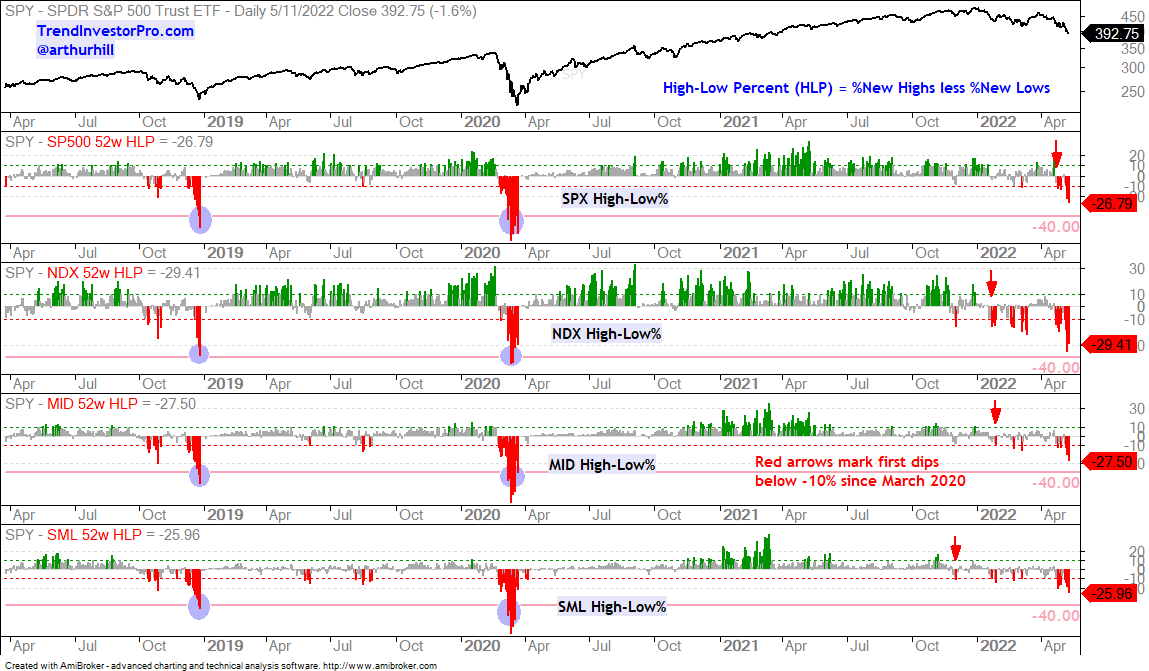
The next chart shows the High-Low Percent indicators for the S&P 500, Nasdaq 100, S&P MidCap 400 and S&P SmallCap 600. The green bars show when High-Low Percent exceeds +10% (bullish) and the red bars show when High-Low Percent exceeds -10% (bearish). The red arrows show the initial bearish signals and moves below -10%. These occurred in late April 2022 for $SPX, late January 2022 for $NDX and $MID, and late November 2021 for $SML. All four are bearish and below -25%, which means more than a quarter of stocks in each index recorded 52-week lows. Stocks making 52-week lows are in strong downtrends and leading lower.
Those looking for a stink bid can watch for these indicators to exceed -40%. The blue ovals show this occurring in December 2018 and March 2020. The High-Low Percent indicators did not reach these extremes in July 2011, but they did on October 6th, 2008. It took another five months for the final bottom in March 2009. The outlier bear markets in 2001-2003 and 2008-2009 are when stink bids did not work because stocks fell for several months afterwards.
Downside Targets and Elliott Wave with a Grain of Salt
Price targets based on technical analysis are not that accurate and often a waste of time. We can look smart adding Fibonacci retracements, looking for broken resistance levels that turn support and finding a prior low that marks support. In reality, we are often better off focusing on the existing trend and waiting for a reversal breakout, such as the Trend Composite turning bullish or Composite Breadth Model turning bullish. I would also note that the market often bounces when we start making downside projections!
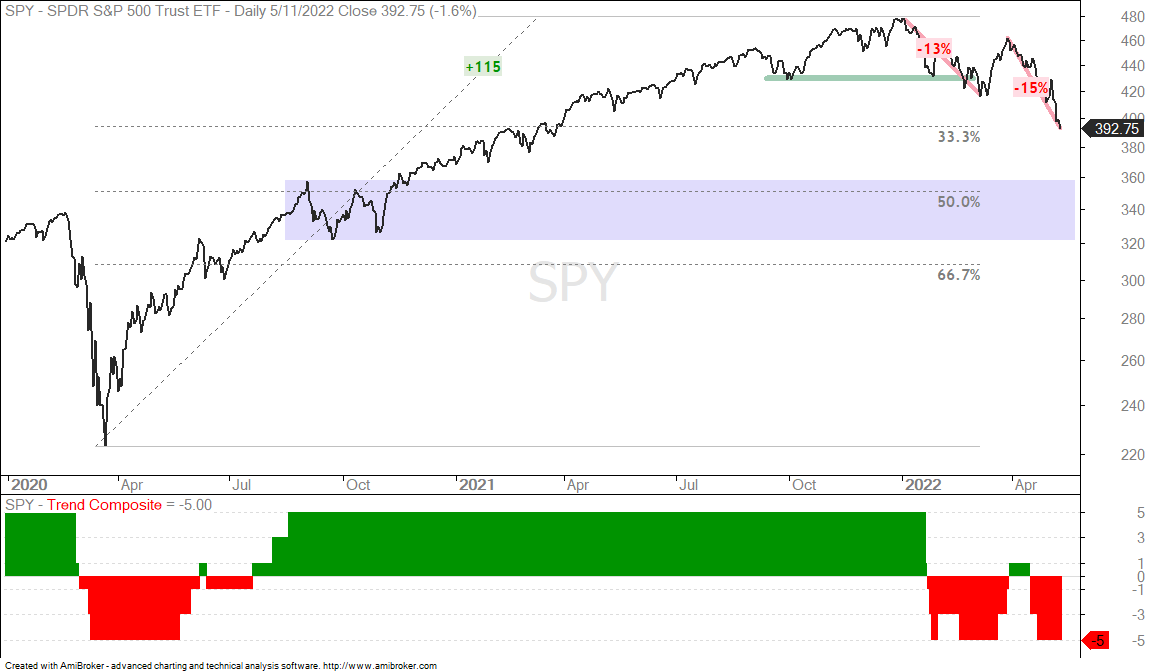
Having said that, I am putting forth a SPY target (340) to go with a potential stink bid. Take it with a grain of salt and keep an eye on the immediate trend. The 340 area is around 13% below current levels. A move to the 340 area would retrace a little more than half of the prior bull run and return to the middle of the consolidation zone in September-October 2021.
If we are viewing SPY in subjective Elliott wave terms, the January-March decline was Wave 1, the surge the second half of March marked Wave 2 and we are currently in Wave 3 down. Wave 3 is the largest of the three waves and produces the biggest decline. At the very least, Wave 3 is bigger than Wave 1 and Wave 1 witnessed a 13% decline. Currently, the decline from the late March high is around 15%. I do not know when, but we will probably get a counter-trend Wave 4 up at some point and then the famous 5th Wave down, which could then produce the washout.
Trend Matters in the End
Stink bids, downside targets and Elliott wave are all subjective and do not fit with trend-following and systematic trading/investing. Charles Dow famously said that neither the length nor the duration of the primary trend could be forecast. The best we can do is identify the trend and trade accordingly. For me, this means not turning bullish until the Composite Breadth Model turns bullish and we start seeing some bullish signals from the Trend Composite. In other words, waiting for actual evidence that the trend has reversed.
Defensive ETFs Holding Up the Best
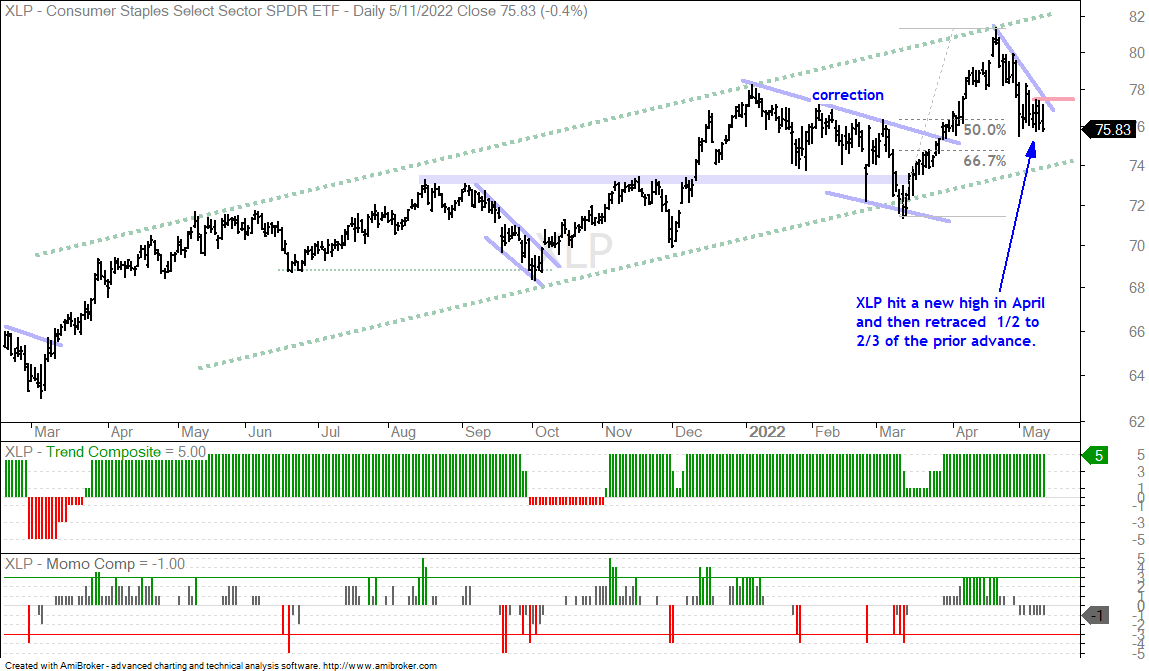
The defensive ETFs are holding up the best because they hit new highs in April and their pullbacks into May are still normal. In other words, their pullbacks retraced around half of the February-April advance. Even so, keep in mind that we are in a bear market and this means few groups will be spared. They are just down less and holding up better.
The Utilities SPDR (XLU), Consumer Staples SPDR (XLP) and Food & Beverage ETF (PBJ) have similar chart setups, as do the S&P 500 Low Volatility ETF (SPLV) and Select Dividend ETF (DVY). The latter two have heavy weightings in utilities and consumer staples. All five charts show the current pullbacks with the red resistance lines marking the breakout level to watch.
You can learn more about exit strategies in this post, which includes a video and charting options for everyone.
XME Reflects Demand for Industrial Metals
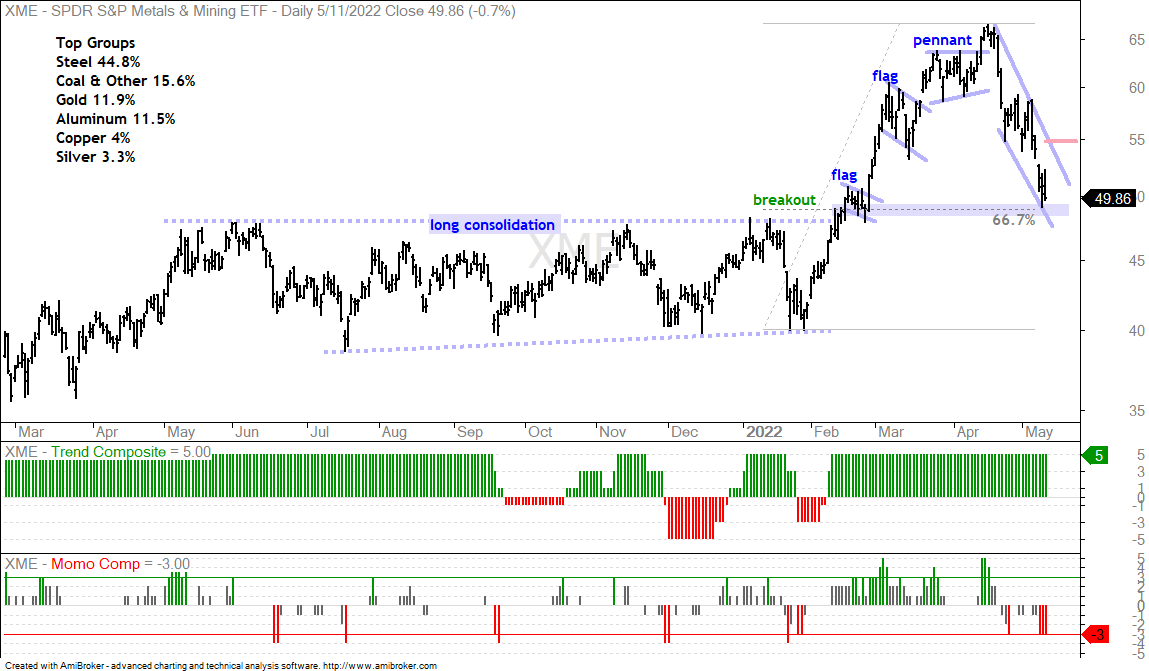
The Metals & Mining SPDR (XME) also has a normal retracement working, but the decline over the last four weeks was quite sharp. I think there is some correlation with industrial metals at work here because of the ETF weightings (steel 44.8%, gold 11.9%, aluminum 11.5%, copper 4% and silver 3.3%). The demand side for industrial metals is driven by the economy and the stock market reflects the economic outlook. SPY is down 18% from its January high and the Russell 2000 ETF (IWM) is down 30% from its November high. These declines bode ill for the economic outlook and the demand for industrial metals. While the retracement is still normal for XME, XME is still composed of stocks and we are in a bear market. This means ignoring bullish setups because risk of failure is above average.
The Momentum Composite aggregates signals in five momentum-type indicators to identify short-term overbought and oversold conditions. This indicator is part of the TIP Indicator Edge Plugin for StockCharts ACP
Gold Corrects as Platinum Bounces
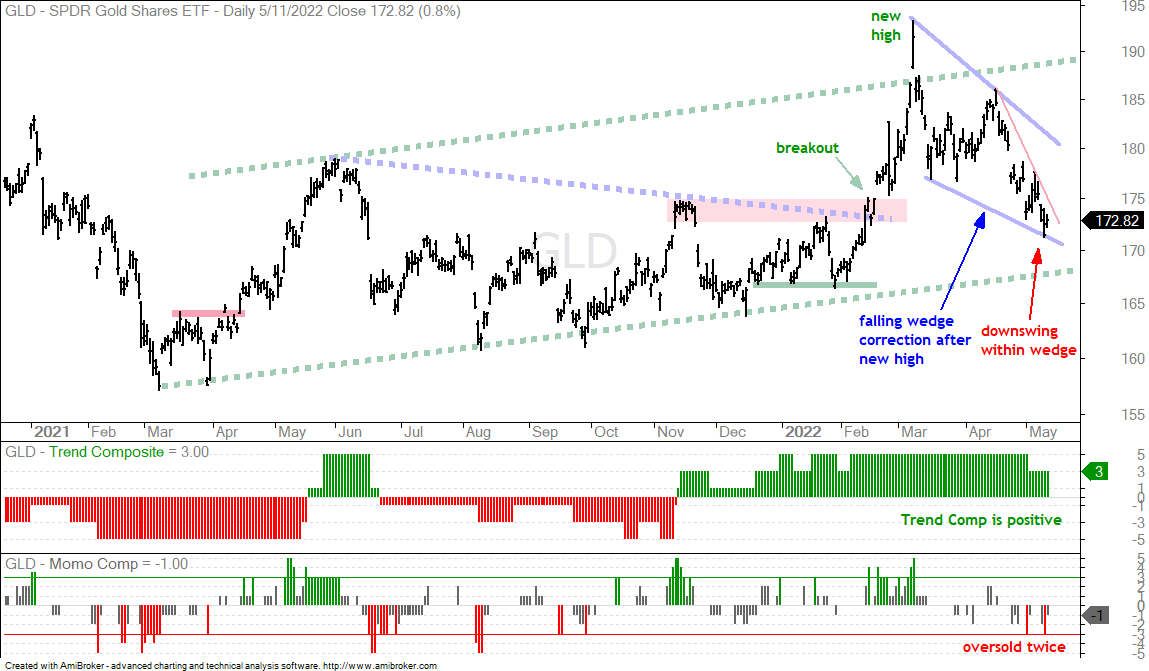
The Gold SPDR (GLD) remains in corrective mode because the Trend Composite is positive and a falling wedge formed over the last two months. I do not know what is weighing on gold. It could be the strong Dollar, rising Treasury yields or something else. I still think the long-term trend is up because the Trend Composite is positive, GLD hit a new high in March and GLD remains well above the January lows. The correction extended further than expected, but I will consider it a correction within a bigger uptrend as long as the Trend Composite remains positive. As such, I continue to watch the swing within this correction for the early signs of an upturn. A breakout at 175 would provide the first bullish clue.
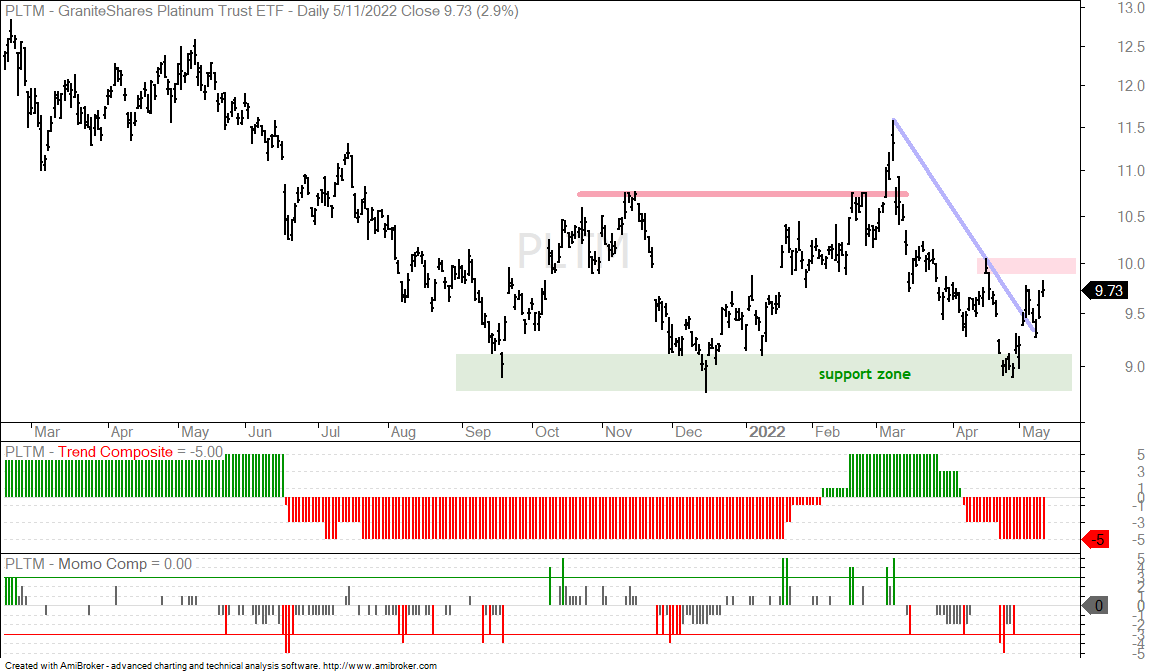
The Platinum ETF (PLTM) is in a downtrend overall, but caught my eye because the ETF is up over the last three weeks. In contrast, most other industrial and precious metals are down. The Silver ETF (SLV) broke below the 2021 lows, while GLD and the Palladium ETF (PALL) forged lower lows from late April to early May. The chart shows PLTM bouncing off the green support zone and breaking the trendline extending down from the March high. The bounce off the support zone is pretty strong, but has yet to forge a higher high or break a resistance level. Follow through above the mid April high could suggest that this bounce has legs.
Prior Video and Report
I posted a comprehensive video on Wednesday (here) and Tuesday’s report (here) covered the following:
Bear Market Participation Broadens (SPX)
Defensive ETFs Not Immune (PBJ)
Only 5 ETFs are Positive the last 15 Days
Energy and Agriculture with Leading Uptrends DBE, DBA, WEAT, CANE
Copper Breaks Down as DBB Holds Out (CPER, DBB, PALL)
Energy-Related ETFs Get Hit (XLE, XES)
Market Notes to Consider (lots of new lows)
You can learn more about my chart strategy in this article covering the different timeframes, chart settings, StochClose, RSI and StochRSI.
")