Complimentary
New Highs vs Lows, XLC Goes Beast Mode – Risk is On – Dissecting Gold – A Cyber Setup
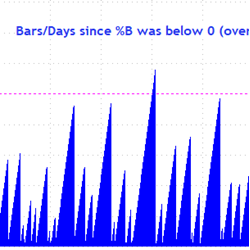
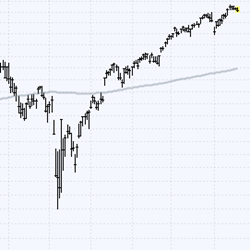
Welcome to the Friday Chart Fix! Today’s report starts with a bullish breadth indicator and the level to watch going forward. We then turn to the strongest sector: Communication Services. It has been on fire since May and continues to