Broad Breadth Model – Methodology, Indicators, Signals & Performance

The broad market environment is vitally important to strategies that trade stocks or equity ETFs. Bull and bear markets, however, are not just defined by the trend for the major indexes, such as the S&P 500. Instead, we must look within the indexes and use breadth indicators to quantify the environment for the majority stocks. We are trading individual stocks and equity ETFs, not the indexes. Analyze accordingly.

Broad Breadth Model – Methodology, Indicators, Signals & Performance Read More »

Improve Performance with Smoothing, Filters and a Twist – 200-day Cross for SPY/QQQ

SPY and QQQ crossed above their 200-day SMAs with big moves on Monday, and held above these long-term moving averages the entire week. In addition, the 5-day SMA moved above the 200-day SMA to reverse the bearish trend signal from mid March. The V-Reversal since late March was extraordinary and SPY seems short-term overbought, but the 5/200 day SMA cross is a bullish signal

Improve Performance with Smoothing, Filters and a Twist – 200-day Cross for SPY/QQQ Read More »

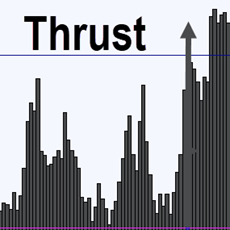
Thrust Signals using %Above SMA Breadth – Theory, Practice, Reality

Besides the Zweig Breadth Thrust, chartists can identify bullish thrusts using short-term breadth indicators, such as the percentage of stocks above their 20 and 50 day SMAs (simple moving averages). Breadth thrust signals reflect a sharp turnaround in participation that can foreshadow an extended uptrend. Thrust signals start with a setup that shows very few stocks

Thrust Signals using %Above SMA Breadth – Theory, Practice, Reality Read More »

Scroll to Top