")

Here is some sample charts and analysis from our reports. Reports are posted Tuesdays, Wednesdays and Thursdays by 8AM ET. […]
Chart Trader – Sample Report Read More »
Strategy Update (last close: August 31st, 2024) The S&P 500 (SPX) continues to lead the way for the Dual Momentum
Dual Momentum Rotation Strategy (S&P 500) – Details and Performance (latest) Read More »
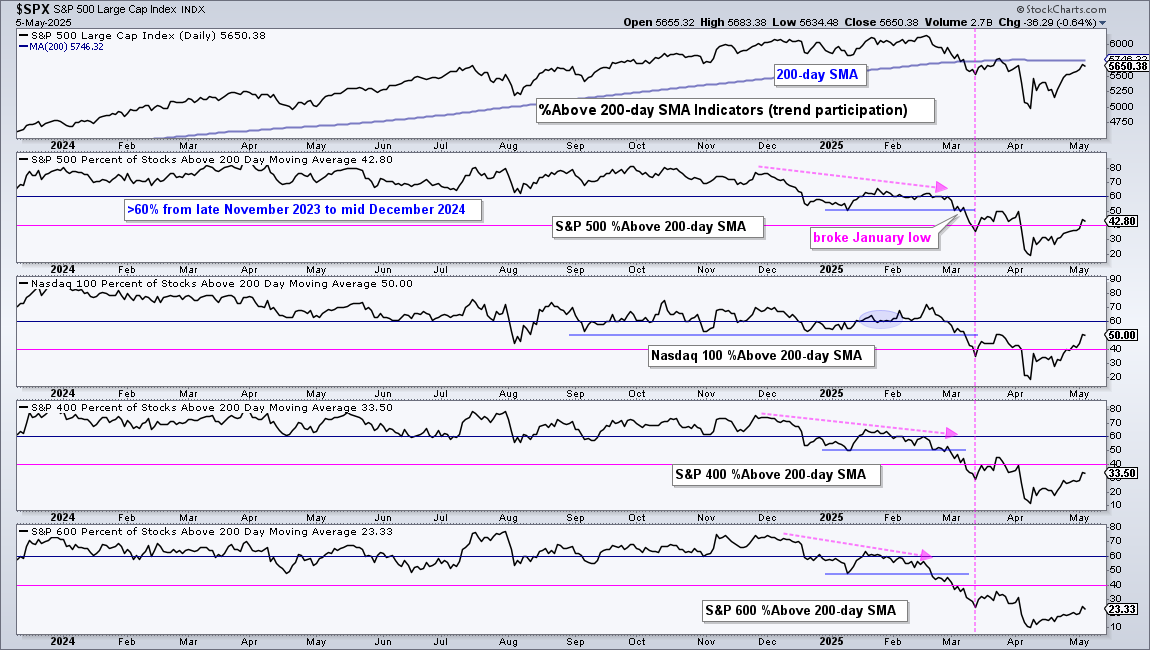
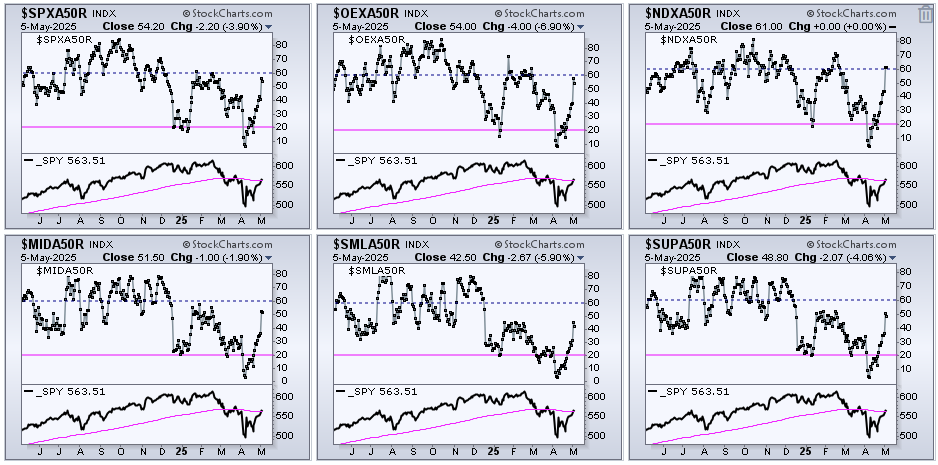
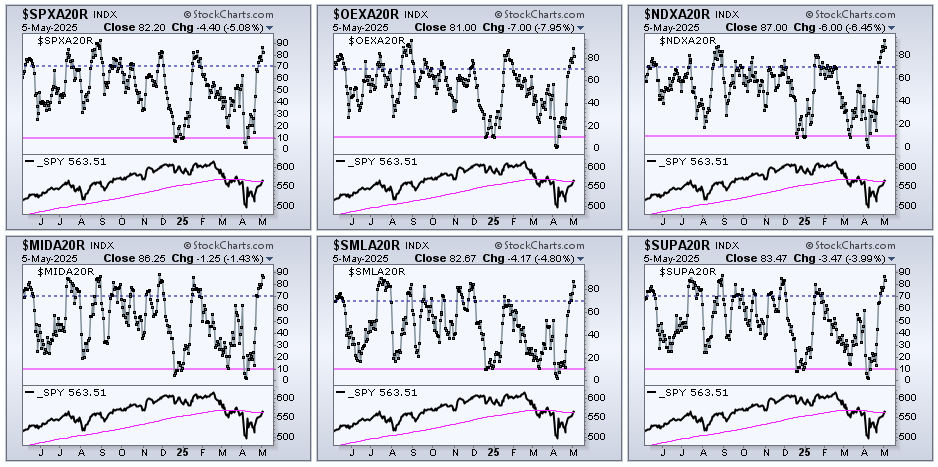
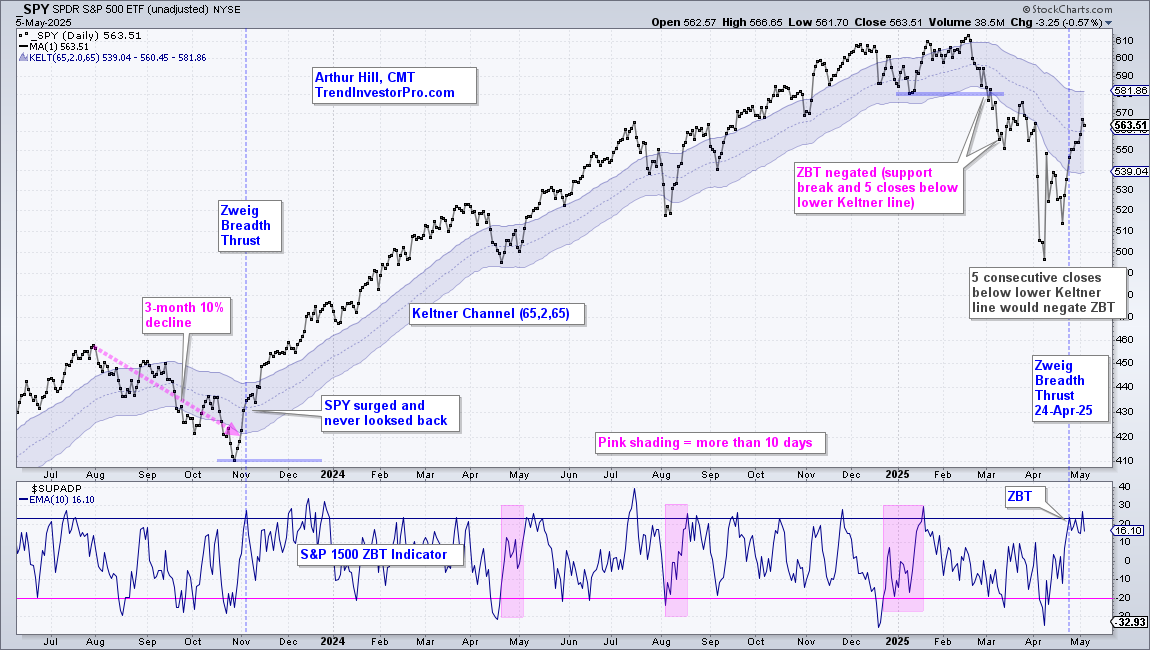
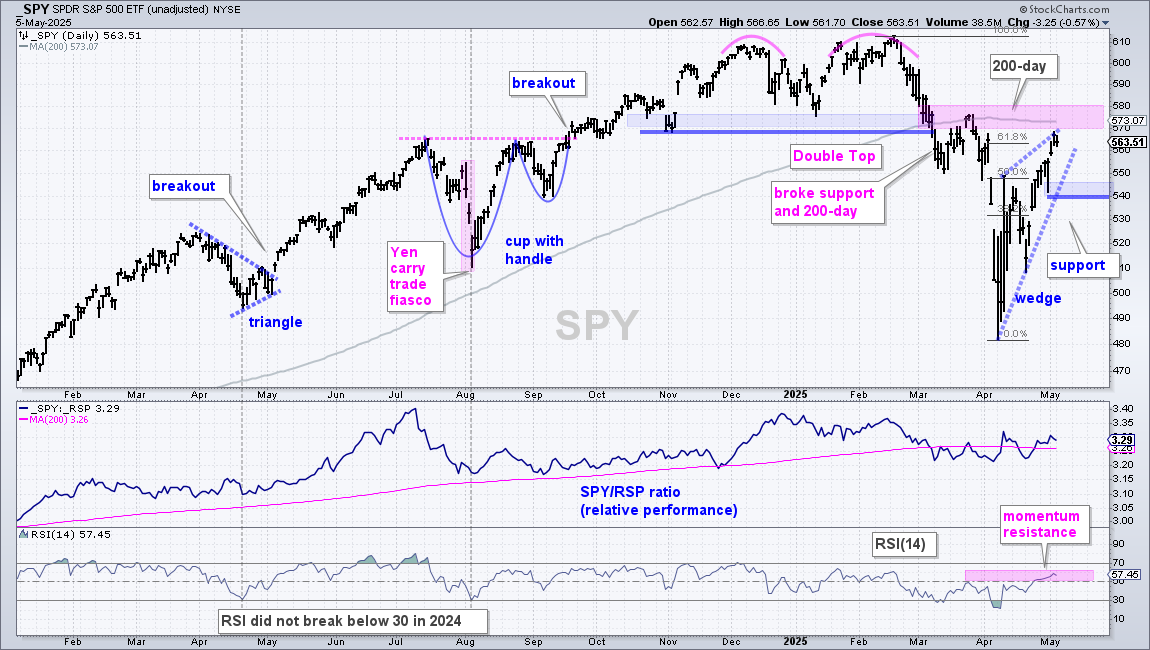
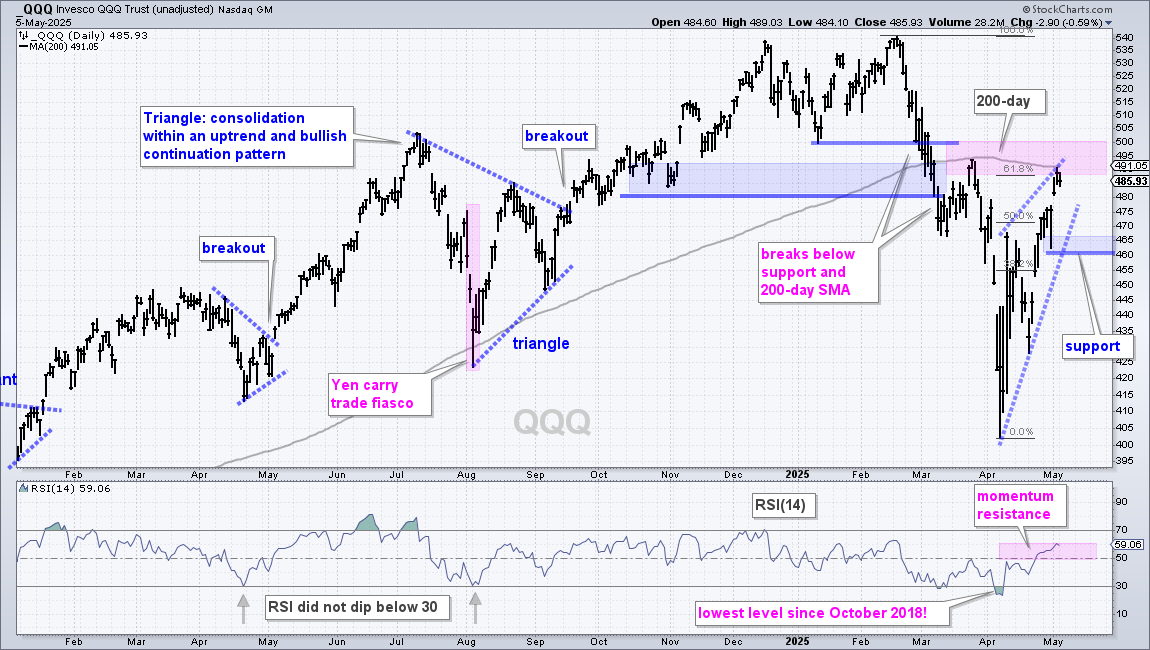
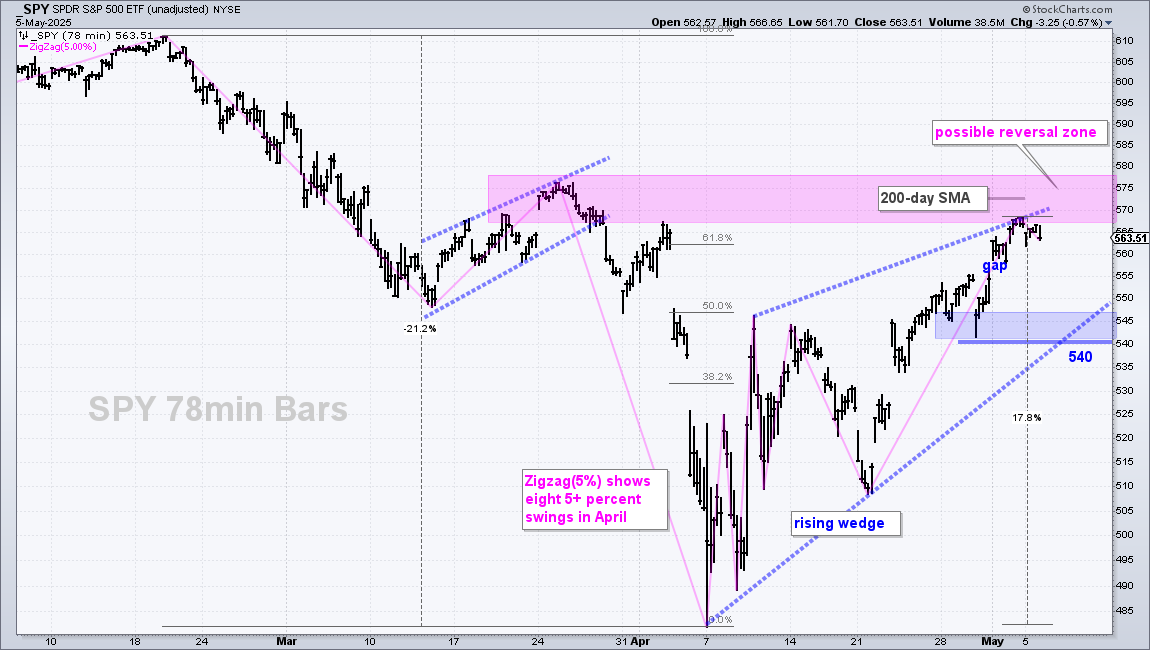
This comprehensive report and video are published every Friday morning, which gives readers a few days to cover and digest the information. We start with broad market analysis using our breadth models, long-term trends, yield spreads and market disposition. Attention then turns to key groups and leading groups (using ETFs). Based on the leaders, we then feature some stocks with breakouts and trading setups. This report ends with analysis of TLT, GLD and Bitcoin.

The left button links to a sample ChartBook with more than 60 annotated charts. This ChartBook is updated very week.
Sample Weekend Video and Chart Notes Read More »

This is a sample of the weekly State of the Stock Market Report, which is published every Friday. This weekly
Sample – The State of the Stock Market – Concerns Versus Evidence Read More »

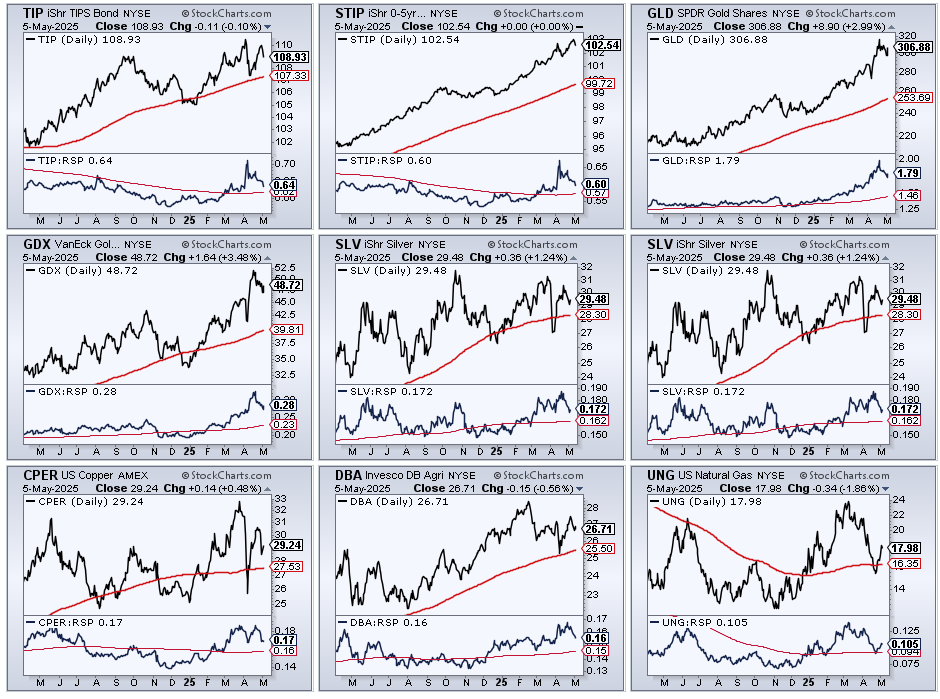
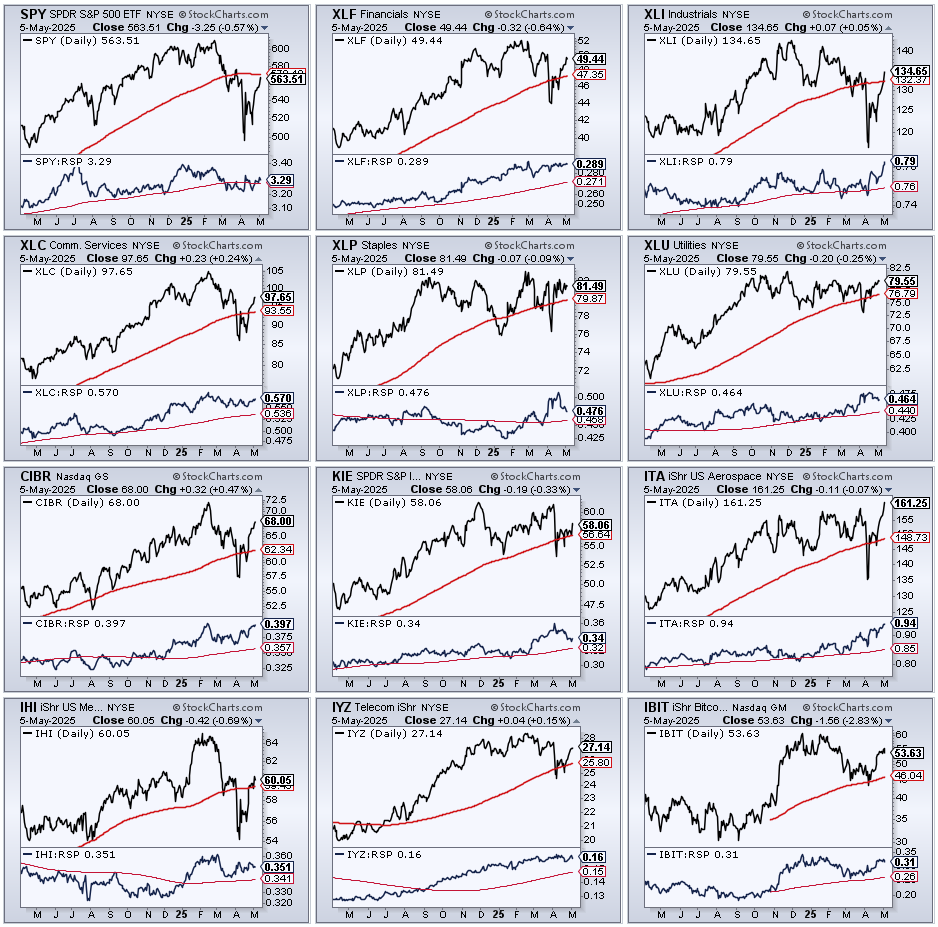
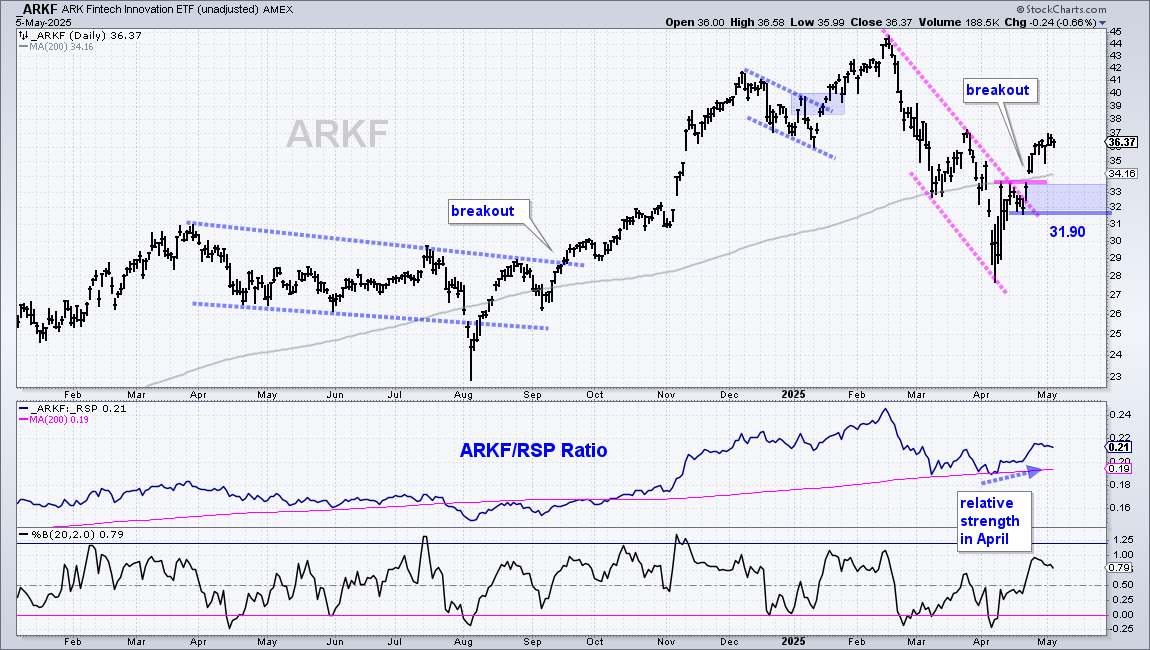
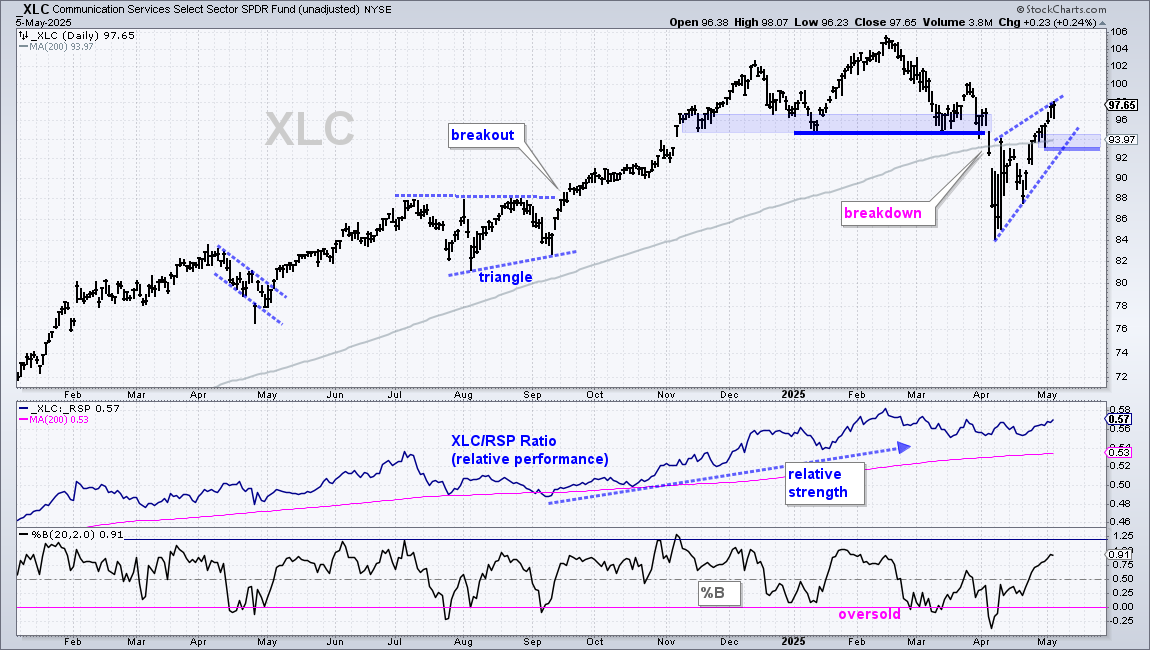
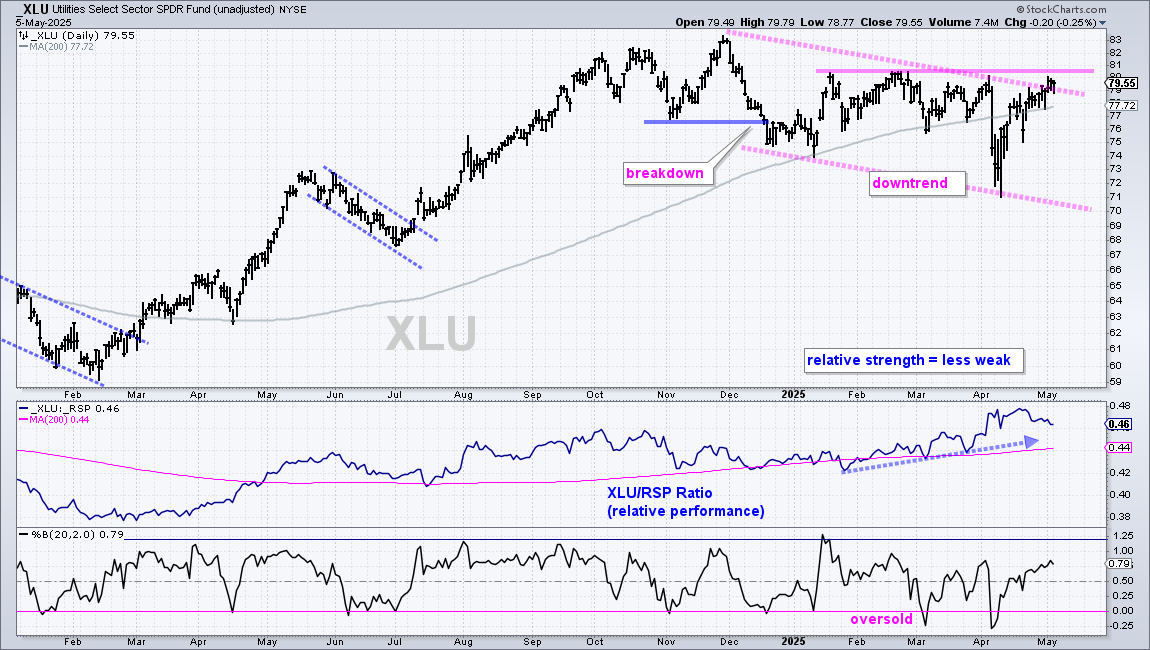
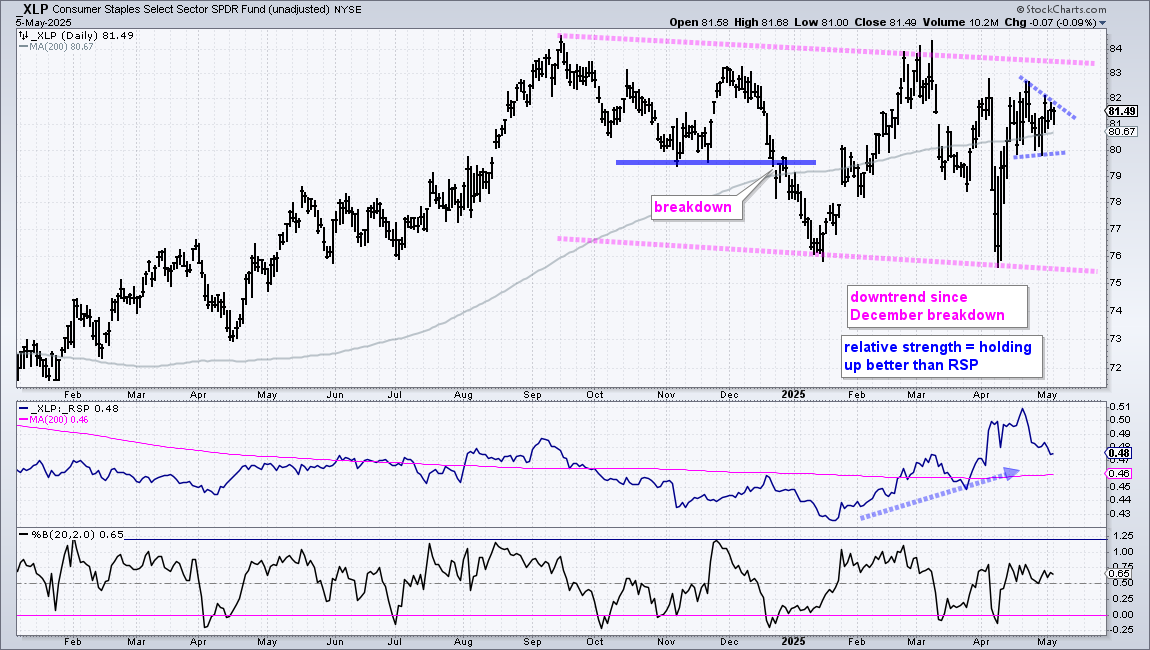
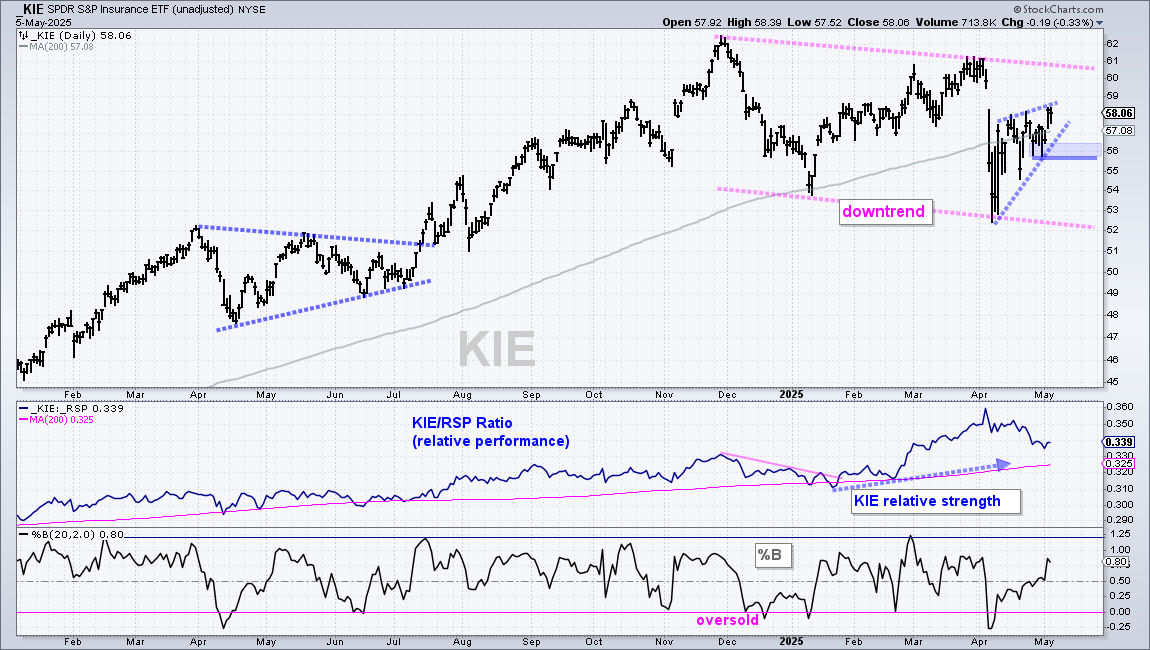
This is a sample of the weekly ETF Ranking and Grouping report, which is published every Thursday. Today’s report will