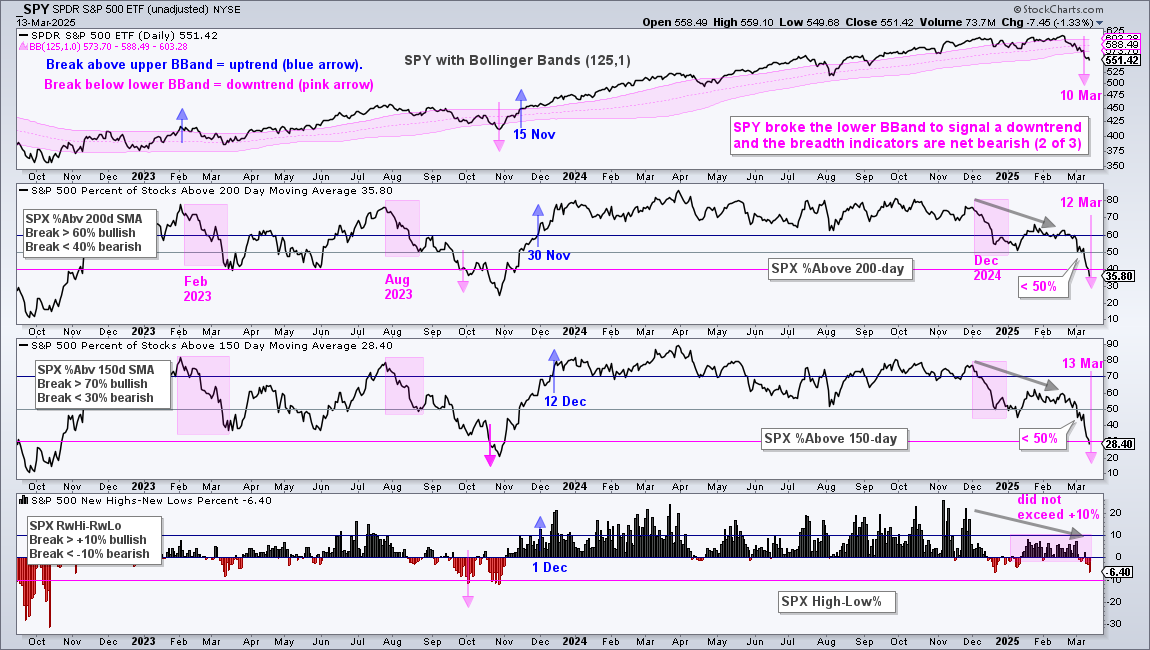
SPY moved into a long-term downtrend as it broke the lower Bollinger Band (125,1) on March 10th. Two S&P 500 breadth indicators followed with a rapid deterioration and bearish signals. The percentage of S&P 500 stocks above their 200-day SMA ($SPXA200) plunged below 40% on March 12th, while the percentage of stocks above their 150-day SMA ($SPXA150) plunged below 30% on March 13th. This means two of the three breadth indicators triggered bearish and the group is net bearish (two of three). S&P 500 High-Low% ($SPXHLP) fell into negative territory, but has yet to exceed -10% and trigger bearish.
14-March-2025: Spreads Widen to Multi-month Highs (stress)
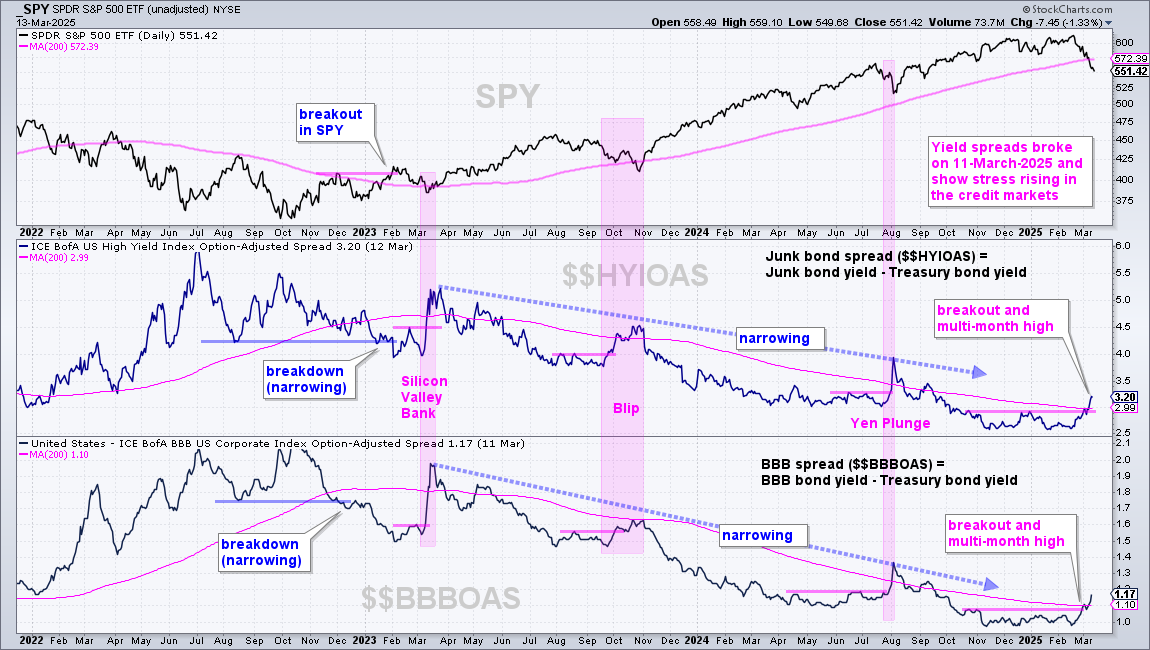
The chart below shows SPY, the Junk Bond Spread ($$HYIOAS) and the BBB Bond Spread ($$BBBOAS). Both spreads widened (rose) to their highest levels in months and broke above their 200-day SMAs. This shows increasing stress in the credit markets and I view this as negative for stocks. Bond traders are demanding a higher risk-premium to hold junk and BBB bonds. This means they are more concerned with the economy and the issuer’s ability to repay its obligation.
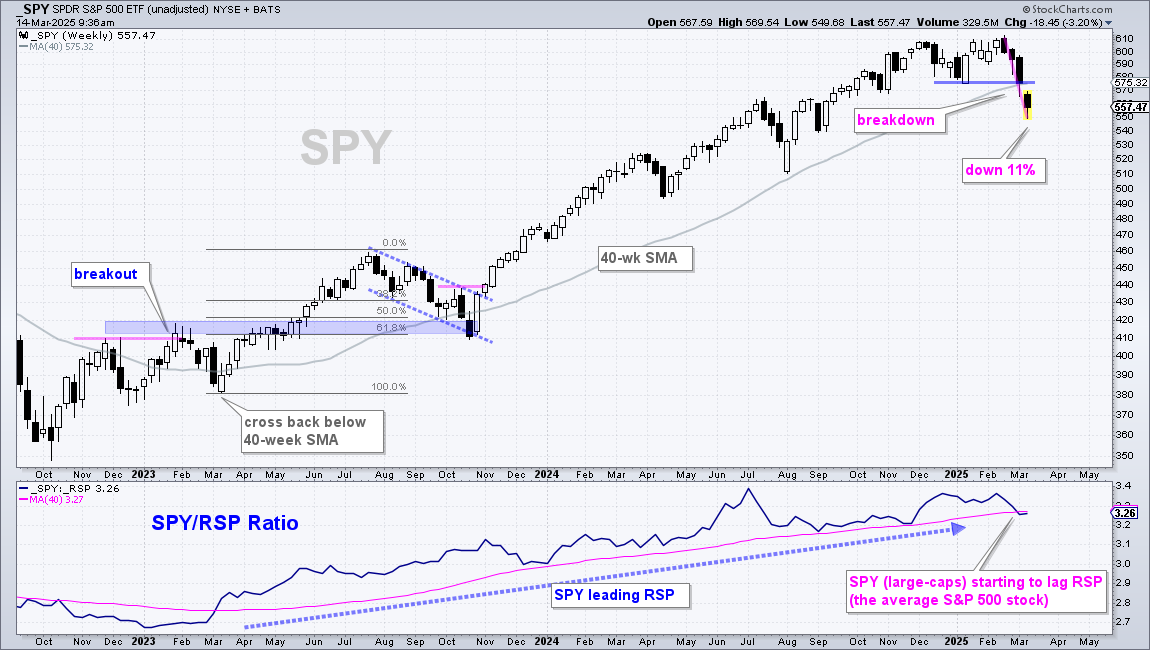
The chart below shows weekly candlesticks for SPY since October 2022. The gray line is the 40-week SMA, which is equivalent to the 200-day SMA. On the top right, we can see a break below support and a break below the 40-week SMA with an 11% decline the last four weeks (high to low). This decline reversed the long-term uptrend. The middle window shows the SPY/RSP ratio breaking below its 40-week SMA for the first time since early March 2023. After outperforming for two years, large-caps (SPY) are underperforming the average stock in the S&P 500 (RSP). The long-term trend is down on this chart and large-caps show relative weakness.
14-March-2025: Reviewing the 2022 Breakdown and Bear Market
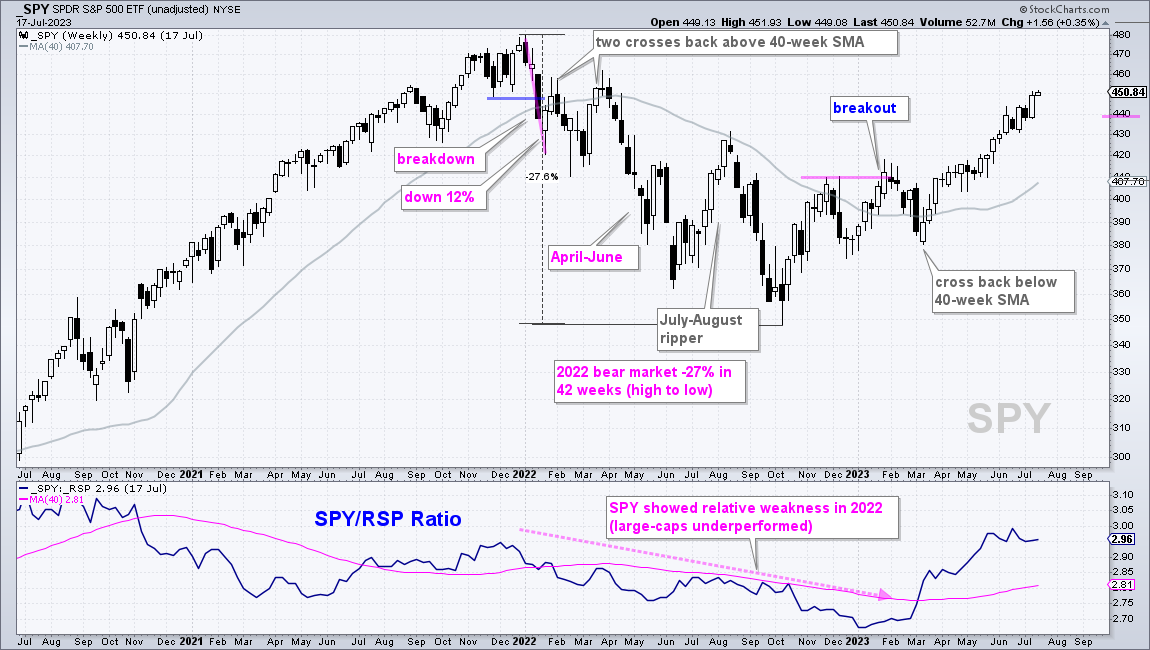
Now let’s look at the last bear market, which started in January 2022. It too started with a four week outsized decline (12% from high to low). SPY also broke support and the 40-week SMA, and the SPY/RSP ratio moved below its 40-week SMA. Thus, a bear market ensued as SPY broke down and started underperforming RSP in January 2022.
After the initial bear market signal, SPY was oversold in mid January 2022 and rebounded with a move back above the 40-week SMA. In fact, SPY crossed back above its 40-week SMA twice before falling sharply from April to June 2022. There was an exceptionally sharp rip higher in August, but this ripper failed near the 40-week and SPY fell to new lows in October 2022. The downtrend reversed with a breakout (higher high) in February 2023.
14-March-2025: Price Target - Until the Facts Change
Returning to the present day…No two bear markets are the same. Not all breakdowns lead to bear markets or extended declines. However, we must accept the evidence before us and change when this evidence changes. As Lord John Maynard Keynes said: When the facts change, I change my mind – what do you do, sir? The evidence is currently bearish and I will continue to monitor it on a daily/weekly basis.
I am not a big fan of price projections or targets, but here is a stab. First, SPY is oversold and sentiment is extremely bearish. This argues for an oversold bounce that could extend to the 580 area. Here we have broken support turning into resistance and the underside of the 40-week SMA. An overshoot is possible to 590. We could then see a reversal and continuation lower with a target zone in the 500-520 area (blue shading). Here we have the April-August lows, the 50% retracement line and the lower line of a possible falling channel. Keep in mind that this is a guestimate.
20-March-2025: Gold SPDR Remains in Beast Mode
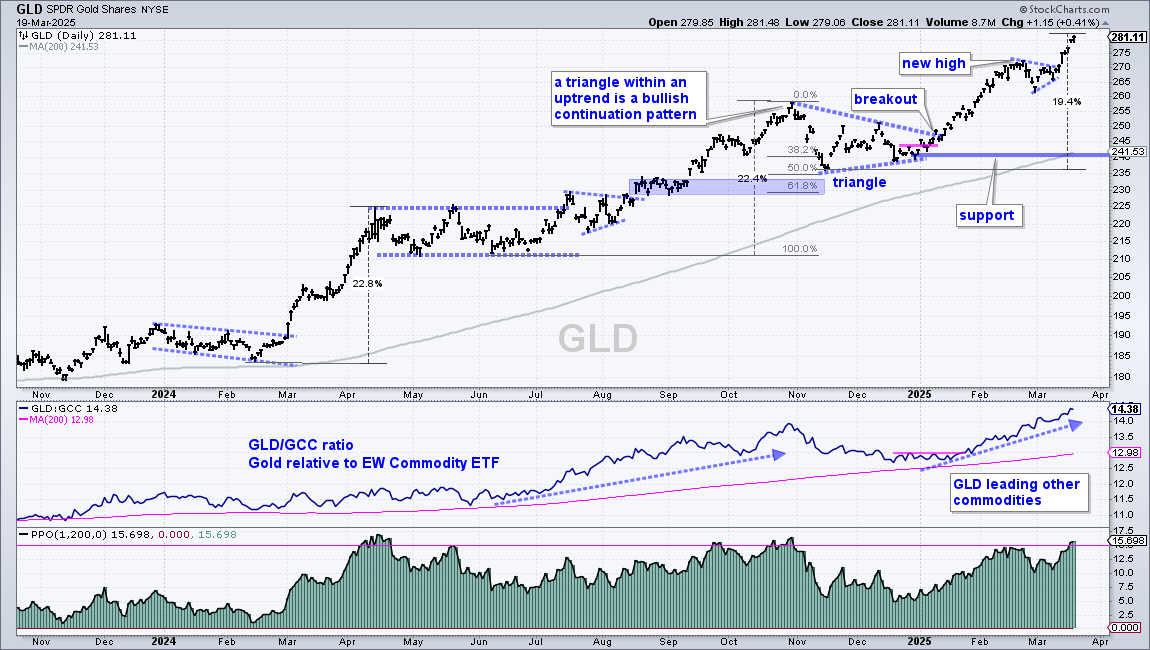
The Gold SPDR (GLD) remains in a leading uptrend with yet another new high this week. Gold is outperforming the commodity group, bonds, stocks and crypto. It is the strongest asset in the financial markets right now. There is nothing new on the chart because GLD is in uncharted territory as it trades at all time highs. The only potential negative is that the ETF is nearing overbought territory. Note that GLD is over 15% above its 200-day EMA, which was also the case in April and October 2024. These overbought readings gave way to a consolidation period to digest the gains. Overbought in an uptrend is not a bearish setup or signal. It simply means prices are extended and ripe for a rest.
The bottom window shows the PPO(1,200,0), which is the percentage difference between the close (1-day EMA) and the 200-day EMA. The last parameter (0) is the signal line, which is not needed for this example. I placed a pink line at 15% to mark overbought conditions, which occurred in April, late September, late October and now. While I prefer simple moving averages (SMAs) to exponential moving averages (EMAs), SharpCharts does not have an indicator to express the difference between two SMAs. StockCharts ACP does though. The PPO is based on EMAs. As far as signals and expressing overbought conditions, there is not a huge difference between EMAs and SMAs.
20-March-2025: Bitcoin Remains with Double Top and Downtrend
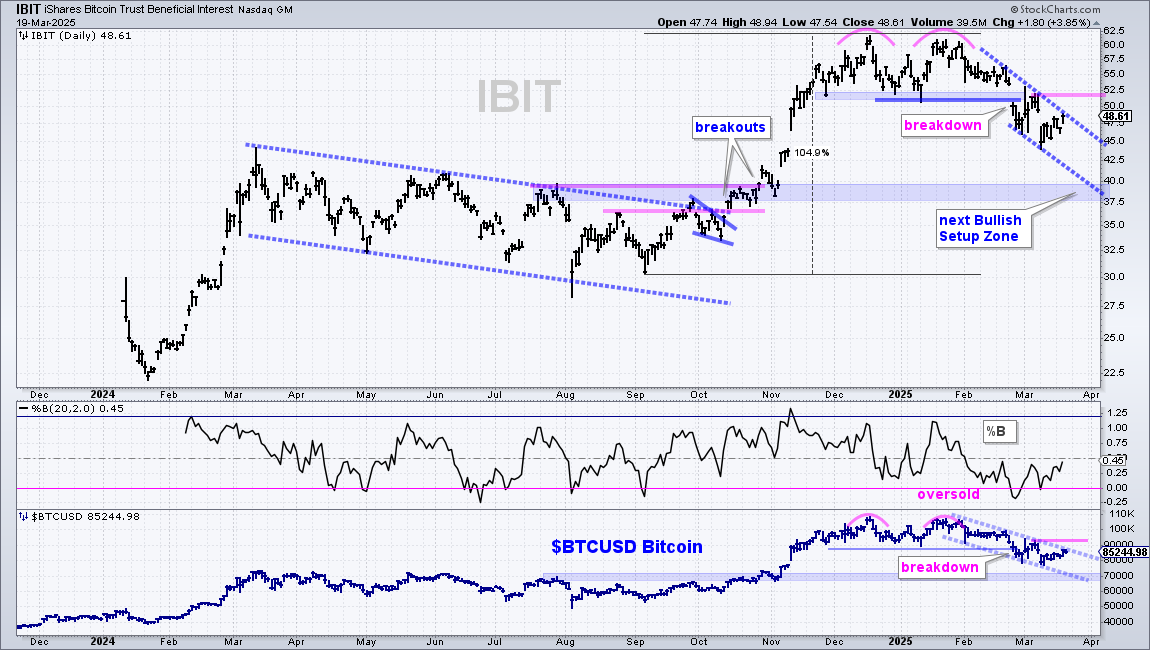
The Bitcoin ETF (IBIT) remains in a downtrend with a confirmed Double Top. The ETF formed two highs in the 62 area (pink arcs) and broke the intermittent low with a sharp decline in late January. There was a short bounce back to the breakout zone (blue shading), but this area turned into resistance as IBIT fell to the 45 area. The blue dashed lines define the downtrend with resistance marked at 52 (93,000 $BTCUSD). A breakout here would reverse the current downtrend and also negate the Double Top break.
BitCoin is part of the risk-on trade and the market is in risk-off mode right now. I am removing the retracements and the 200-day SMA because Bitcoin is prone to overshoots in both directions. I am now marking the next Bullish Setup Zone in the 37.5-40 area (70,000 $BTCUSD). Broken resistance levels based on the July and September highs (pink lines) turn into support here. The lower line of the falling channel also extends into this area. As long as the trend is down, this is the target zone.
2-April-2025: CIBR Tests Mid March Low and 200-day SMA
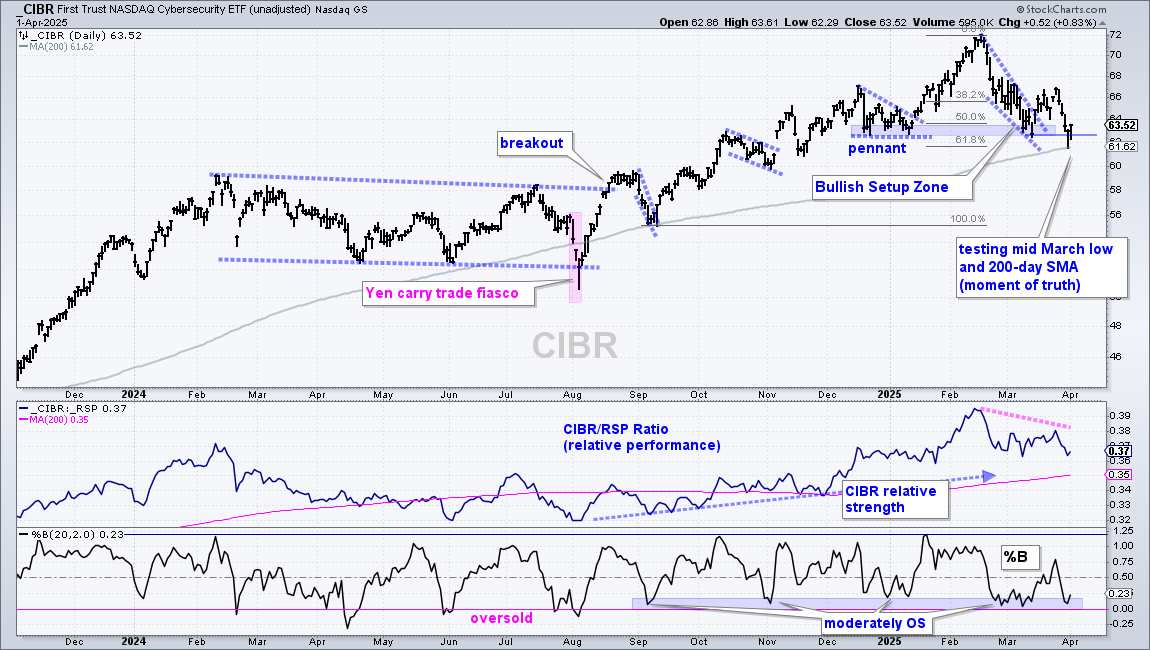
The Cybersecurity ETF (CIBR) is the strongest of the tech-related ETFs in my universe because it is the only that did not break its 200-day SMA and is still positive year-to-date (+.11%). Even so, CIBR is not immune to swings within the broader market and tech sector. The ETF broke out of a falling wedge with a surge in mid March, but gave it all back with a sharp decline last week. CIBR is now testing the mid March low and 200-day SMA. This is a moment of truth. Either the ETF firms and bounces or it fails and breaks down.
2-April-2025: ITA Falls Back to Breakout Zone
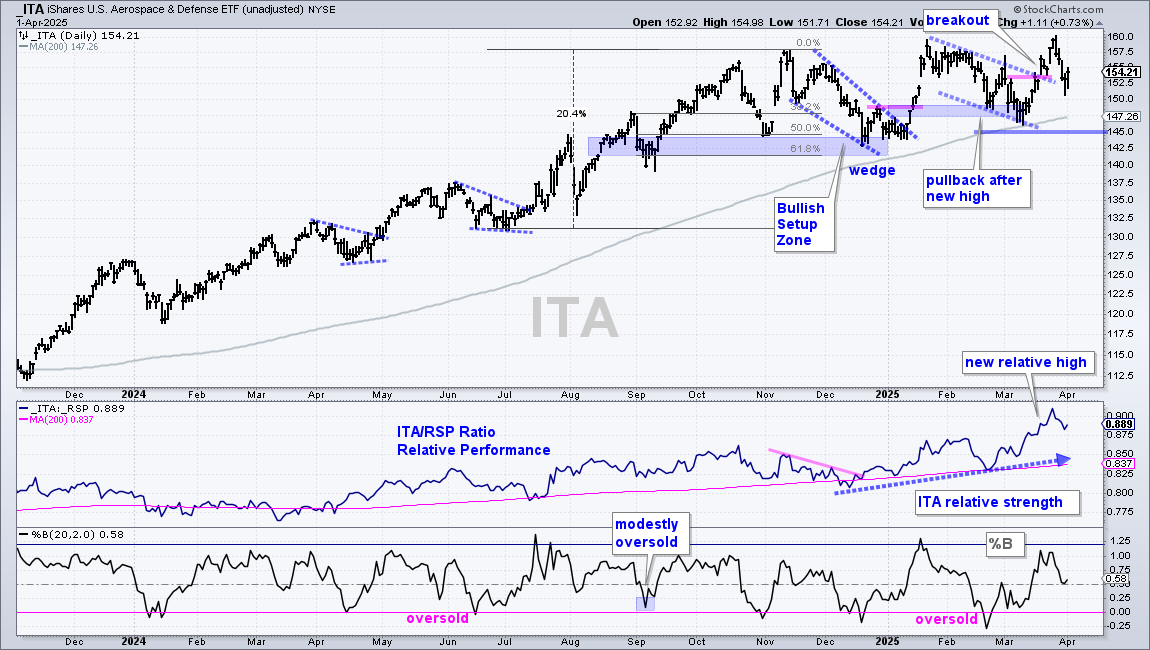
The Aerospace & Defense ETF (ITA) remains in a clear uptrend and shows relative strength. Short-term, ITA corrected with a falling channel into March. The ETF broke out with a surge into late March and tagged a 52-week high. Not many equity ETFs hit new highs in March. The new higher affirms the leading uptrend in ITA. Short-term, the ETF fell back with a sharp decline last week, but I view this as a random fluctuation or throwback to the breakout zone, which turns first support (152.5 area
")