Key Influences on Stock Performance – Bullish Patterns for Two Cybersecurity Stocks

Key Influences on Stock Performance – Bullish Patterns for Two Cybersecurity Stocks

Welcome to the Friday Chart Fix!

Trading is all about putting the odds in your favor. When picking stocks, we can improve our odds by staying on the right side of the market and focusing on names in leading sectors and industry groups. Today’s report starts with the market environment and a leading sector (tech). We then feature the leading uptrend in the Cybersecurity ETF and two names with bullish patterns.

  • Market, Sector and Industry Group Influence
  • Cybersecurity ETF in Leading Uptrend
  • Bullish Continuation Patterns for Two Cybersecurity Leaders

Recent Reports and Videos for Premium Members

Market, Sector and Industry Group Influence

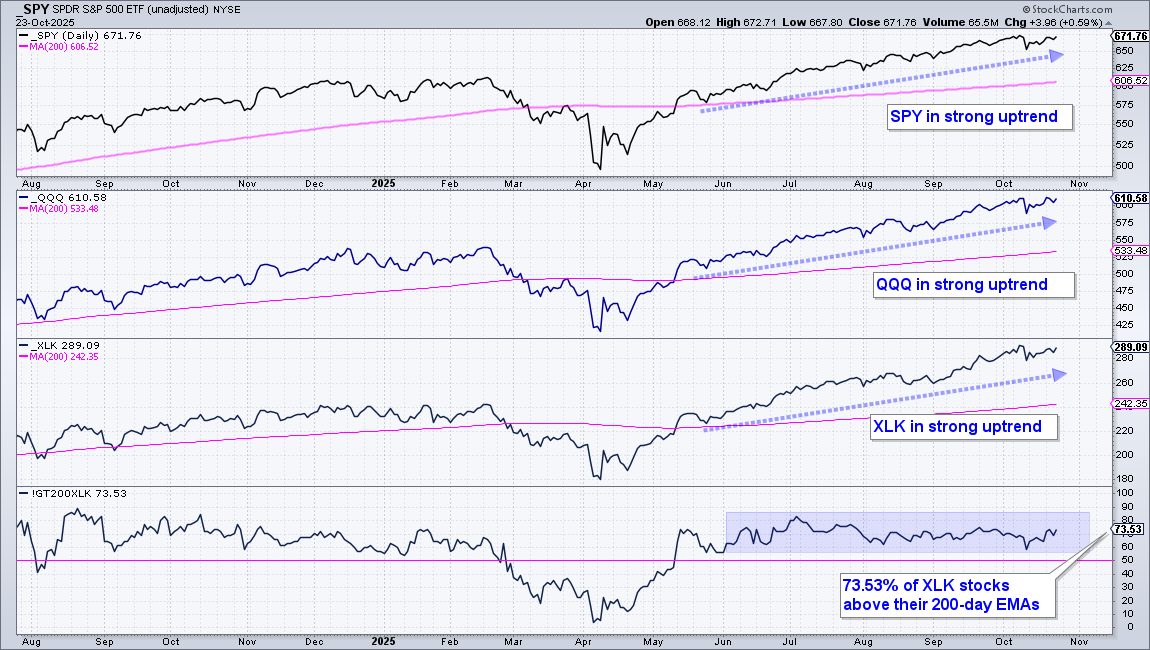
Many factors influence individual stock prices. Chief among these factors are the broad market environment, sector performance and industry group performance – in that order. Chartists should consider stocks during bull markets and stock alternatives during bear markets. There is clearly a bull market somewhere because SPY and QQQ hit new highs in October and remain well above their rising 200-day SMAs. Looking at sector performance, the Technology SPDR (XLK) is also in a leading uptrend and is the leading sector year-to-date (+24.91%). There is also broad strength within Technology because 73.55% of its stocks are above their 200-day EMAs. This is the second highest of the 11 sectors (XLU is tops with 100%!).

Looking for indicators with an edge? Check out the TIP Indicator-Edge Plugin for StockCharts ACP. Click here to learn more.

Cybersecurity ETF in Leading Uptrend

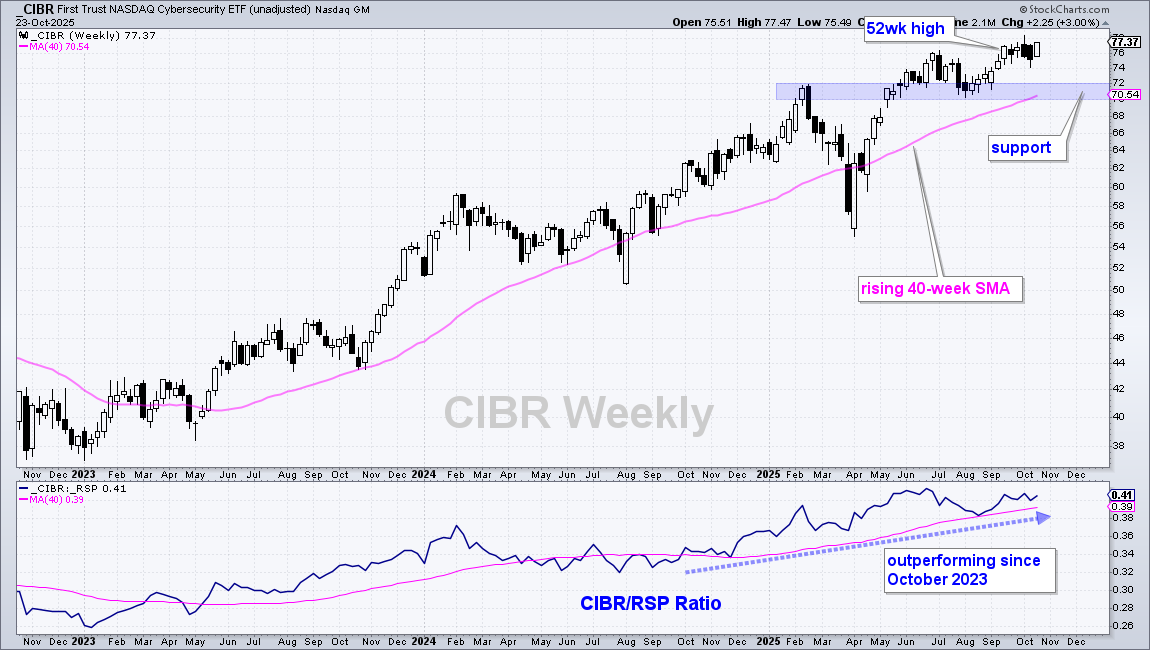
Within the technology sector, the Cybersecurity ETF (CIBR) is in a leading uptrend with price near a 52-week high and a rising relative performance line. Until these facts change, I expect this uptrend to continue. On the price chart, the trend is clearly up as CIBR hit 52-week highs from June to October and remains above the rising 40-week SMA. Broken resistance, the summer lows and 40-week SMA mark long-term support in the 70-72 area (blue shading). The bottom window shows the price-relative (CIBR/RSP ratio) turning up in late September 2023 and rising throughout 2025. This ratio rises when CIBR outperforms and falls when CIBR underperforms. The trend here favors relative strength because the price-relative is above its rising 40-week SMA.

Cup-with-Handle Pattern for Two Leaders

The market environment is bullish, technology is a leading sector and the Cybersecurity ETF sports a leading uptrend. This is an industry that warrants our attention for individual stock setups. Let’s look at two with classic bullish continuation patterns.

Popularized by William O’Neil of IBD, the cup-with-handle is a bullish continuation pattern. Here are some key characteristics. First, note that bullish continuation patterns form within uptrends and represent a consolidation within the uptrend. The cup forms with a pullback and recovery back to the prior highs. The handle forms with a shallower pullback or consolidation near the highs. Shallow pullbacks signal a decrease in selling pressure, which is a positive sign. The pattern highs mark rim resistance and overhead supply. A break above rim resistance signifies a material increase in buying pressure because demand overpowered supply. This breakout also signals the end of the consolidation phase and the resumption of the bigger uptrend.

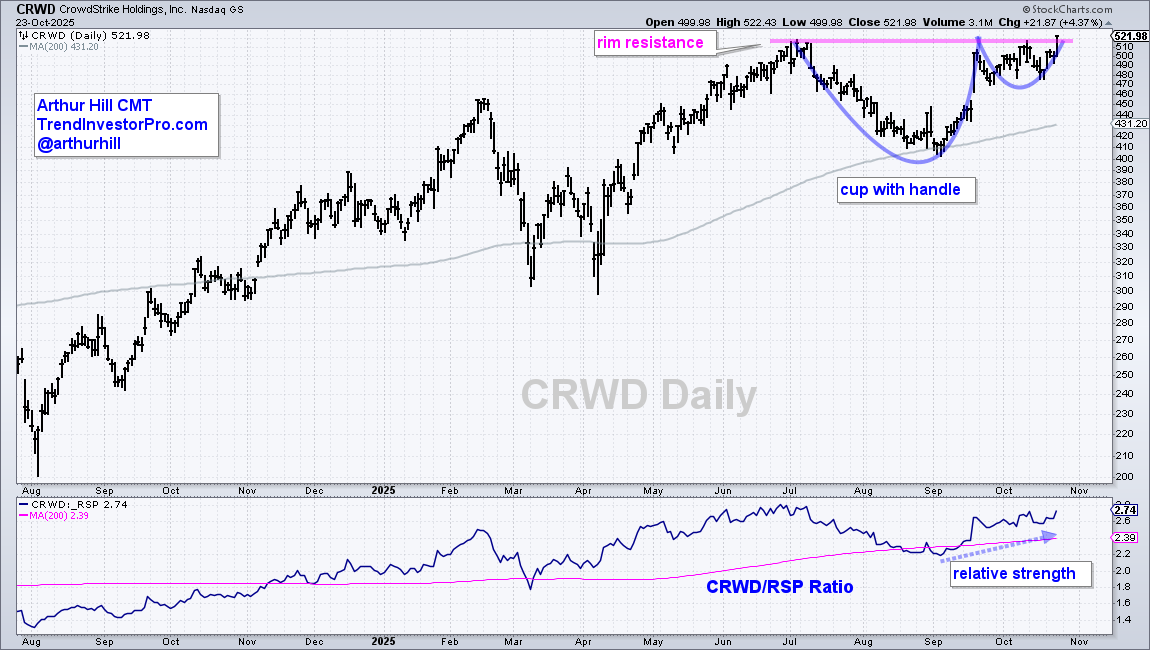
The chart above shows CrowdStrike (CRWD) with the cup-with-handle forming above the rising 200-day SMA. The right side of the pattern looks like a surge-flag setup. CRWD surged from the 200-day to rim resistance and then consolidated within a tight range. With a surge on Thursday, the stock broke rim resistance and recorded a fresh 52-week high. The lower window shows the price-relative (CRWD/RSP ratio) rising since early September as CrowdStrike outperforms. Note that I featured this stock in late August as it tested the 200-day SMA with a classic correction.

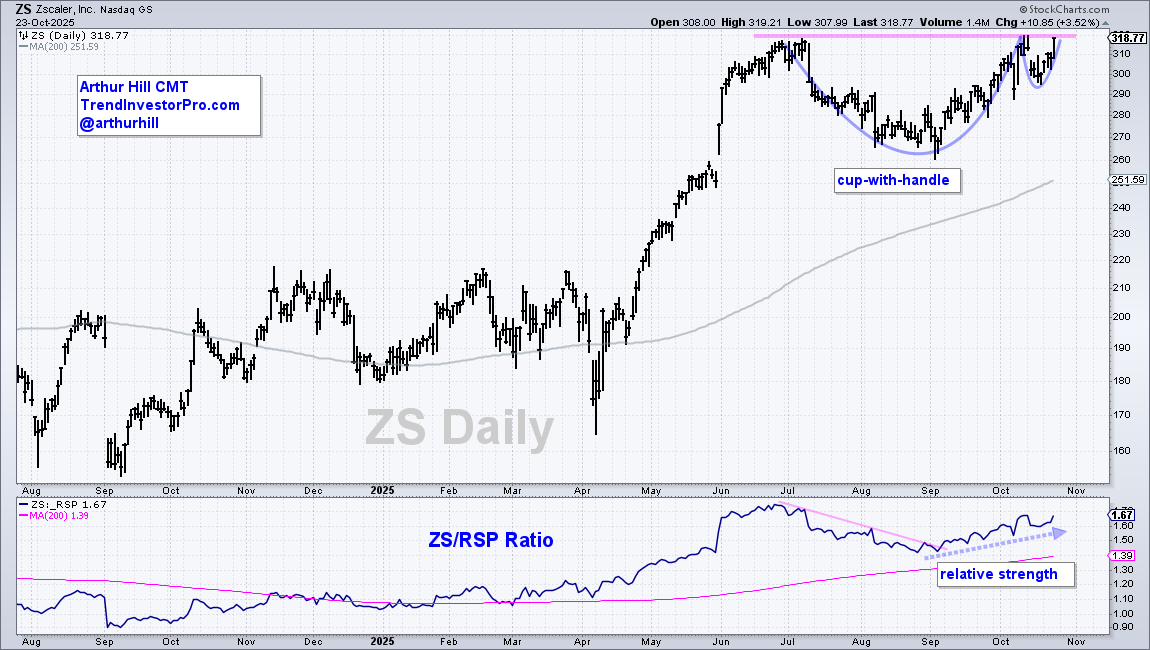
The next chart shows Zscaler (ZS) forming a cup-with-handle well above the rising 200-day SMA. ZS is currently challenging rim resistance and a breakout would confirm the pattern. The lower window shows the ZS/RSP ratio turning up in early September as ZS resumed its relative strength uptrend. Note that I featured ZS in early September as it firmed near a key retracement.

Recent Reports and Videos for Premium Members

QQQ Channels Higher – 5 Healthcare Leaders – Case Study on Trading Pullbacks (ARTY-MSFT)

Welcome to the Friday Chart Fix! Today’s report starts with the leading uptrend in QQQ. Large-caps tech stocks may seem ripe for a correction, but there are no signs of weakness on the price chart. Even though QQQ and the MAG7 are leading, there is strength in other areas with five healthcare stocks outperforming six of the MAG7. This report concludes with

QQQ Channels Higher – 5 Healthcare Leaders – Case Study on Trading Pullbacks (ARTY-MSFT) Read More »

Trend Signals in Healthcare and Healthcare Stocks – 5 New Signals and 12 Leading Uptrends

Welcome to the Friday Chart Fix! Today’s report focuses on the Healthcare sector, which sprang to life this week as the Trend Composite turned positive. This signal, however, was not the first bullish signal. Healthcare showed signs of capitulation at the end of July, there was a double bottom breakout in late August and a bull flag

Trend Signals in Healthcare and Healthcare Stocks – 5 New Signals and 12 Leading Uptrends Read More »

102 Days above 50-day – New Lows – Tech Power – Commodity Bulls – Oil Gets Interesting

SPY reached a milestone this week as it held above its 50-day SMA for more than 100 days, which was the seventh such occurrence since 2000. Even though SPY is 2.2% above its 50-day, only half of its components are above their 50-day SMAs and new lows are expanding. However, a correction in SPY could remain elusive until tech stocks and the MAG7 buckle. Elsewhere, it is a bull market in commodities and even energy is starting turn up.

102 Days above 50-day – New Lows – Tech Power – Commodity Bulls – Oil Gets Interesting Read More »

TLT Still Lagging, Best Hunting Grounds, IWM Starts Leading, Healthcare and Biogen

Welcome to the Friday Chart Fix! Bonds are surging, but not outperforming stocks, which is positive for stocks. Mid-caps show the most internal strength, but the Russell 2000 ETF is outperforming the S&P MidCap 400 SPDR. Healthcare breadth improved with a key indicator crossing the 50% threshold and XLV broke its

TLT Still Lagging, Best Hunting Grounds, IWM Starts Leading, Healthcare and Biogen Read More »

New Highs vs Lows, XLC Goes Beast Mode – Risk is On – Dissecting Gold – A Cyber Setup

Welcome to the Friday Chart Fix! Today’s report starts with a bullish breadth indicator and the level to watch going forward. We then turn to the strongest sector: Communication Services. It has been on fire since May and continues to lead. Overall, stocks are in good shape because the EW Technology sector is trading above resistance

New Highs vs Lows, XLC Goes Beast Mode – Risk is On – Dissecting Gold – A Cyber Setup Read More »

Uptrends Expand, Tech Consolidates, Cybersecurity Breaks Out, A Classic Trading Setup – Big Banks Lead

Welcome to the Friday Chart Fix. Today’s report starts with the percentage of stocks above their 200-day SMAs, which hit a multi-month high as uptrends expand. The Technology SPDR is above its 200-day, but consolidating the last four weeks as it digests big gains. Within tech, the Cybersecurity ETF broke out after a pullback and a top component

Uptrends Expand, Tech Consolidates, Cybersecurity Breaks Out, A Classic Trading Setup – Big Banks Lead Read More »

StockMarketTV – Breadth Expands – Tech ETFs Correct – 3 Stock Setups

Analysis starts with the long-term trends and support levels for SPY and QQQ. Upside participation expanded last week as the percentage of stocks above the 200-day surge. New highs are the next item to watch. Breadth improved as new leaders emerged and tech ETFs corrective. Watch XLK, SMH and MAGS for clues on the correction. There are also three stock setups.

StockMarketTV – Breadth Expands – Tech ETFs Correct – 3 Stock Setups Read More »

QQQ Overtakes QQEW – GOOGL Near High – Groups with Most Highs – Verizon Gaps

Welcome to your Friday Chart Fix. Today’s report starts with year-to-date performance for QQQ and its equal-weight brother (QQEW). We then look at the leaders within QQQ and single out Alphabet because it is close to a new high. Attention then turns to small and mid caps because they led the market this week. New highs are still sparse within the space. We then show a ranking table to find the groups with the most new highs. And finally,

QQQ Overtakes QQEW – GOOGL Near High – Groups with Most Highs – Verizon Gaps Read More »

Friday Chart Fix – 2024 vs 2025 – Commodities with Crypto – Key Moment for IWM – The Tesla Squeeze

Welcome to your Friday Chart Fix. Today we start with the difference between the 2024 bull market and the 2025 bull run. The S&P Total Market Index ETF hit new highs in July, but 2025 breadth is not what it was in 2024. Small-caps are weighing on the broader market as the Russell 2000 ETF battles its 200-day SMA. Even though QQQ is leading the major index ETFs with a double-digit gain

Friday Chart Fix – 2024 vs 2025 – Commodities with Crypto – Key Moment for IWM – The Tesla Squeeze Read More »

Chart Mania – 23 ATR Move in QQQ – Metals Lead 2025 – XLV Oversold – XLU Breakout – ITB Moment of Truth

Here are some charts that reflect our areas of focus this week at TrendInvestorPro. SPY and QQQ are leading the market, but the tech trade is looking extended and ripe for a rest. Small-caps are still underperforming large-caps. Even though Utilities are not leading in percentage terms, XLU is leading

Chart Mania – 23 ATR Move in QQQ – Metals Lead 2025 – XLV Oversold – XLU Breakout – ITB Moment of Truth Read More »

How to Improve your Trading Odds and Increase Opportunities

Chartists can improve their odds and increase the number of opportunities by trading short-term bullish setups within bigger trends. The first order of business is to identify the long-term trend using a trend-following indicator. Second, chartist can turn to more granular analysis to find short-term bullish setups. Today’s example will use the Cloud Computing ETF (SKYY).

How to Improve your Trading Odds and Increase Opportunities Read More »

Lagging Mid-cap ETF Hits its Moment of Truth  

The S&P MidCap 400 SPDR (MDY) is trading at a moment of truth as its 5-day SMA returns to the 200-day SMA. A bearish trend signal triggered in early March. Despite a strong bounce from early April to mid May, this signal remains in force because it has yet to be proven otherwise. Today’s report will show how to quantify signals and reduce whipsaws using the percentage difference between two SMAs.

Lagging Mid-cap ETF Hits its Moment of Truth   Read More »

Tech ETFs are Leading Since April, but Another Group is Leading YTD

QQQ and tech ETFs are leading the surge off the April low, but there is another group leading year-to-date. Year-to-date performance is important because it includes two big events: the stock market decline from mid February to early April and the steep surge into early June. We need to combine these two events for a complete performance picture.

Tech ETFs are Leading Since April, but Another Group is Leading YTD Read More »

SPY Recaptures 200-day – Tips to Reduce Whipsaws and Improve Performance

SPY and QQQ crossed above their 200-day SMAs with big moves on Monday, and held above these long-term moving averages the entire week. The V-Reversal was extraordinary and SPY seems short-term overbought, but this cross above the 200 day SMA cross is a bullish signal for the most important market benchmark. Despite a bullish signal, long-term moving averages are

SPY Recaptures 200-day – Tips to Reduce Whipsaws and Improve Performance Read More »

Scroll to Top