As noted in reports last week, conditions are ripe for a correction in the stock market and tech-related ETFs are seriously extended. We cannot predict the length, duration or path for a correction, but we can identify periods when the odds favor a correction and trade accordingly. This means taking some money off the table and/or waiting patiently for a robust setup.
Chartists can mark future support levels for an idea on how deep a correction might extend. However, we should be careful with expectations. The best approach is usually to let the correction unfold and wait for a tradable setup to emerge. Without expectations. This could take weeks or months. Let the market come to you and the setup will be clear when it emerges.
Cloud and CyberSecurity Lag within Tech
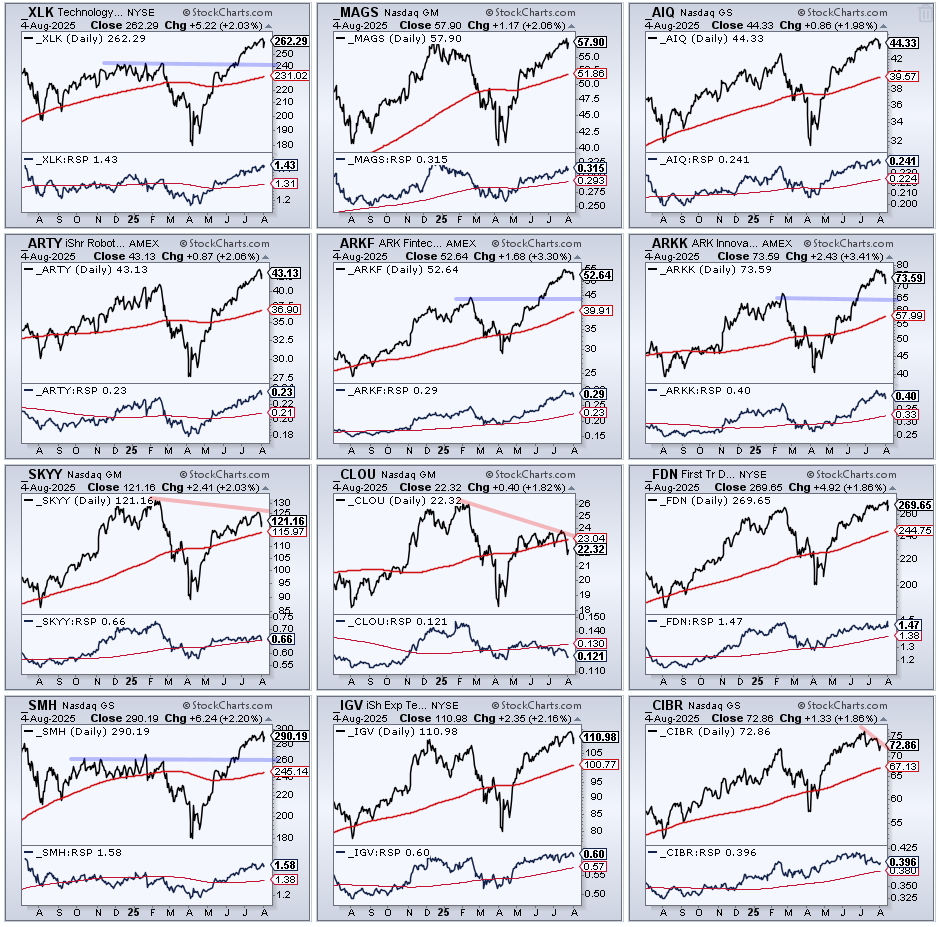
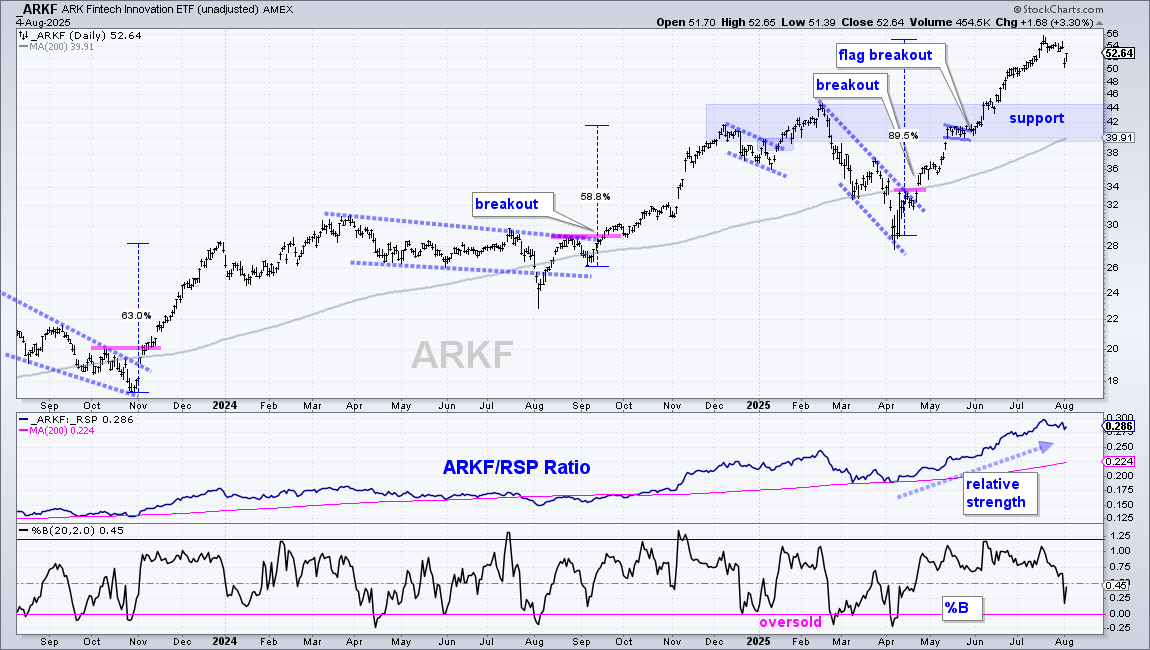
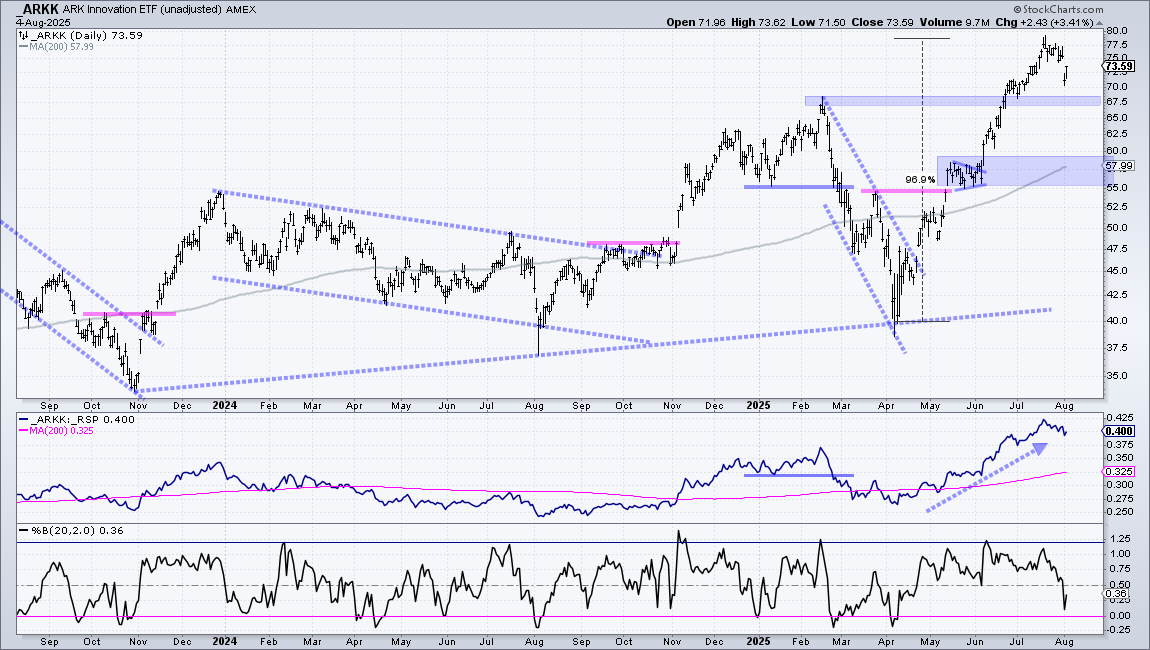
The first image shows CandleGlance charts for the Technology SPDR (XLK) and 11 tech ETFs. These lines charts show the 200-day SMA (red) and the price-relative in the lower window (XLK/RSP ratio). In the top left corner, XLK is trading near a 52-week high and well above its rising 200-day SMA. This makes it a long-term leader. The blue line shows broken resistance, which turns into future support in the 240 area. The rising 200-day SMA is at 231 and will possibly hit 240 in the coming weeks. A normal correction could return to the prior high (breakout) and rising 200-day SMA. This is also possible for ARKF, ARKK and SMH (see blue lines).
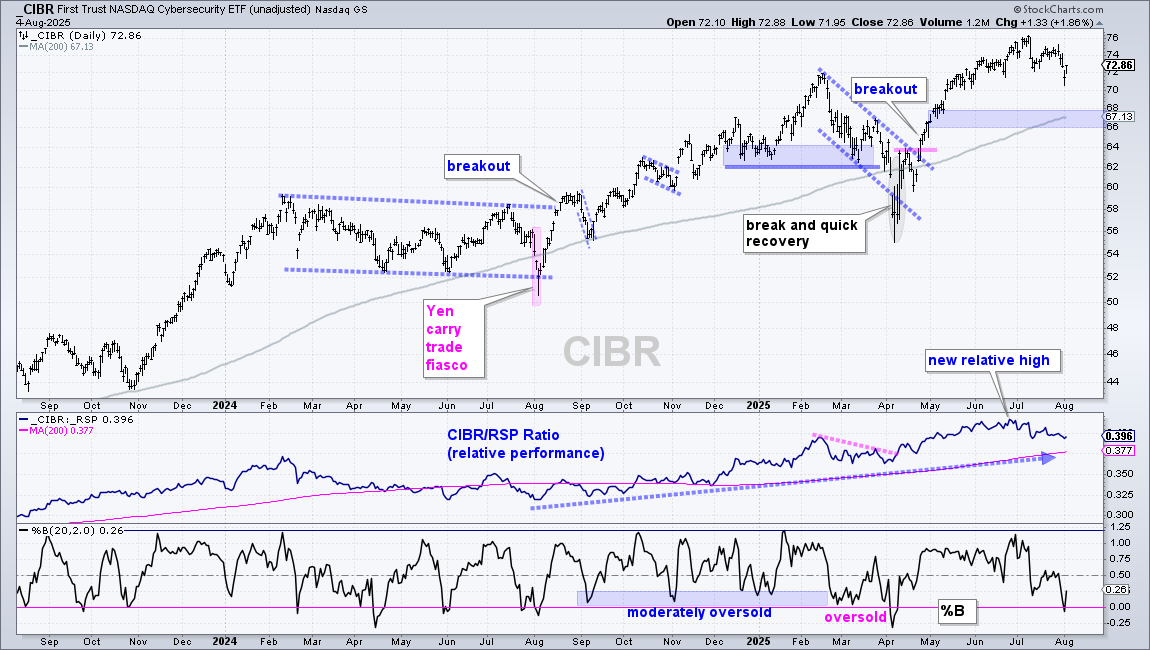
The downward sloping red lines show lower highs in the Cloud ETF (CLOU), Cloud Computing ETF (SKYY) and Cybersecurity ETF (CIBR). CLOU is seriously lagging and already below its 200-day SMA, and below its June-July lows. SKYY is lagging because it fell short of its February high. CIBR is lagging short-term because it formed a lower high in July. CIBR remains in a long-term uptrend, but already moved into correction mode.
Tech ETFs Trigger Chandelier Exits
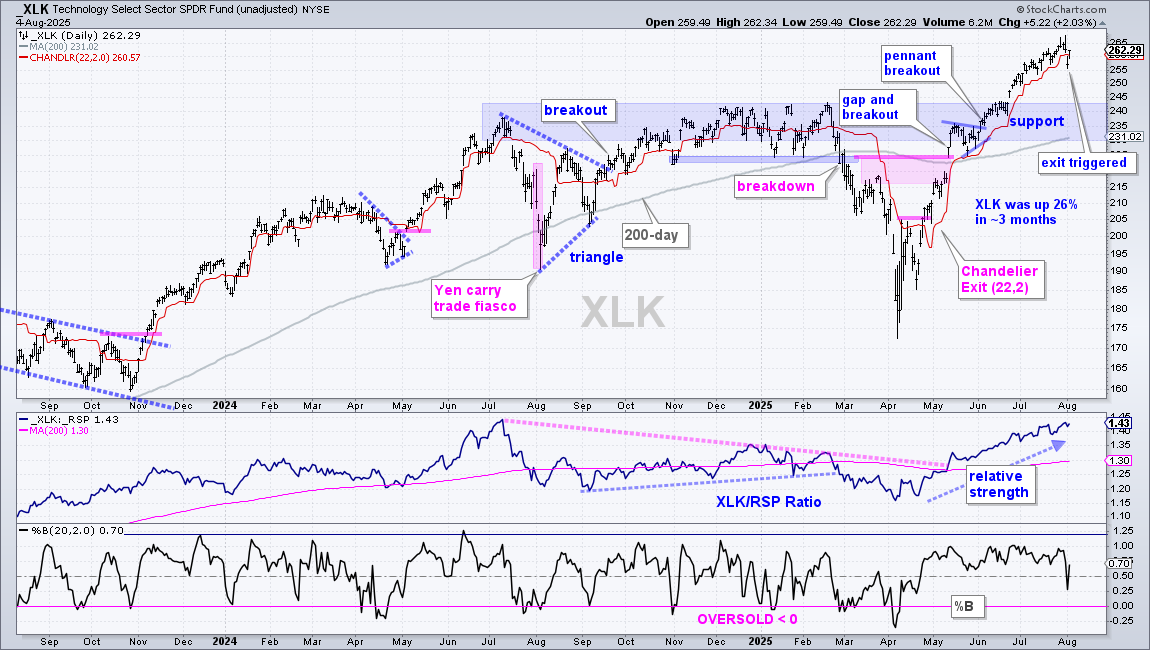
All tech related ETFs triggered their Chandelier Exits with sharp declines on Friday. The Chandelier Exit (22,2) is a trailing stop that is 2 ATR(22) values below the 22-day high. It rises and trails price as long as there are higher highs. A close below the Chandelier Exit means the decline from the 22-day high was more than 2 ATR(22) values. This is not a bearish signal. It is just an indicator chartists can use to trail stops and manage risk.
The example below shows the Technology SPDR (XLK) with a pennant breakout in June (~238) and a trailing stop triggered on Friday’s close. XLK opened at 259.49 Monday and the exit resulted in a 9% gain (259.49 – 238 = 21.49 and 21.49/238 = .09 or 9%). Not bad.
A close below the Chandelier Exit is not bearish, but it does represent an outsized decline (> 2 ATR(22) values). XLK is still in a long-term uptrend with a new high last week and price well above the 200-day SMA. The middle window shows the price-relative hitting a new high as XLK leads the market. Strategically, XLK is still bullish.
Tactically, XLK is overextended and ripe for a correction. As with most other tech-related ETFs, XLK became very extended after a 26% surge in three months. This move was pretty much straight up, and a rest is needed to digest these gains. Corrections come in different forms. We could see a sharp pullback, a choppy trading range or zigzag lower.
Support Levels are Guesstimates
We can often make a good argument for future support levels. Note that support levels are always obvious in hindsight. Chartists can use prior lows, broken resistance levels, key retracements, volume-by-price and/or moving averages. There are lots of options here, perhaps too many. Truth be told, support levels are guesstimates because nobody can predict the future.
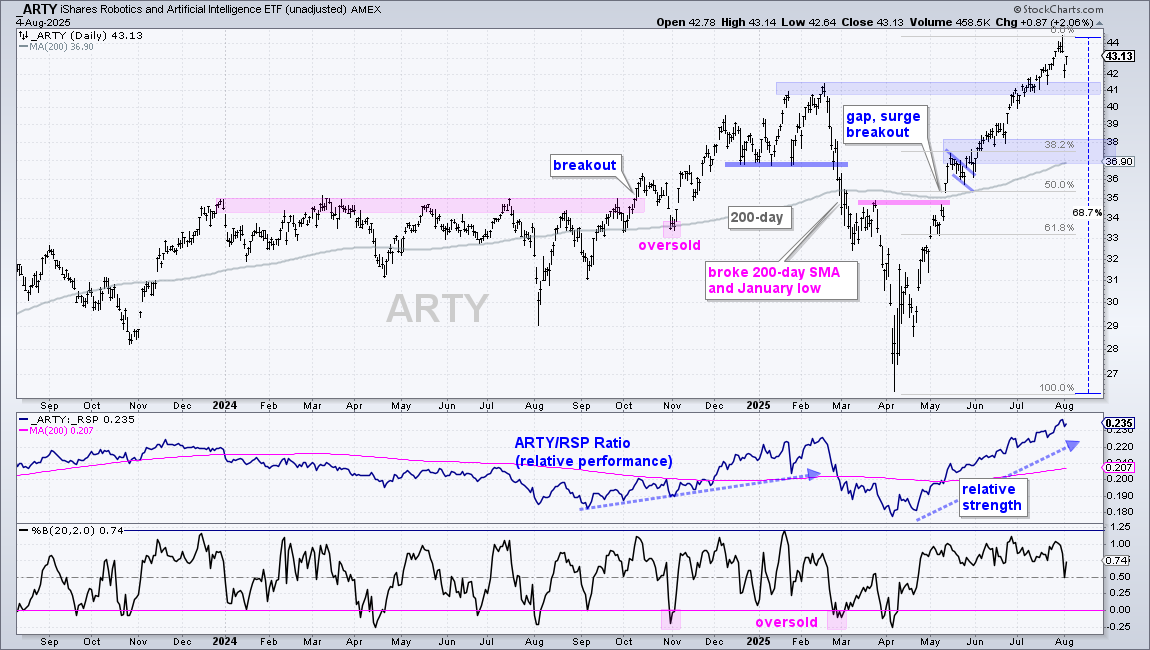
The chart below shows the Robotics AI ETF (ARTY) with a 60+ percent advance from early April to late July. Broken resistance in the 41 area turns first support. There is also support in the 37-38 area from the rising 200-day SMA and 38% retracement. These are my best guesstimates.
The reality is this: ARTY is seriously extended and ripe for a correction. The only thing to do now is respect these conditions and let price action unfold. Exercise some patience and let the market produce a tradable setup. There is no setup on this chart right now, but one could emerge in the coming weeks or months.
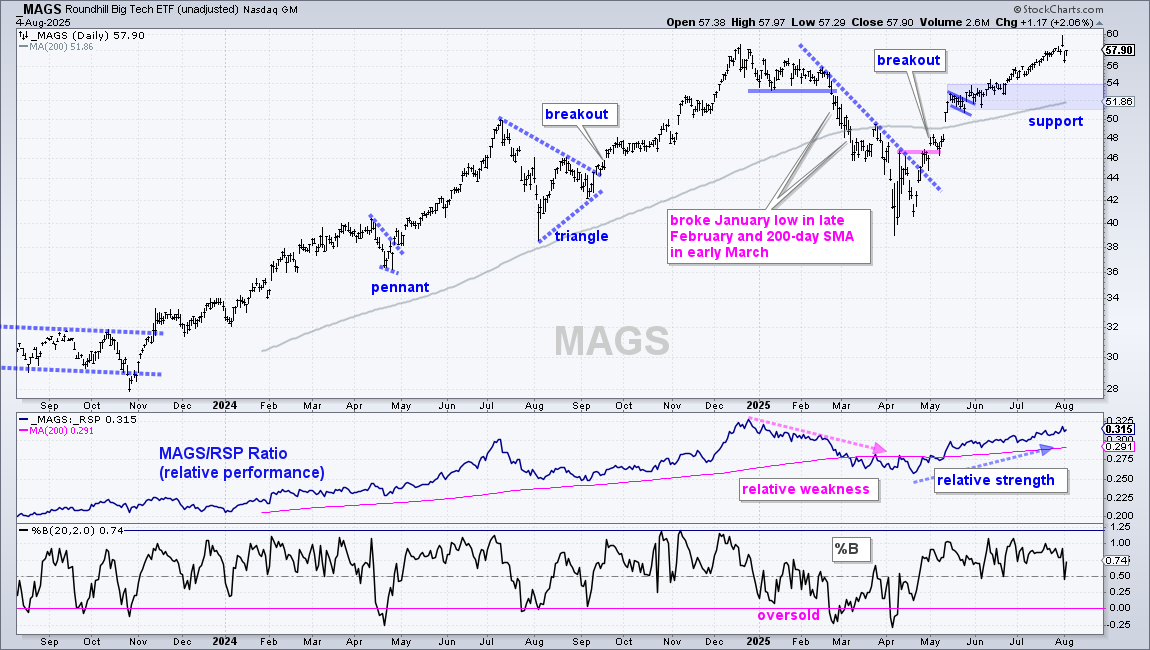
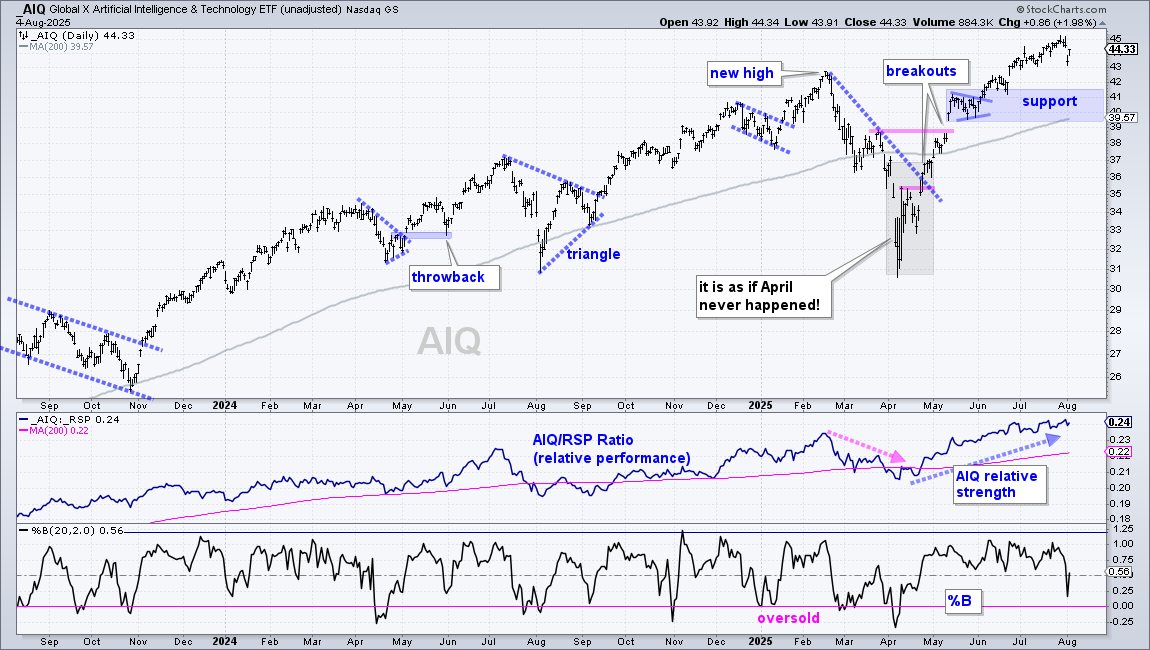
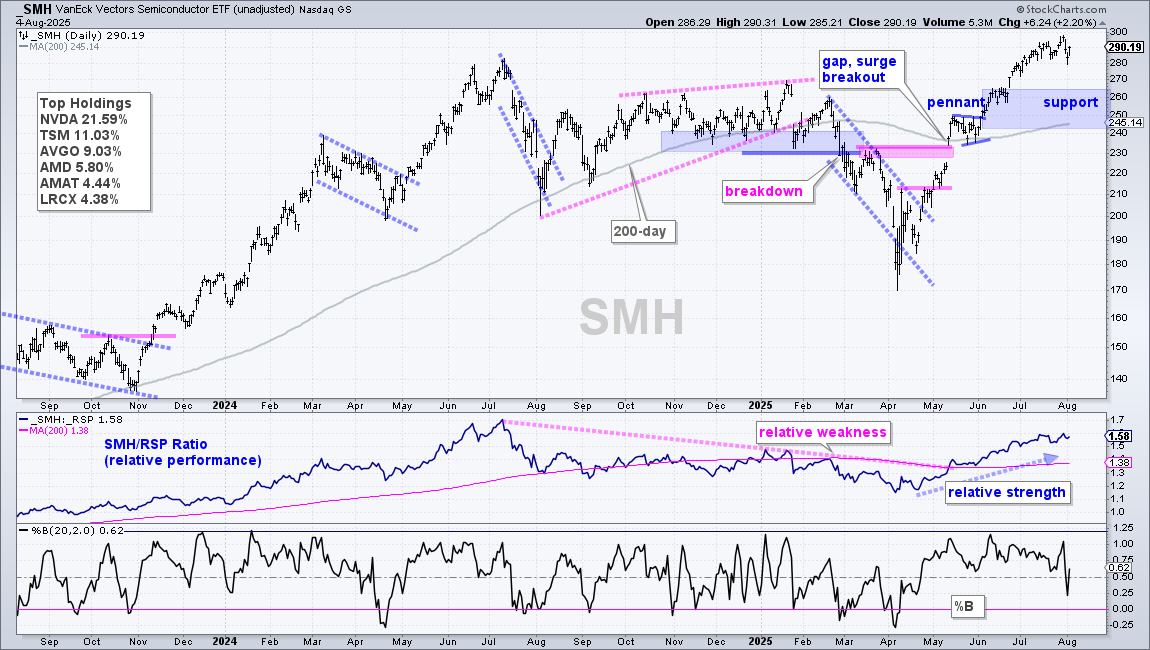
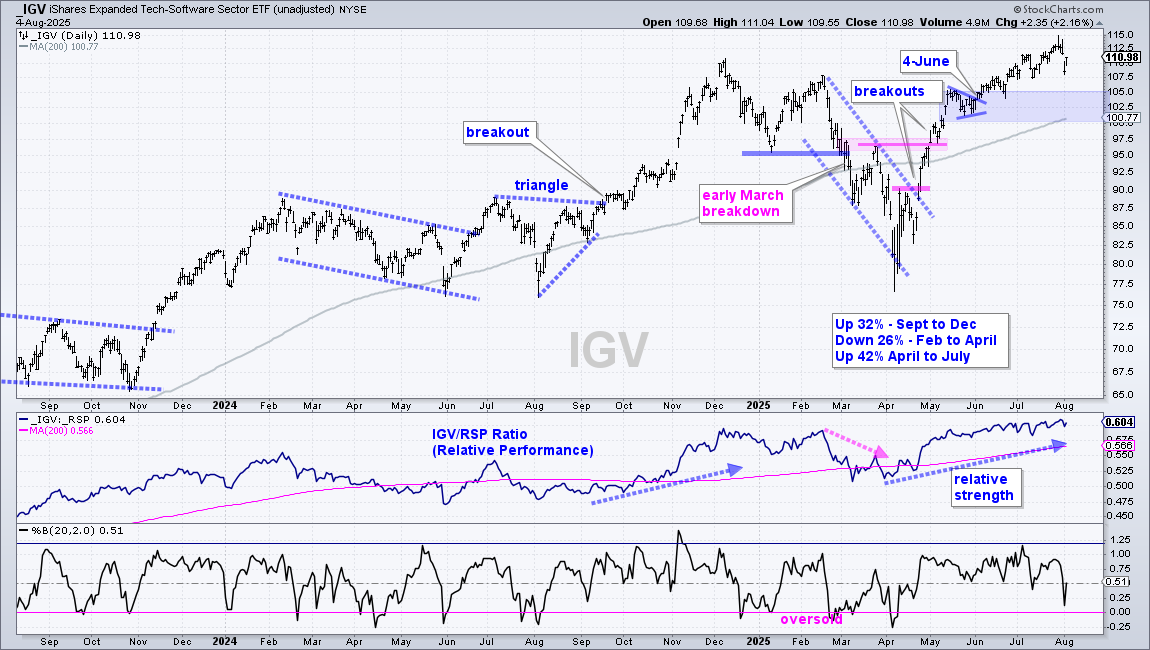
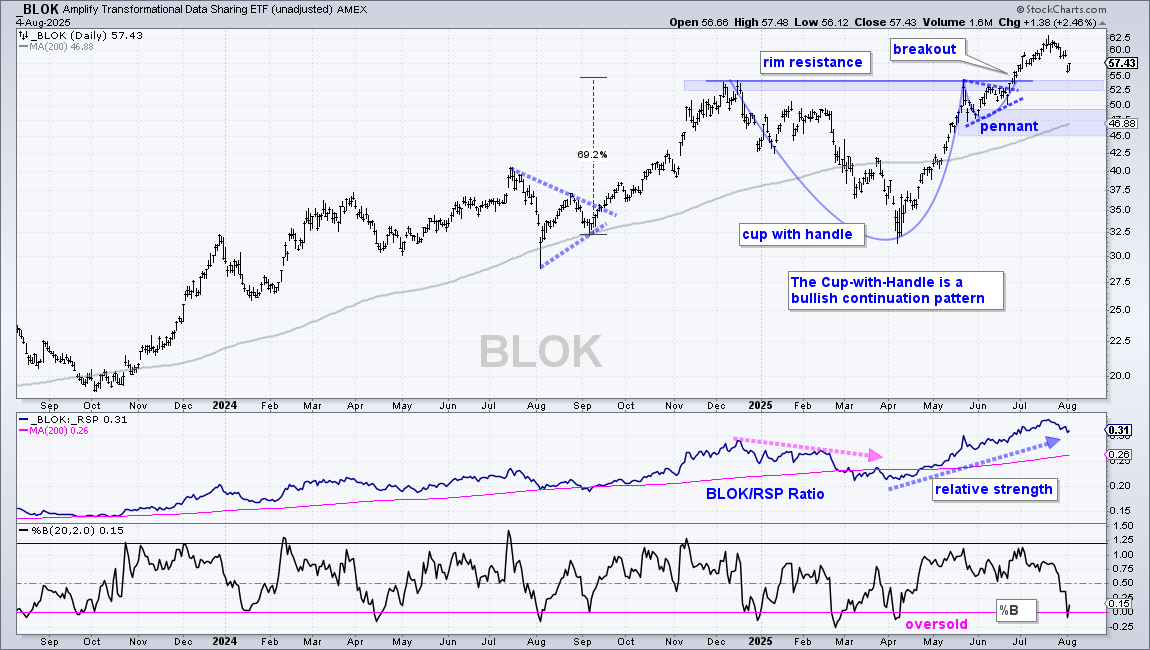
Support Guesstimates (MAGS, AIQ, ARKK, SMH, IGV, CIBR, BLOK)
Note the tech-related ETFs are positively correlated. This means they move in the same direction. Do not expect one of these to buck the trend, should QQQ and XLK correct. The charts below shows support guesstimates with blue shading.
Send feedback to support(at)trendinvestorpro.com or use the contact form.