Note that the NYSE and Nasdaq close early on Christmas Eve and are closed Christmas Day, as well as New Years Day.
NYSE and Nasdaq Schedule:
Closed – Thursday – January 1st
TrendInvestorPro will publish reports with videos on the following days:
Tuesday – December 30th
The normal publishing schedule resumes on Tuesday, January 6th
Happy New Year!
Evidence Remains Bullish
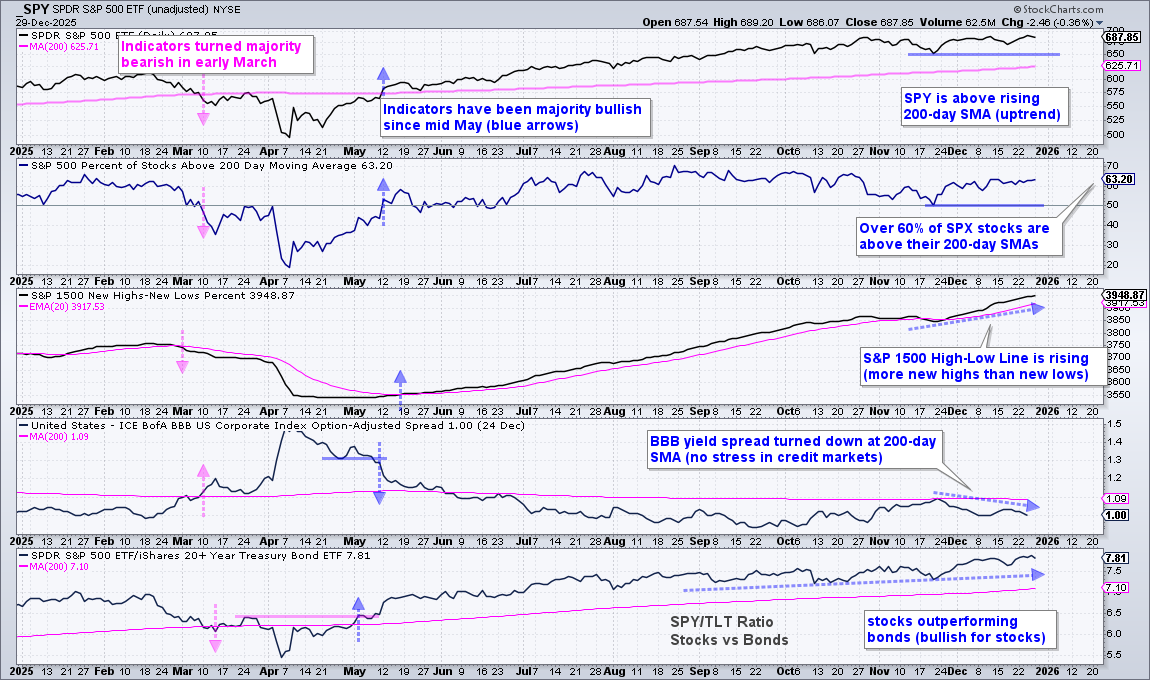
The weight of the evidence remains bullish for stocks. SPY hit a new high in late December and remains above its rising 200-day SMA. 63.2% of S&P 500 stocks are also above their 200-day SMAs. Even though this means around a third (36.8%) are below their 200-day SMAs, the vast majority of stocks are in long-term uptrends and this is net bullish. New highs continue to outpace new lows as the S&P 1500 High-Low Line rose throughout December (middle window).
The BBB yield spread turned down (narrowed) in April-May and moved below its 200-day SMA in early June. It remains below its 200-day and this shows confidence in the credit markets. The BBB spread is the difference between the BBB corporate bond yield and US Treasury bond yield. BBB bonds are riskier than safe-haven bonds. The closer their yields (narrow spread), the more confidence bond traders have in BBB bonds. The bottom window shows the SPY/TLT ratio rising as stocks (risk assets) continue to outperform bonds (safe haven assets).
SPY: Bullish Until Proven Otherwise
Robert Rhea wrote the definitive guide to Dow Theory in his 1932 classic, The Dow Theory. “Trend persistence” is the sixth tenet of his Dow Theory framework. This tenet means the prevailing trend is in force until proven otherwise. Neither the length nor the duration can be forecast. And, trends often extend further than most expect.
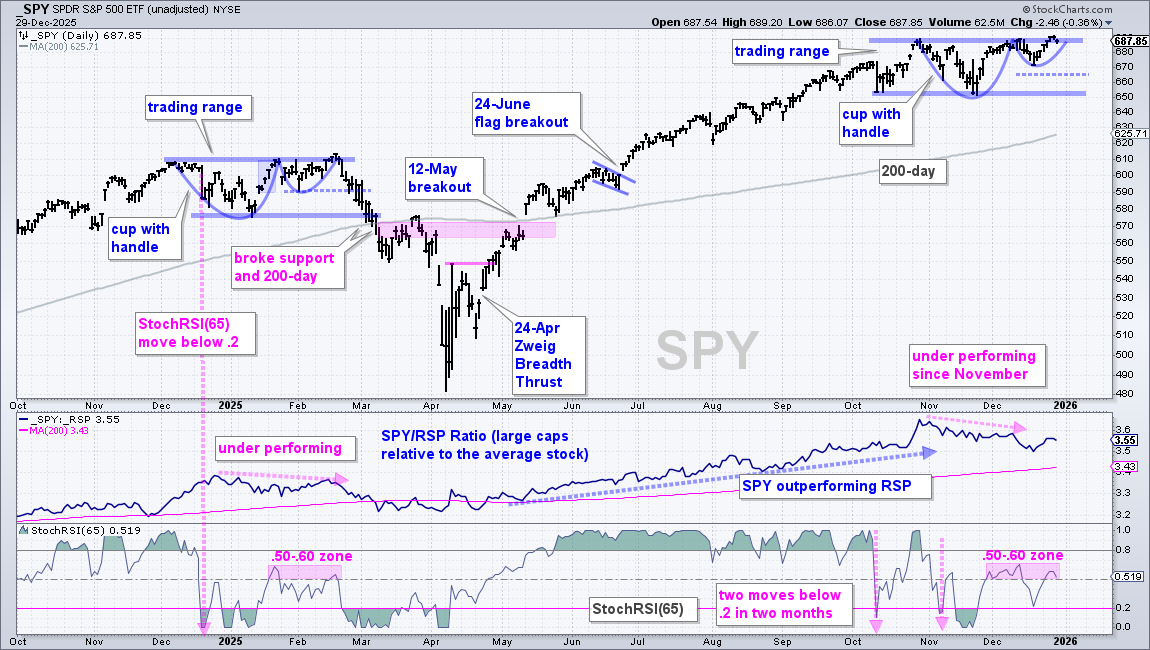
SPY triggered an uptrend signal in mid May with the break above the 200-day SMA and remains in an uptrend. There were small pullbacks along the way with a new high in late October. At this point, we assume the uptrend will continue until there is evidence to prove otherwise.
SPY consolidated from October to December as a cup-with-handle formed. This is a bullish continuation pattern that forms within an uptrend. The ETF broke rim resistance three days ago and this signals a continuation higher. So far so good.
I continue to see parallels with the period from December 2024 to February 2025. SPY also broke rim resistance in late February, but this breakout did not hold as the ETF broke first support at 590 (blue dashed line). SPY then continued lower with a break below the 200-day in early March.
Currently, the trend is up and the rim breakout is bullish. The blue dashed line marks first support at 665. This is based on the mid December lower and a buffer. A break here would negate the cup-with-handle. This would be the first sign of trouble.
The indicator window shows StochRSI(65) plunging below .20 twice and then failing in the .50-.60 zone (pink shading). Again, we can see parallels with January-February. Keep in mind that StochRSI measures momentum and price momentum slowed as the trading range unfolded from October to December. It is normal for momentum to take a hit during a trading range. Therefore, we need to wait for confirmation from price. A price break below 665 would confirm.
QQQ and MAGS Hold Breakouts as XLK Rebounds
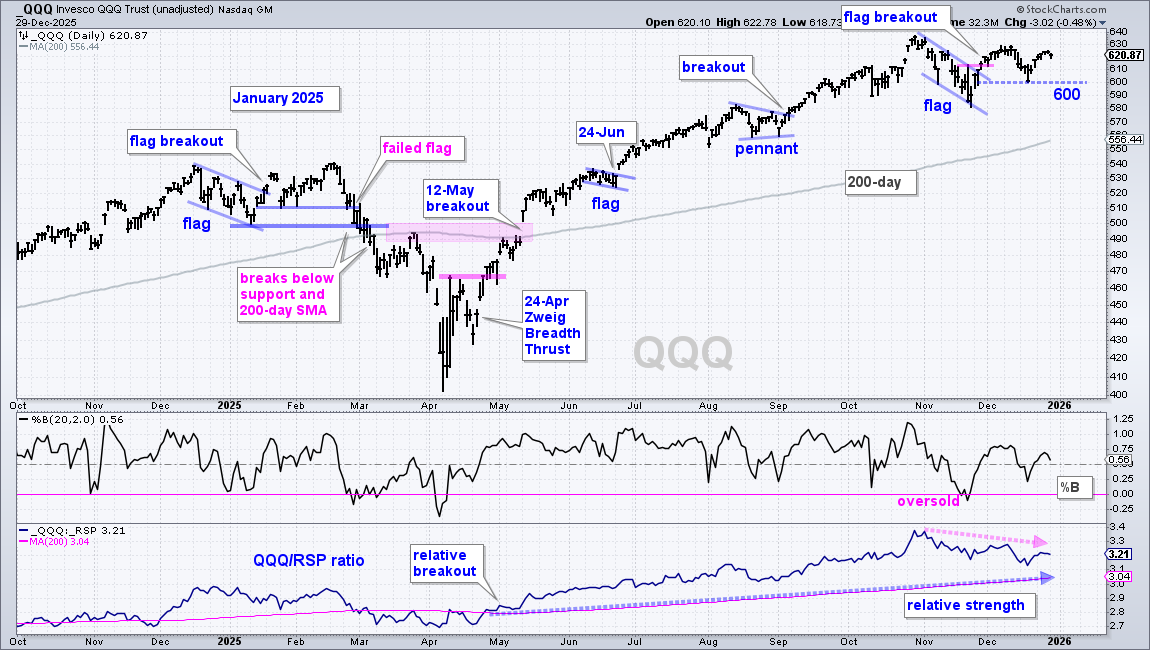
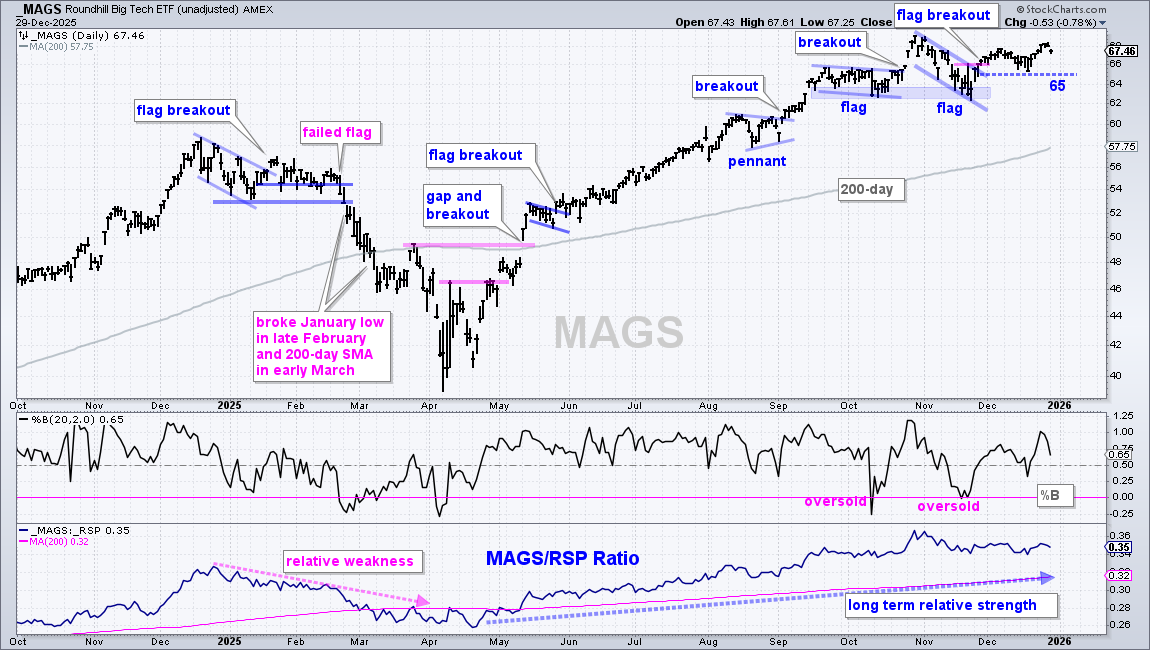
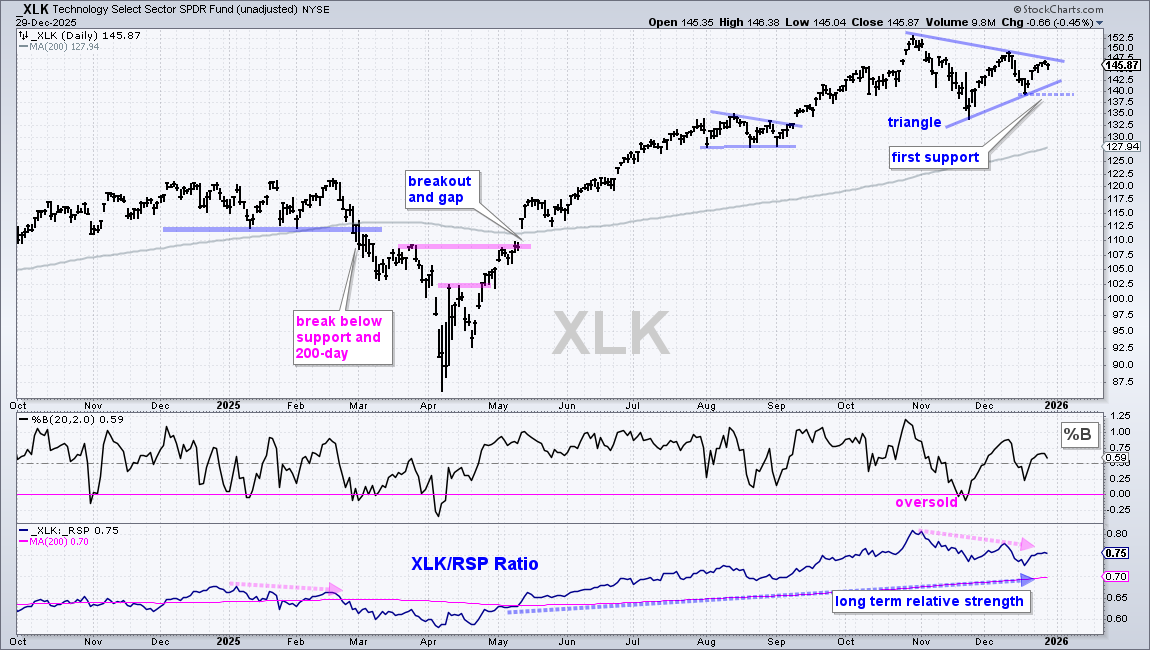
QQQ, the Mag7 ETF (MAGS) and Technology SPDR (XLK) represent the tech trade, and around a third of the S&P 500. QQQ and MAGS are in long-term uptrends and holding their flag breakouts. XLK rebounded and formed a possible triangle consolidation with its long-term uptrend.
The first chart shows QQQ with a flag breakout in late November, a short pullback to 600 in mid December and a bounce back above 620. Flags represent short-term corrections after an advance. The flag breakout survived the pullback and held its re-evaluation level. A close below 600 would negate the flag breakout and argue for a deeper correction, perhaps towards the rising 200-day SMA.
The next chart shows MAGS forming flags into October and November. Most recently, MAGS broke flag resistance with a surge in late November and then consolidated around the breakout zone. Note that this breakout is holding and remains bullish until proven otherwise. The blue dashed line marks re-evaluation support at 65. A close below this level would negate the flag breakout and argue for a deeper correction within the long-term uptrend.
The next chart shows XLK with a triangle taking shape. The long-term trend is up so this triangle is considered a bullish continuation pattern. It represents a consolidation or rest within the trend. A break above the mid December high (150) would confirm the triangle. The mid December low marks re-evaluation support at 139. A close below this level would negate the triangle and argue for a deeper correction within the long-term uptrend.
SPY, QQQ, MAGS and XLK hold the key for large-caps and tech stocks. As long as the first re-evaluation levels hold, the market is in good shape. Trouble starts when three of the four break their re-evaluation levels (blue dashed lines). This would not necessarily lead to a bear market, but it could signal a deeper correction.
Big Sectors Remain Strong
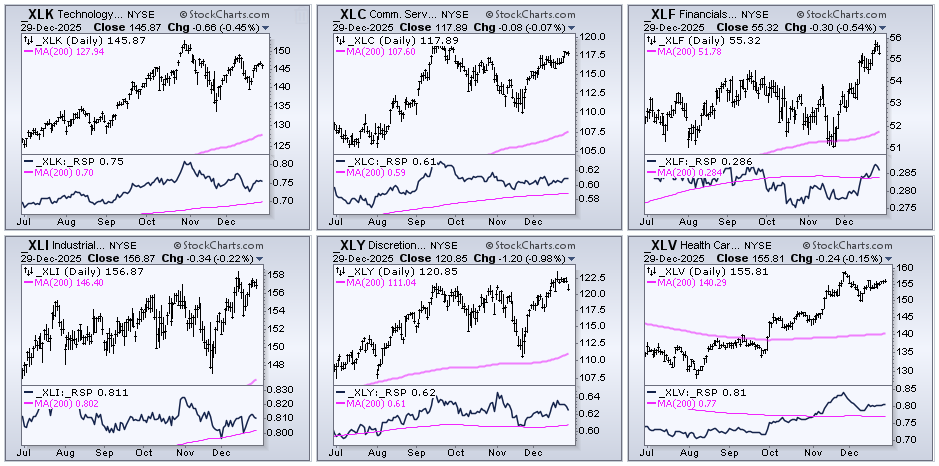
The Technology SPDR (XLK) is the biggest sector in the S&P 500 with a 34.5% weighting. The other big sectors are Finance (13.4%), Consumer Discretionary (10.5%), Communication Services (10.5%), Healthcare (9.5%) and Industrials (8.2%). Together, these six sectors account for a whopping 86.7% of the S&P 500. This leaves the remaining 13.3% to be divided among the other five sectors.
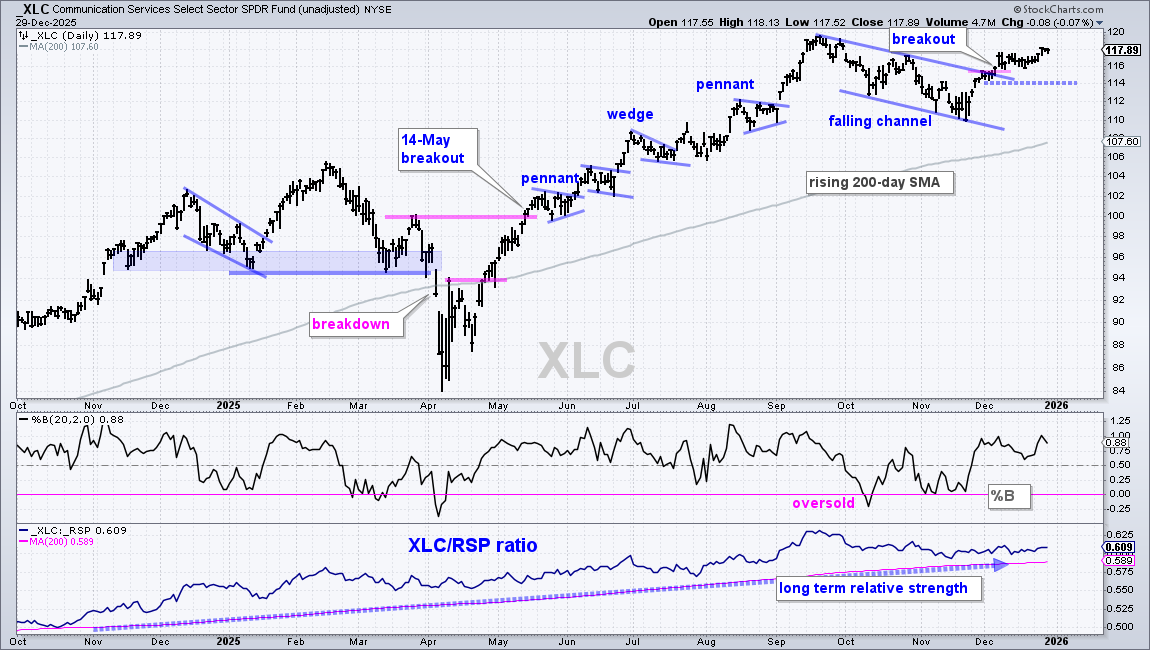
I do not see any setups on the charts for the big sectors, but they are in leading uptrends and above their 200-day SMAs (pink lines). The Consumer Discretionary SPDR (XLY), Finance SPDR (XLF) and Industrials SPDR (XLI) hit new highs in December. The Healthcare SPDR (XLV) it still below its November high, but is the leading sector since August with a 14.25% gain the last 84 days. The Communication Services SPDR (XLC) corrected with a falling channel into November and broke out in early December. This breakout is holding with the re-evaluation level set at 114.
Leadership Shake Up since November
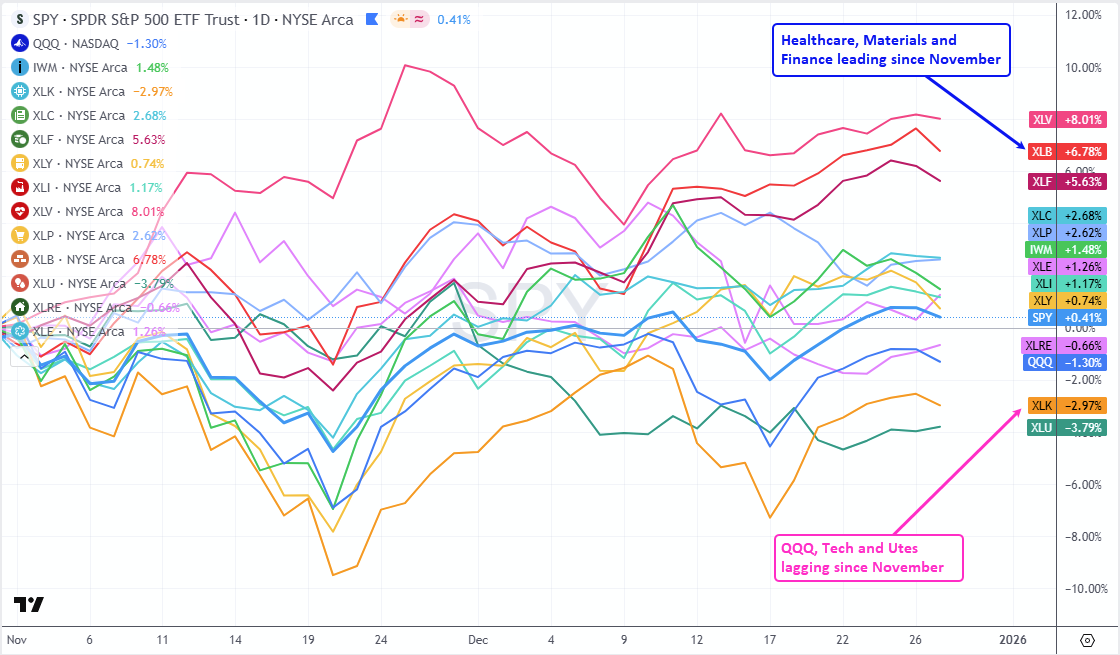
QQQ and XLK led the market into October, but have lagged the last two months. The chart below shows performance for SPY, QQQ, IWM and the eleven sectors since November. QQQ, XLK and the Utilities SPDR (XLU) are down. The leaders are Healthcare SPDR (XLV), Materials SPDR (XLB) and Finance SPDR (XLF) with 5+ percent gains. Also notice that the Russell 2000 ETF (IWM) is positive (+1.48%) and QQQ is negative (-1.30%).
Materials SPDR Extends on Breakout
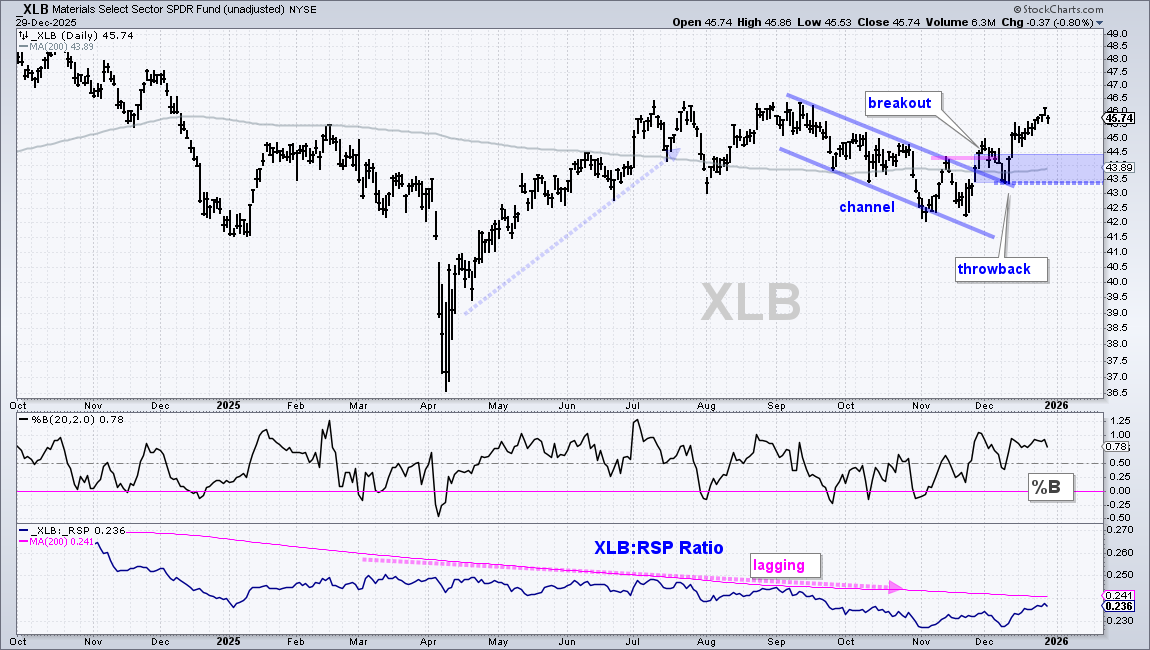
The Materials SPDR (XLB) surged with the broader market from early April to mid July and then stalled the last five months. XLB fell from September to November with a falling channel and broke out with a surge in late November. There was a short pullback (throwback) into early December and then a strong continuation higher the last three weeks. XLB has a breakout working with the breakout zone turning first support in the 43.5-44.5 area. A close below the early December low would call for a re-evaluation.
Utilities SPDR Still Setting Up
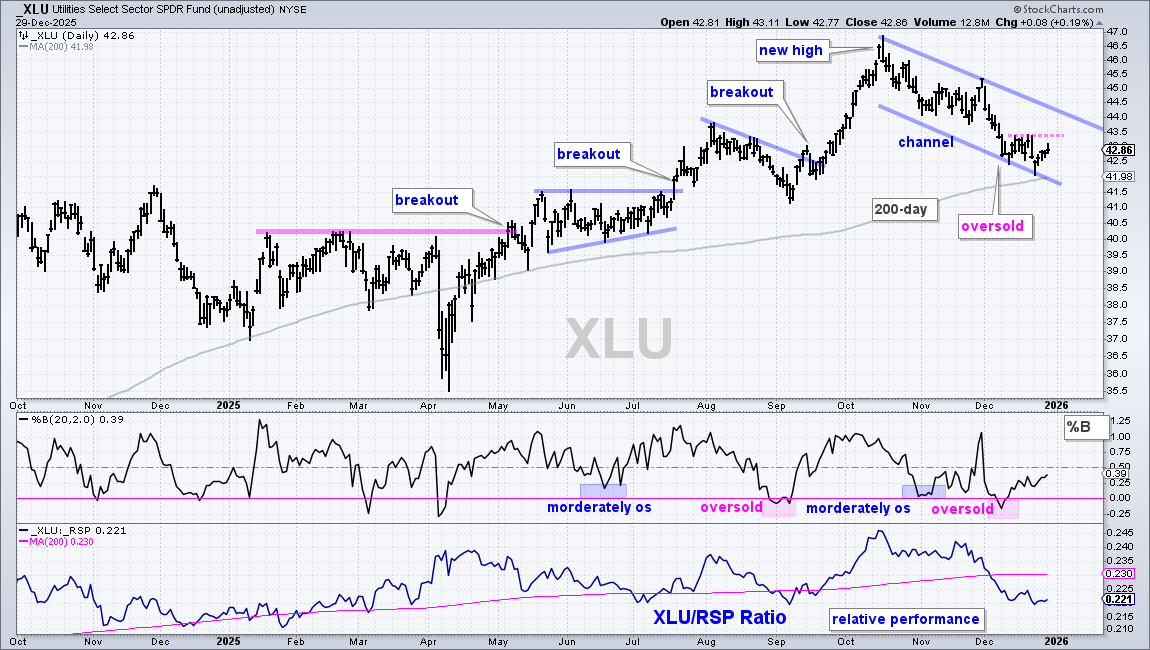
The Utilities SPDR (XLU) is correcting within a long-term uptrend. XLU hit a new high in mid October, fell into December and remains above its rising 200-day SMA. In fact, the ETF is testing this long-term moving average, which acts as a support zone. The middle window shows %B becoming oversold with a dip below zero on December 5th. This oversold reading did not mark the low as XLU continued lower into late December. We cannot expect every oversold reading to mark the exact low. Oversold conditions tell us to be on guard for a bounce and possible reversal. A falling channel formed on the price chart with the mid December highs marking first resistance. A breakout at 43.5 would show the first signs of increased buying pressure.
Updates on Flag Breakouts ARTY and SOXX
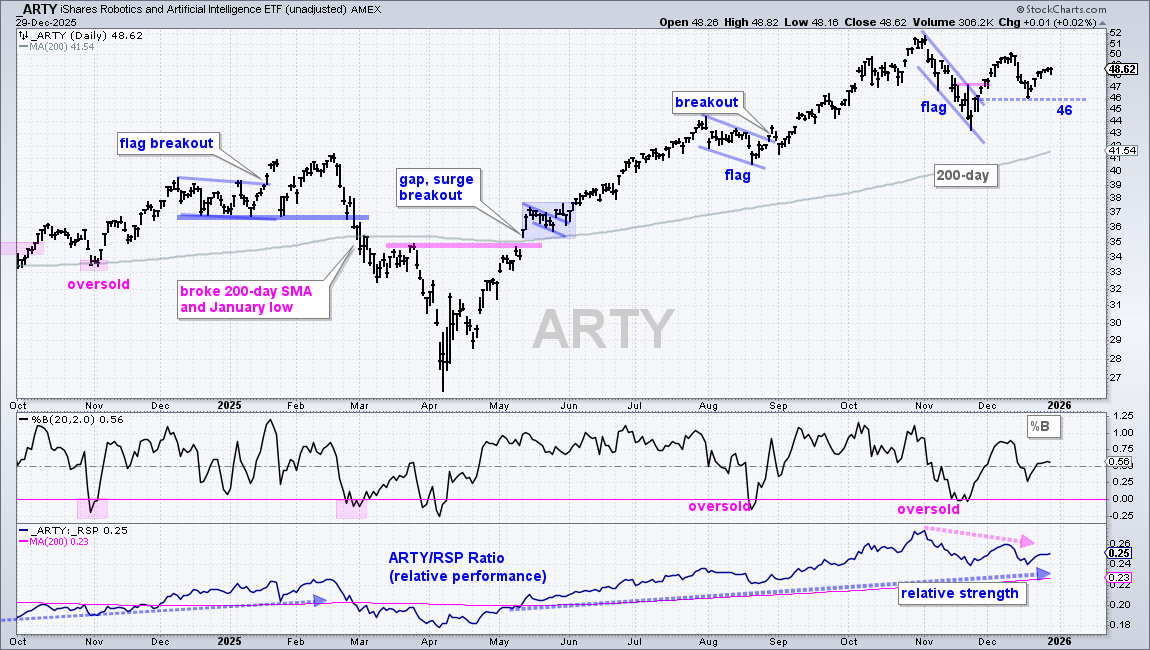
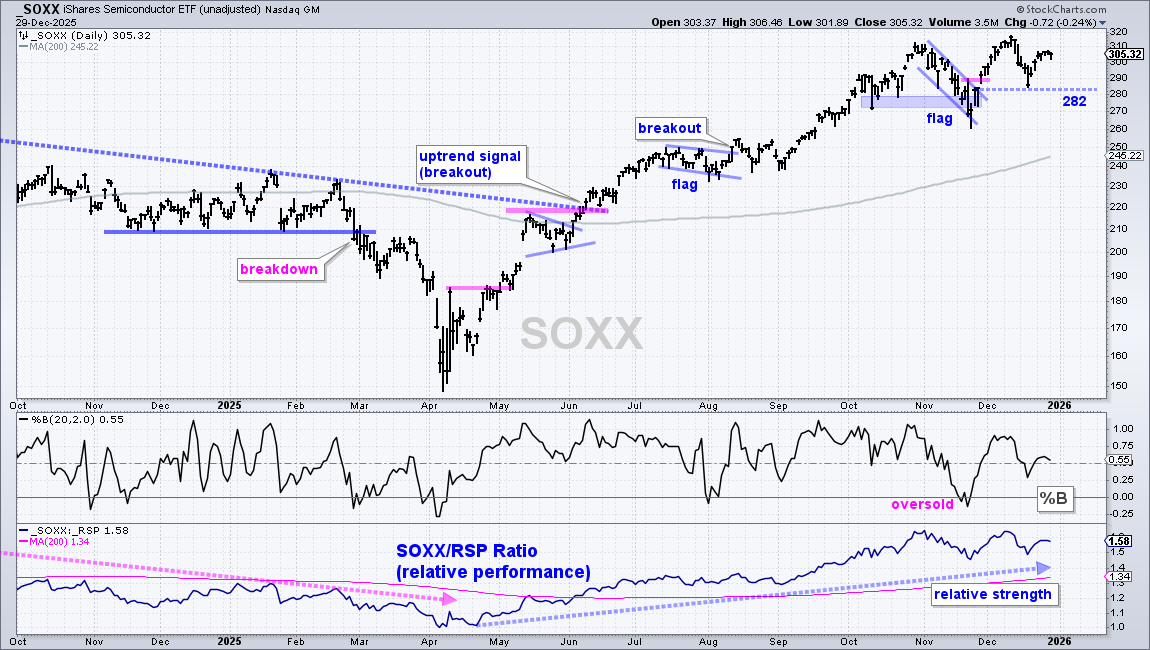
The chart below shows the Robotics AI ETF (ARTY) and the Semiconductor ETF (SOXX) are the strongest of the tech-related ETFs. They also have flag breakouts working. The first chart shows ARTY with a flag breakout and successful test of the breakout zone in mid December. The flag breakout is bullish until proven wrong with a close below 46.
The next chart shows SOXX with a flag breakout and re-evaluation level at 282.
10yr T-Yield Stalls at Resistance
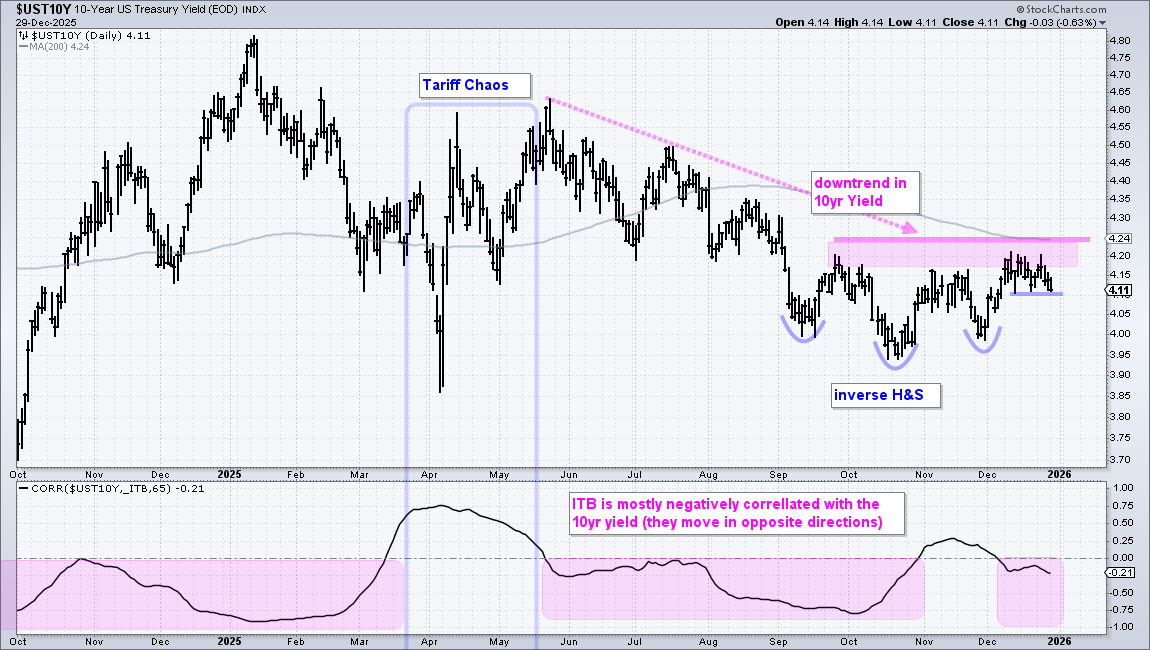
There is no change in the 10-yr Treasury Yield ($UST10Y) as it stalls at resistance. $UST10Y remains in a downtrend with resistance in the 4.10-4.25 percent area. The 10yr yield established resistance with highs from late September to December. There is also the falling 200-day SMA at 4.25%. Thus, a break above neckline resistance at 4.25% would confirm the head-and-shoulders and reverse the downtrend. It has yet to happen, but would be negative for housing and small-caps. A break below 4.10% would reverse the short-term upswing and affirm resistance.
Housing ETFs Hold Breakout Zones (barely)
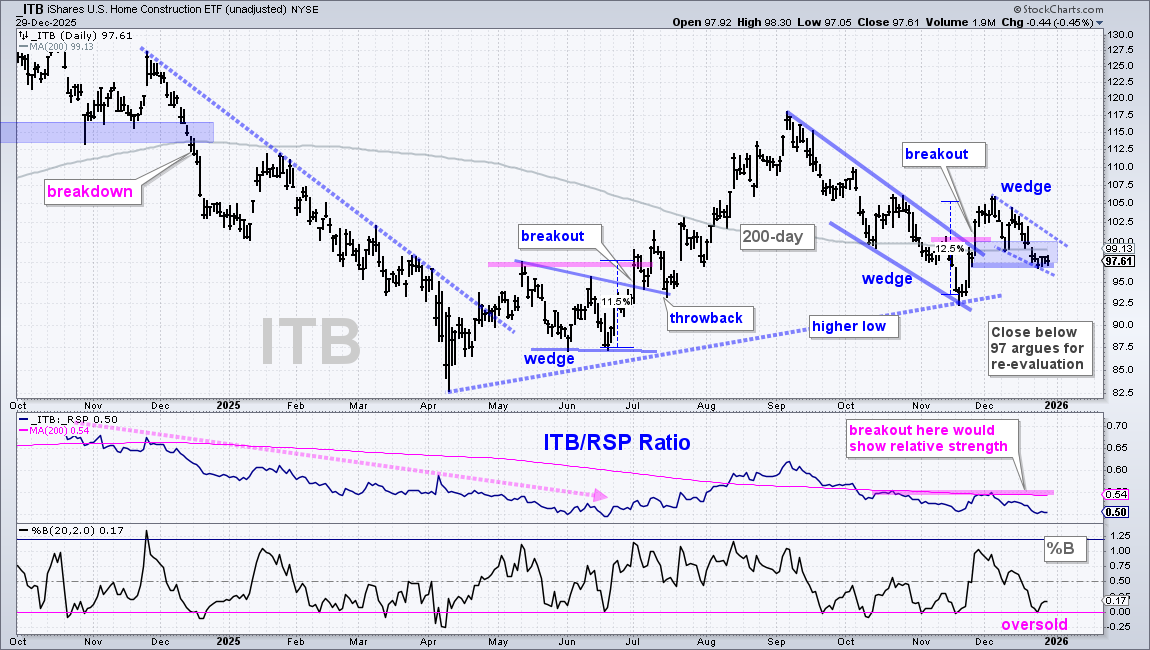
The Home Construction ETF (ITB) broke out in late November with a 12.5% surge. As with the June breakout, this 10+ percent surge shows strong buying pressure with a big move and pattern breakout. ITB became short-term overbought in the 105 area and fell back to the breakout zone with a small falling wedge into late December. My re-evaluation level remains at 97 with close below 97 negating the late November breakout. With the breakout still alive and %B touching zero last week, watch for a reversal in this area (blue shading). A break above the wedge line at 102.5 would revive the November breakout.
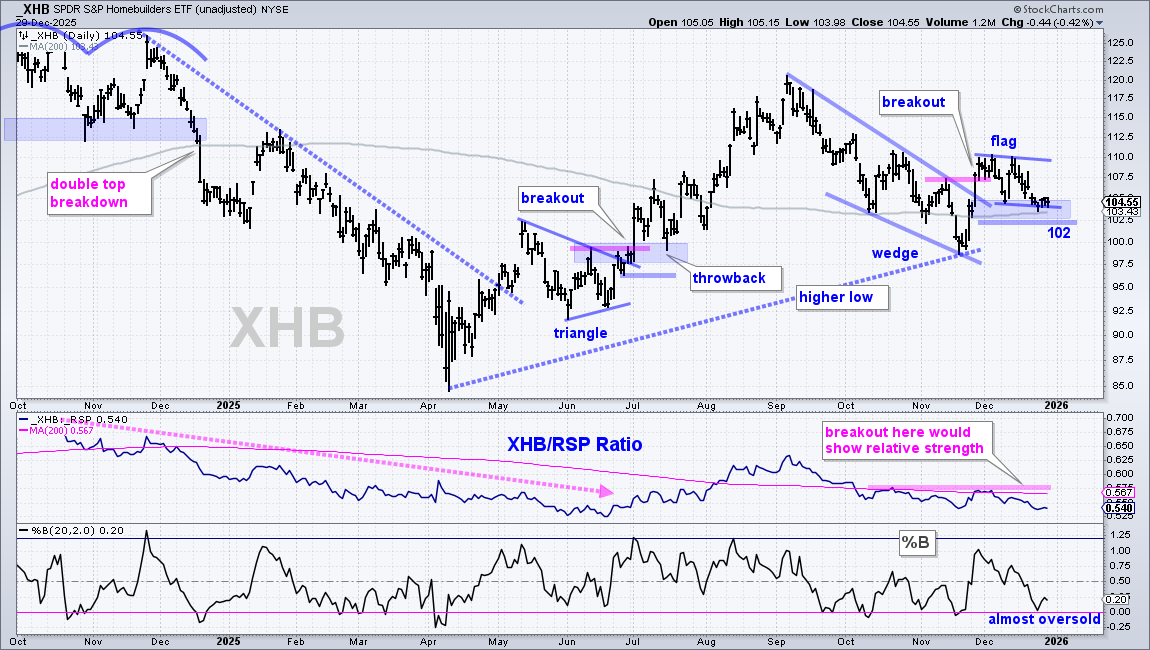
The next chart shows the Homebuilders ETF (XHB) with a surge and pattern breakout in late November. XHB became short-term overbought in the 110 area and fell back to the breakout zone. A flag is taking shape as XHB tests the breakout zone and %B became almost oversold. This is a bullish setup (oversold, breakout test, bullish pattern). A flag breakout at 110 would be bullish. Chartists can also watch for a surge from current levels, which would increase the odds for a flag breakout.
Gold Turns Volatile as Silver Goes Nuts
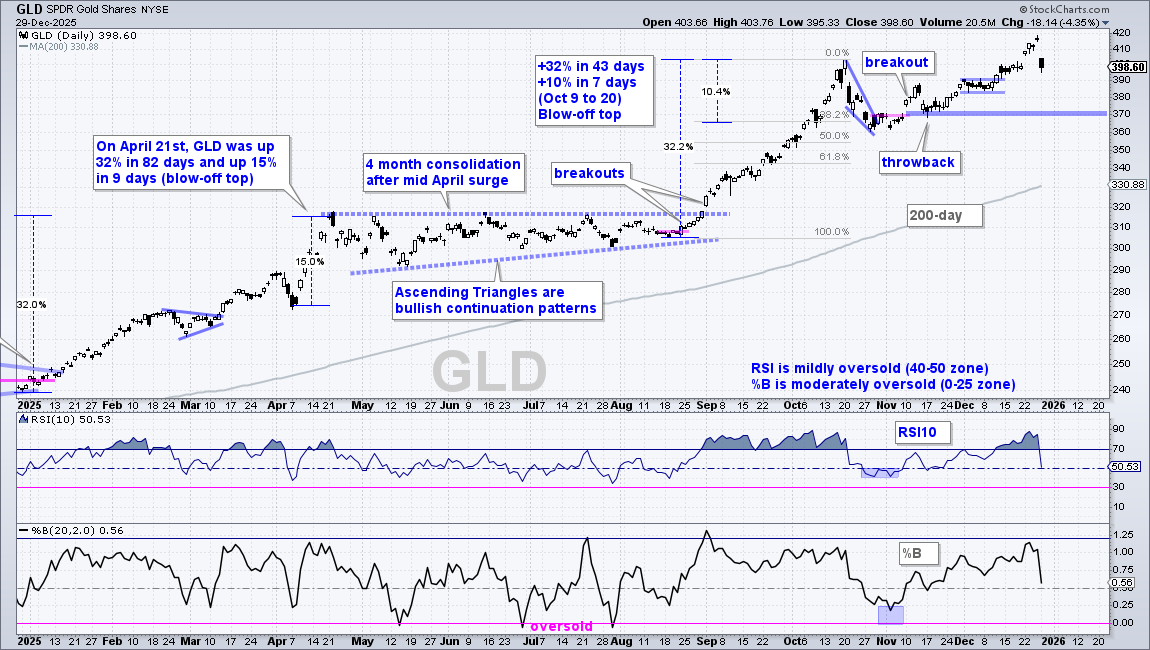
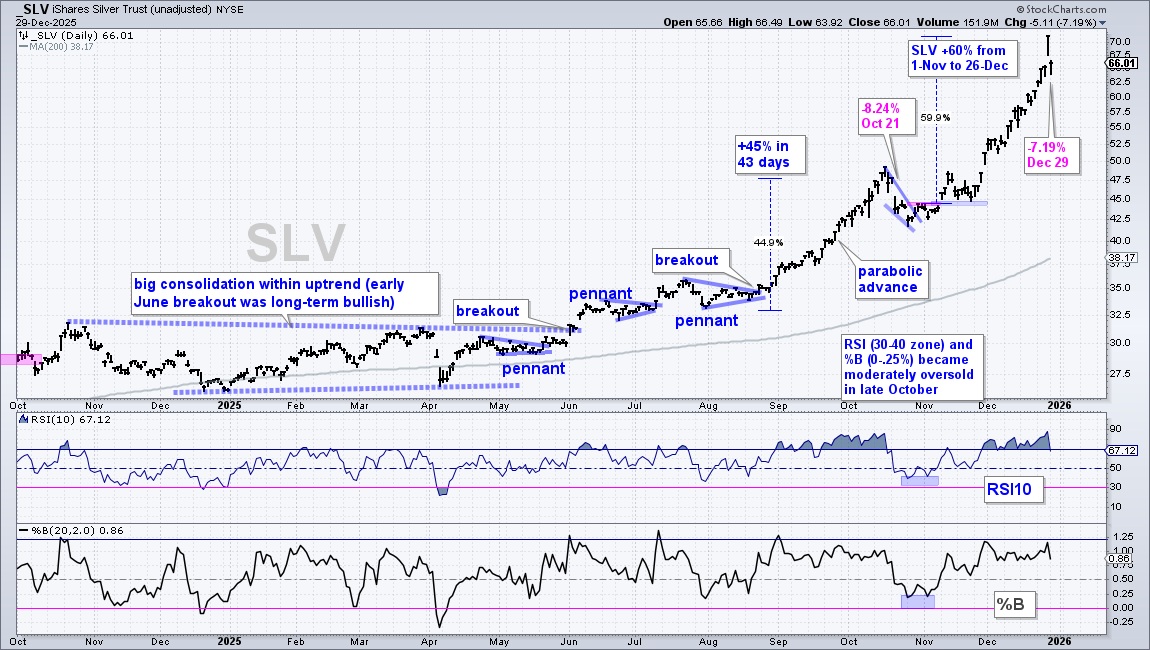
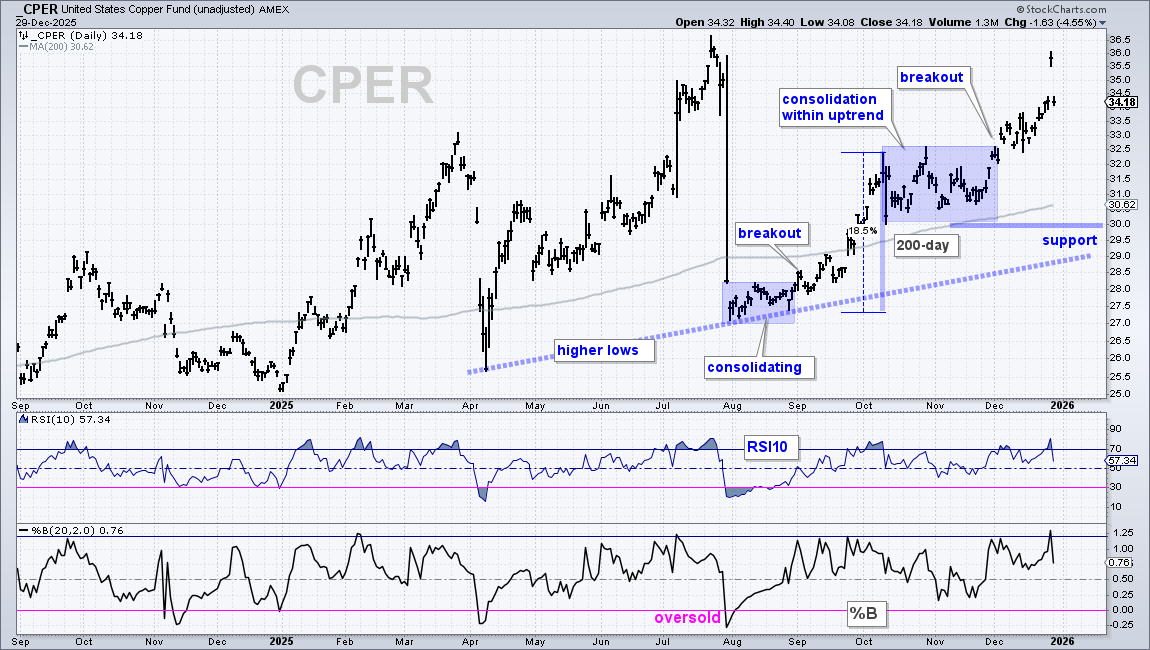
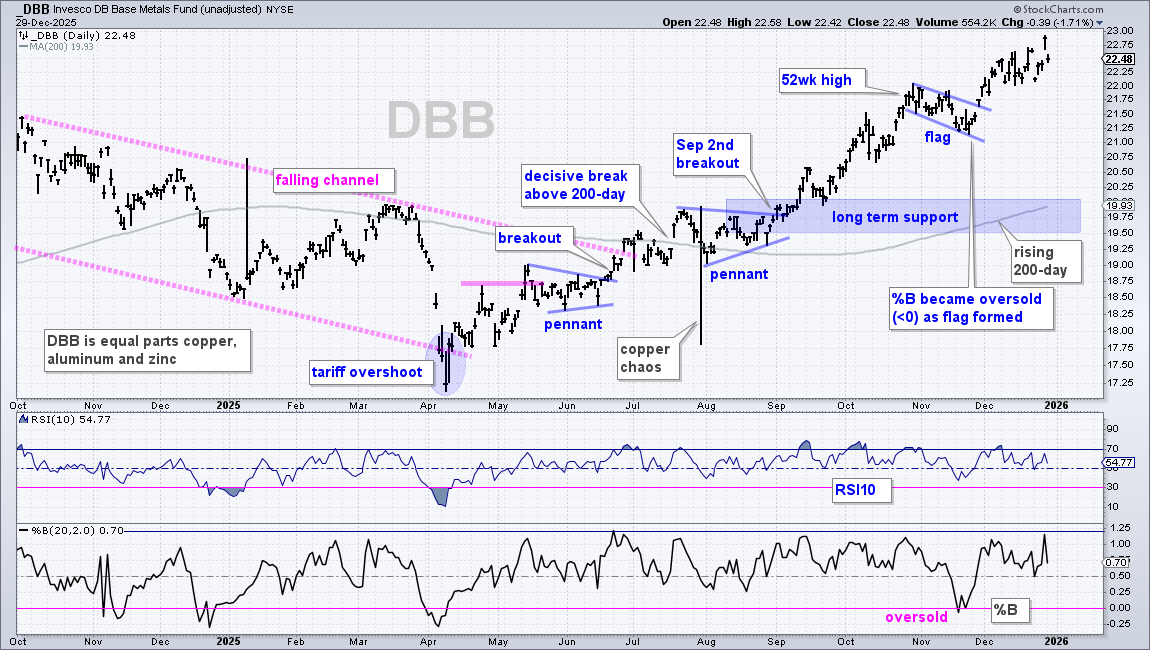
Precious metals and industrial metals surged into late December (December 26th) and then fell sharply on Monday, December 29th. Many of these moves are straight up and getting very frothy. It is impossible to pick the top within a parabolic advance. Chartists can, however, expect a wild ride because volatility is increasing as these advances accelerate. I will use gold and silver for analysis.
The first chart shows the Gold SPDR (GLD) with a sharp surge into mid-October and a sharp pullback into late October. GLD then broke out again in early November and extended to new highs in late December. GLD does not look parabolic on the chart, but it was short-term overbought near 420 and ripe for a rest. GLD fell 4.35% with a sharp decline on Monday. Notice that the mid October pullback/correction began with a sharp one-day decline.
I do not know how or when a pullback will unfold. However, I know GLD is in a leading uptrend with a fresh new high last week. I also know that there is no setup on this chart, such as a falling wedge/flag or oversold condition. Thus, GLD is simply in the trend-monitoring phase, which means I am monitoring price action for the next setup or signal.
The next chart shows the Silver ETF (SLV) with a 60% advance from November 1st to December 26th. This advance is straight up and getting very frothy. Heck, SLV was short-term overbought at 55, 60, 65 and 70. You get the idea. This advance remains parabolic in nature. There is no setup on the chart, just a leading uptrend that is getting out of hand. Volatility cuts both ways so don’t expect a calm and controlled pullback.
The next charts shows the DB Base Metals ETF (DBB) and Copper ETF (CPER) for reference.
Bitcoin Remains with Wedge Break
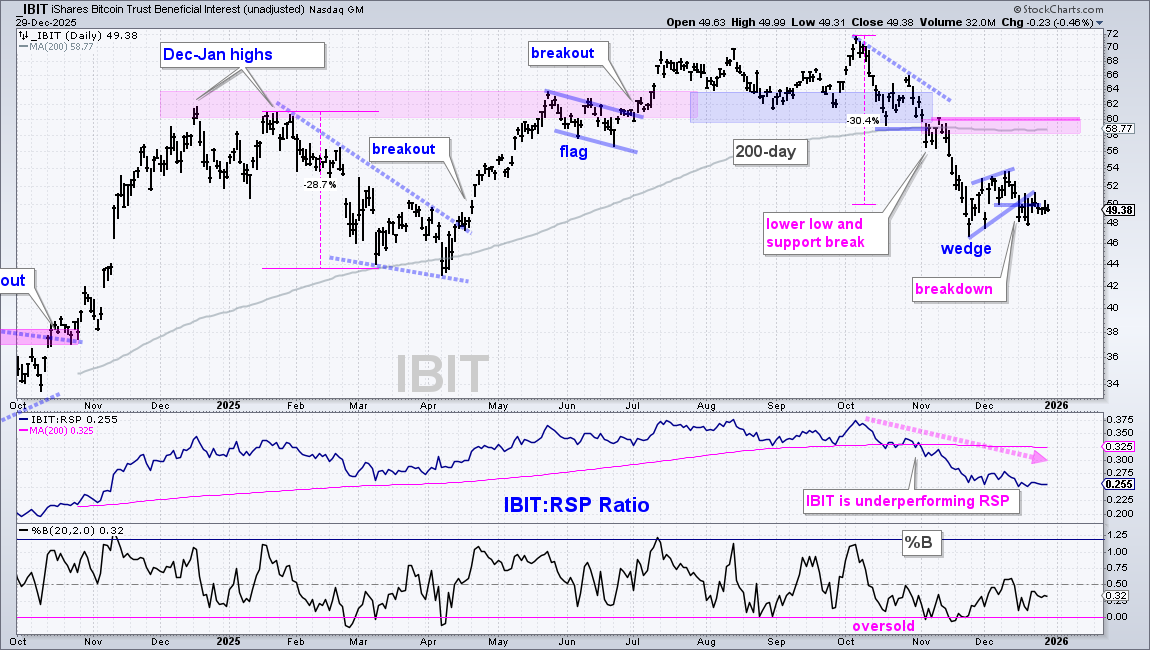
The Bitcoin ETF (IBIT) broke wedge support on December 15th and this signal remains in play. First and foremost, IBIT is in a long-term downtrend since the breakdown on November 4th. Broken support and the flat 200-day SMA mark resistance in the 58-60 area (pink shading). Second, IBIT is underperforming the S&P 500 EW ETF (RSP) with the price-relative (IBIT/RSP ratio) falling since October (middle window). After becoming oversold in late November, the ETF rebounded with a small rising wedge, which is a short-term bearish continuation pattern. IBIT broke wedge support on Monday, signaling a continuation of the downtrend.
DISCLAIMER: This content provided strictly for informational and educational purposes. It should not be interpreted as an offer to buy or sell any security, nor as a solicitation to engage in any investment activity. Nothing here constitutes a recommendation regarding any specific security, portfolio, transaction, or investment strategy.
At times, the author or affiliates may hold positions or interests in securities discussed. Any stocks or examples mentioned are not endorsements or suggestions to purchase. This material does not consider your individual financial goals or circumstances, and you should seek guidance from a qualified financial or investment adviser before making any trading or investment decisions.
Past performance does not guarantee future results.
Send feedback to support(at)trendinvestorpro.com or use the contact form.