

Headlines
- Viking Therapeutics Forms Triangle within Uptrend
- First Solar Consolidates after New High
- ON Semiconductor Forms High and Tight Flag
- AES Corp Consolidates above Rising 200-day SMA
- United Rentals Tests Rising 200-day SMA
I will update the Market Regime page later today.
Previous Reports Covering Stock Trends, Setups and Breakouts
December 10th: Amazon (AMZN), Arista (ANET), Johnson Controls (JCI), Tempus AI (TEM), AbbVie (ABBV)
December 3rd: Autodesk (ADSK), Quanta Power (PWR), Freeport McMoRan (FCX), Norfolk Southern (NSC), CSX Corp (CSX)
November 19th: Gen Digital (GEN), Qualcomm (QCOM) and Unity Software (U)
November 12th: Nucor (NUE), Danaher (DHR), Pfizer (PFE), Northrop Grumman (NOC), Norfolk Southern (NSC), AES Corp (AES)
November 5th: Consumer Staples SPDR (XLP), Costco (COST), CSX Corp (CSX), Heico (HEI), Entergy (ETR), Excel Energy (XEL)
Today’s report features charts from TradingView. SharpCharts from StockCharts are the cleanest and most visually appealing charts, but I am experimenting with three timeframes, which is not possible using SharpCharts. These TradingView charts show daily candlesticks in the top window with %B in the indicator window. In the lower left, there is a weekly chart for long-term perspective. The lower right shows a 78-minute chart for more granularity on the active setup.
Viking Therapeutics Forms Triangle within Uptrend
Viking Therapeutics (VKTX) is a clinical-stage biotech that develops therapies and medicines for metabolic and endocrine disorders (weight loss). Clinical-stage is the key phrase here. This is a biotech stock with above average volatility and risk!
The weekly chart on the bottom left shows the stock surging from 10 to 100 and then falling back to the 20s in 2025. VKTX firmed in the 20s from January to July, surged above 40 in mid August, experienced a 42% plunge on August 19th and then rebounded back to the early August highs. Expect a wild ride!
The top window shows the stock finding support in the 24 area in August-September and advancing above 40 by November. A triangle formed into December and I view this as a consolidation within an uptrend. Price is above the 200-day SMA and the 200-day SMA is turning up (gray line). A breakout at 40 would signal a continuation higher. A close below the December low would call for a re-evaluation.
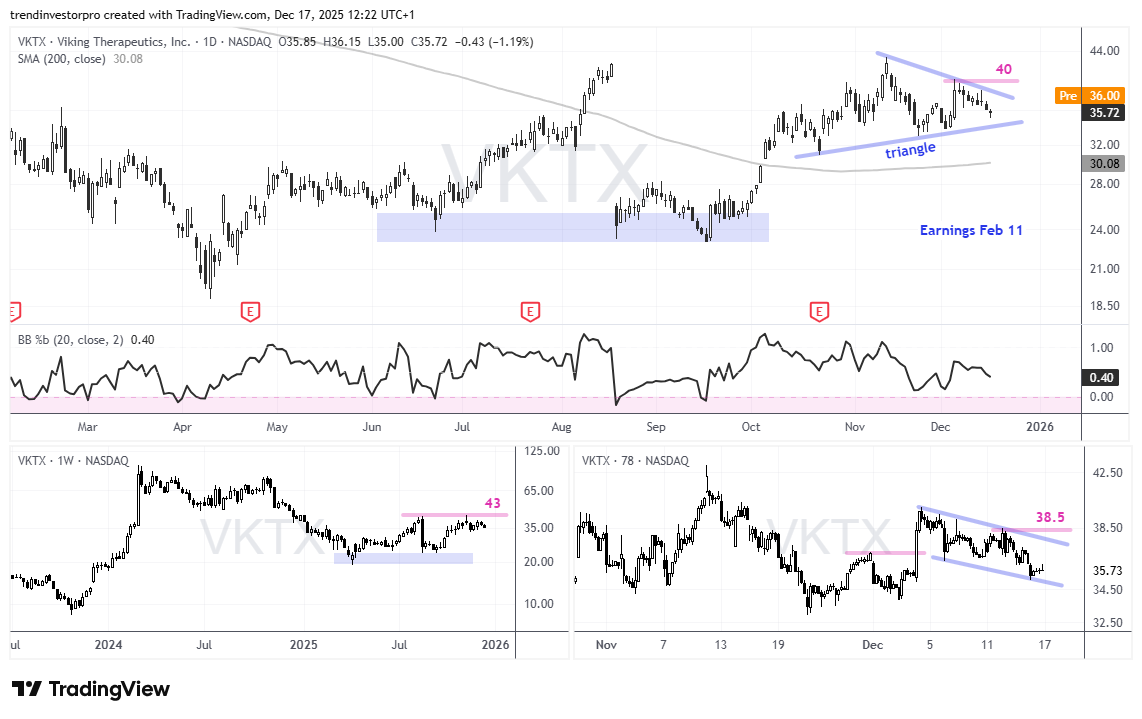
In the lower right, the 78-minute chart shows the stock breaking short-term resistance with a surge in early December. VKTX then corrected with a falling channel the last two weeks. Resistance is set at 38.5 and a breakout here would be short-term bullish. This would increase the odds for a bigger breakout at 40.
First Solar Consolidates after New High
First Solar (FSLR) develops and manufactures modules for the solar industry. It is part of the Solar Energy ETF (TAN) and Global Clean Energy ETF (ICLN).
The top window shows the stock in a long-term uptrend with 52-week highs in November. In the lower left window, we can see that FLSR is still below its 2024 high in the 300 area. Nevertheless, the long-term trend is up with price above the rising 200-day SMA.
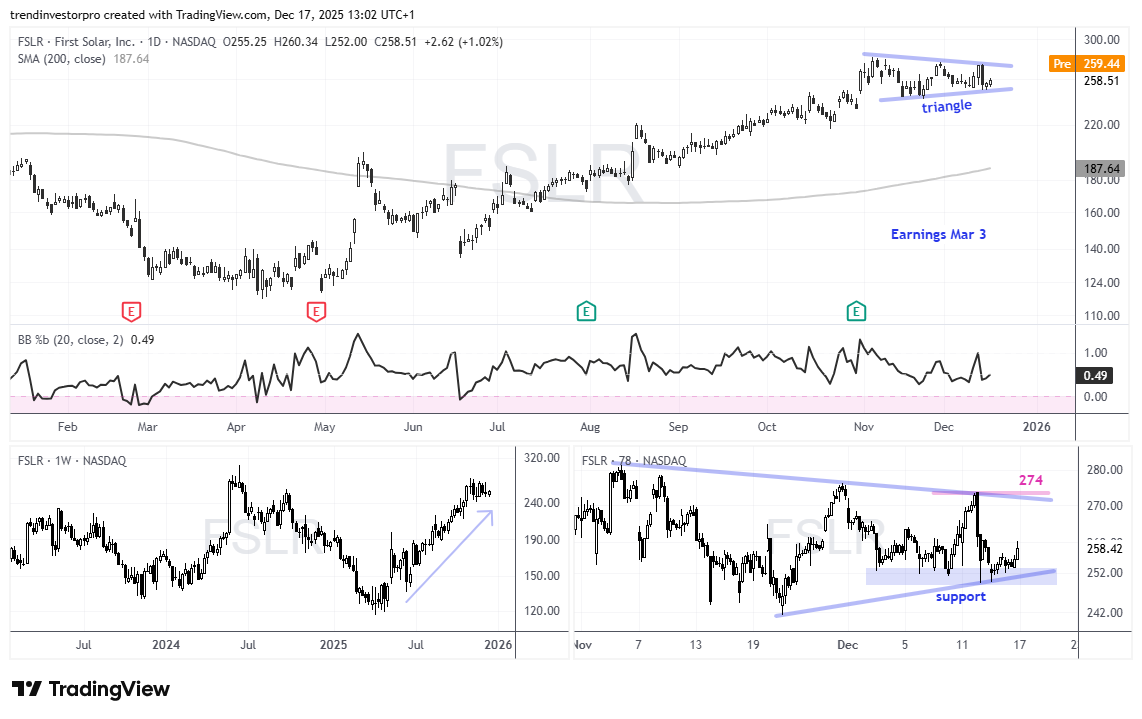
After hitting new highs, the stock consolidated with a triangle into December. I view this as a consolidation within an uptrend, which makes it a bullish continuation pattern. A breakout at 274 would signal a continuation higher and open the door to new highs. A close below the December lows would call for a re-evaluation.
ON Semiconductor Forms High and Tight Flag
ON Semiconductor (ON) is part of the Technology SPDR (XLK), Semiconductor ETF (SMH) and Semiconductor ETF (SOXX). The company specializes in intelligent power and sensing solutions for automotive and industrial markets. (self-driving cars and robotics).
The top window shows the daily chart with ON breaking out of a large falling wedge. The stock surged from 32 in April to 65 in July and then corrected into November. This decline retraced 50 to 67 percent of the prior advance (one half to two thirds). ON then broke the wedge line with a strong surge into early December. Overall, I view the falling wedge as a correction after the April-July advance. The breakout signals an end to the correction and a resumption higher.
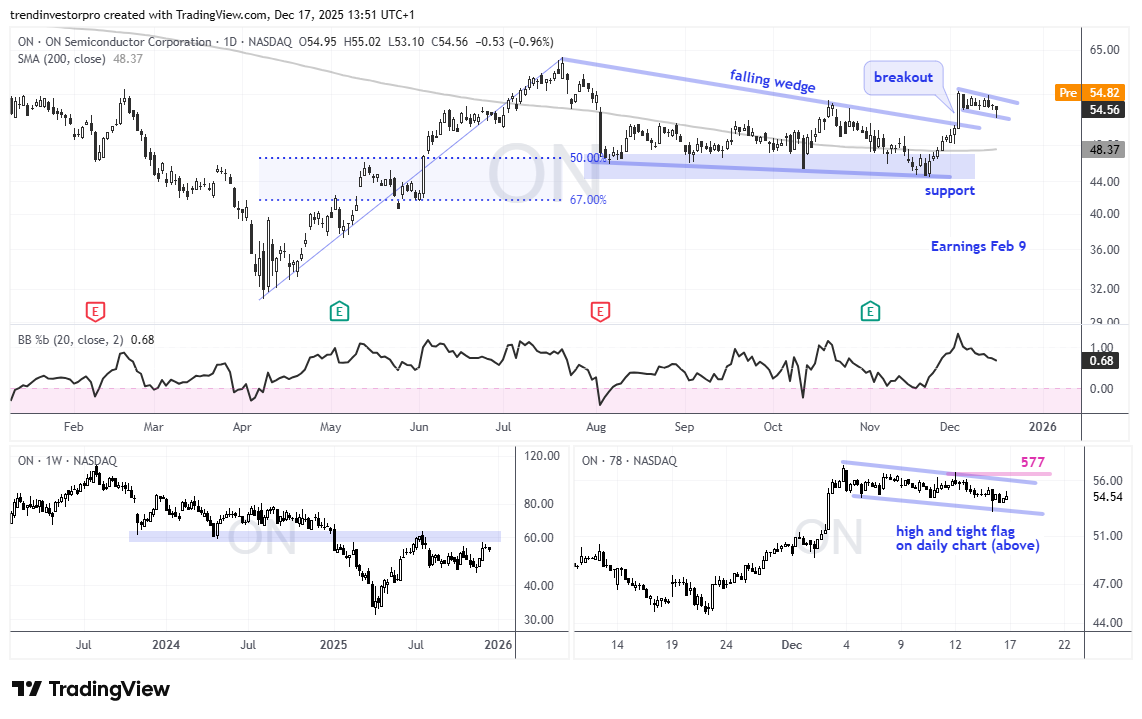
Short-term, the stock fell back with a tight flag the last two weeks. The 78-minute chart shows this flag in detail with short-term resistance at 577. A breakout here would signal a continuation higher. For re-evaluation levels, I would turn to the 200-day SMA, which is starting to turn up. A close below this key moving average would negate the wedge breakout on the daily chart.
AES Corp Consolidates above Rising 200-day SMA
AES Corp (AES) is part of the Utilities SPDR (XLU) and the Kensho Clean Energy ETF (CNRG). The company provides power and services through its solar, wind, storage and natural gas facilities.
The weekly chart in the lower left shows the stock basing in the first half of 2025 and breaking resistance in July. The breakout zone turns into support in the 13 area. This breakout is holding as the stock consolidates just above the breakout zone. A close below 12.3 would negate the long-term breakout.
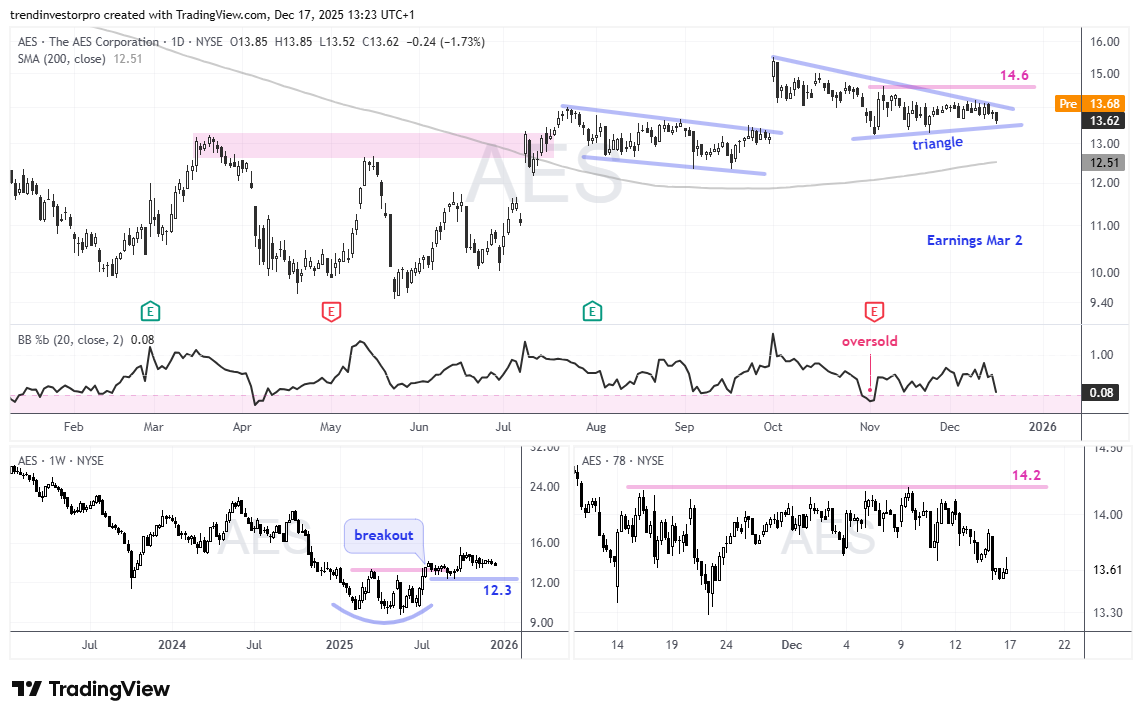
On the daily chart, the stock surged at the beginning of October with a gap and close above 15. AES then corrected with a narrowing trading range into December. A triangle is taking shape with resistance at 14.60. A breakout here would signal a continuation higher and open the door to new 52-week highs.
The 78-minute chart shows a clear resistance level at 14.20. This resistance level extends back to November 17th. A breakout here would increase the chances for a bigger breakout at 14.60. A close below the November lows would argue for a re-evaluation.
United Rentals Tests Rising 200-day SMA
United Rentals (URI) rents construction and industrial equipment. The stock is part of the Industrials SPDR (XLI) and the Infrastructure ETF (IFRA).
The weekly chart (lower left) shows URI within a rising channel. This is the Parallel Channel drawing tool on TradingView. The long-term trend is up because this channel is rising. URI is also trading in the middle (dashed line).
On the daily chart, URI advanced from 535 to 1000 and recorded 52-week highs from August to October. The stock then corrected in October-November with a decline back to the rising 200-day SMA. This decline also retraced around 50% of the prior advance. This is normal price action for a correction within a bigger uptrend (50% retracement and return to the 200-day).
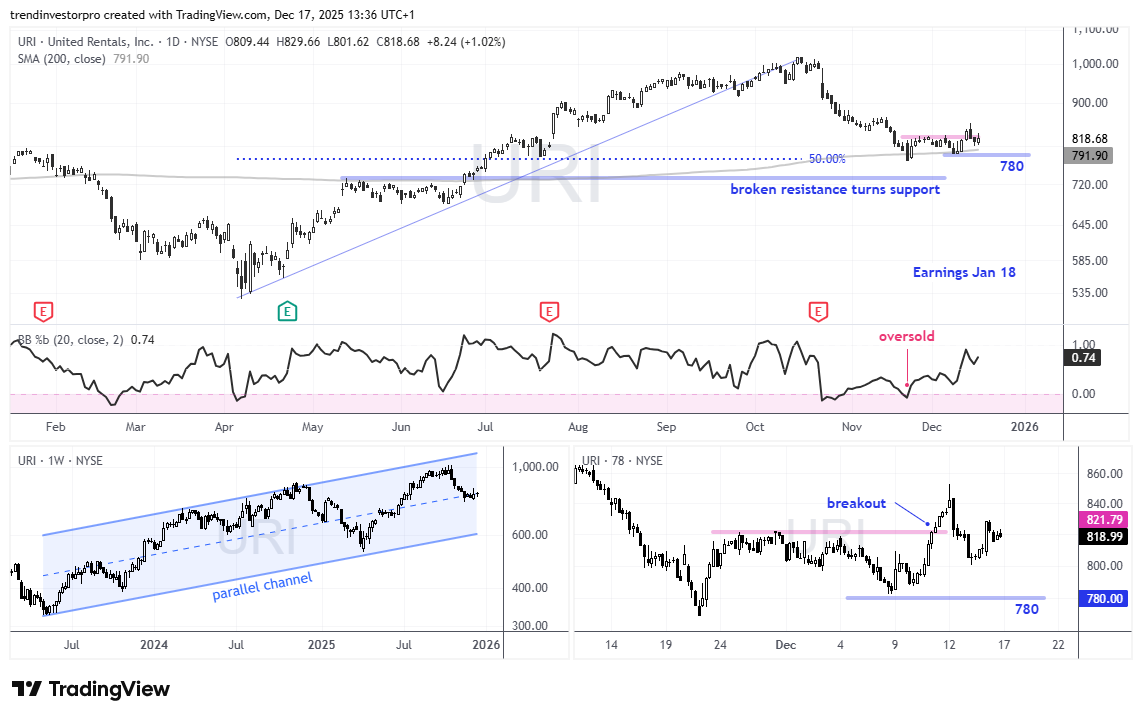
URI firmed the last few weeks and even broke short-term resistance with a surge last week. This is the first sign that the correction is ending and the uptrend is resuming. A close below the December lows would call for a re-evaluation.
DISCLAIMER: This content provided strictly for informational and educational purposes. It should not be interpreted as an offer to buy or sell any security, nor as a solicitation to engage in any investment activity. Nothing here constitutes a recommendation regarding any specific security, portfolio, transaction, or investment strategy.
At times, the author or affiliates may hold positions or interests in securities discussed. Any stocks or examples mentioned are not endorsements or suggestions to purchase. This material does not consider your individual financial goals or circumstances, and you should seek guidance from a qualified financial or investment adviser before making any trading or investment decisions.
Past performance does not guarantee future results.
Send feedback to support(at)trendinvestorpro.com or use the contact form.