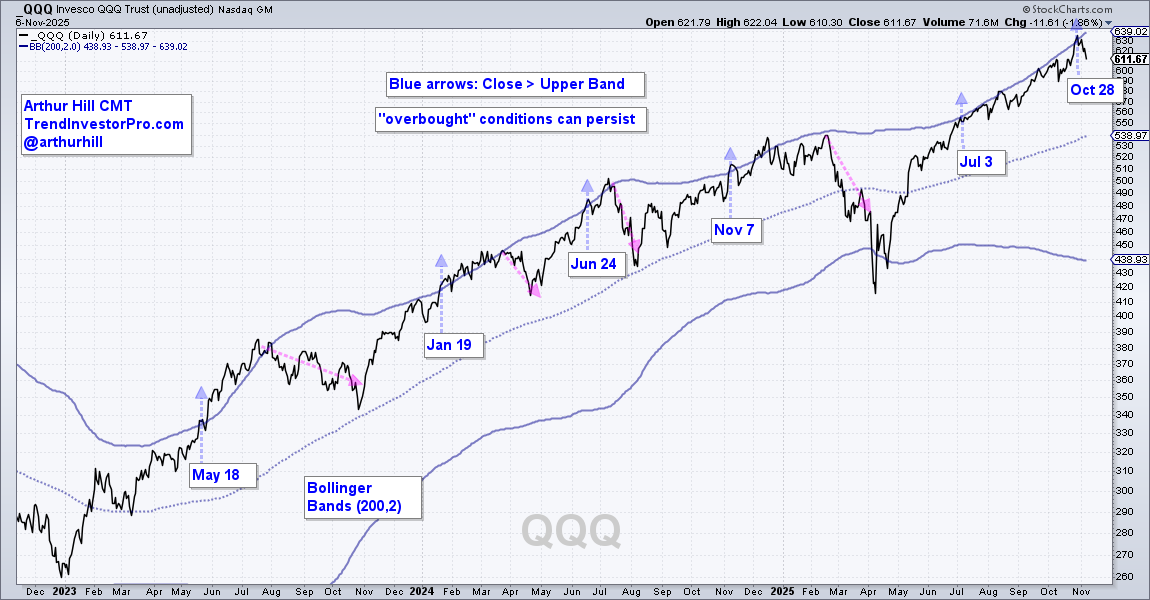
Stocks and ETFs can become overbought and remain overbought during strong uptrends. We see this play out in QQQ as it moved above the upper Bollinger Band (200,2) several times and continued higher. Bollinger Bands (200,2) are two standard deviations above/below the 200-day SMA moving average. The blue arrows show when QQQ initially crossed above the upper Bollinger Band, which means the close is more than two standard deviations above the 200-day SMA.
Typically, QQQ extends higher after the initial cross and does not pull back or correct until 1-4 months later (pink arrows). The current run is exceptional because QQQ crossed the upper Bollinger Band on July 3rd and extended higher the last four months. Clearly, this advance is getting long in tooth and ripe for a correction. But when?
From Overbought to a Momentum Shift
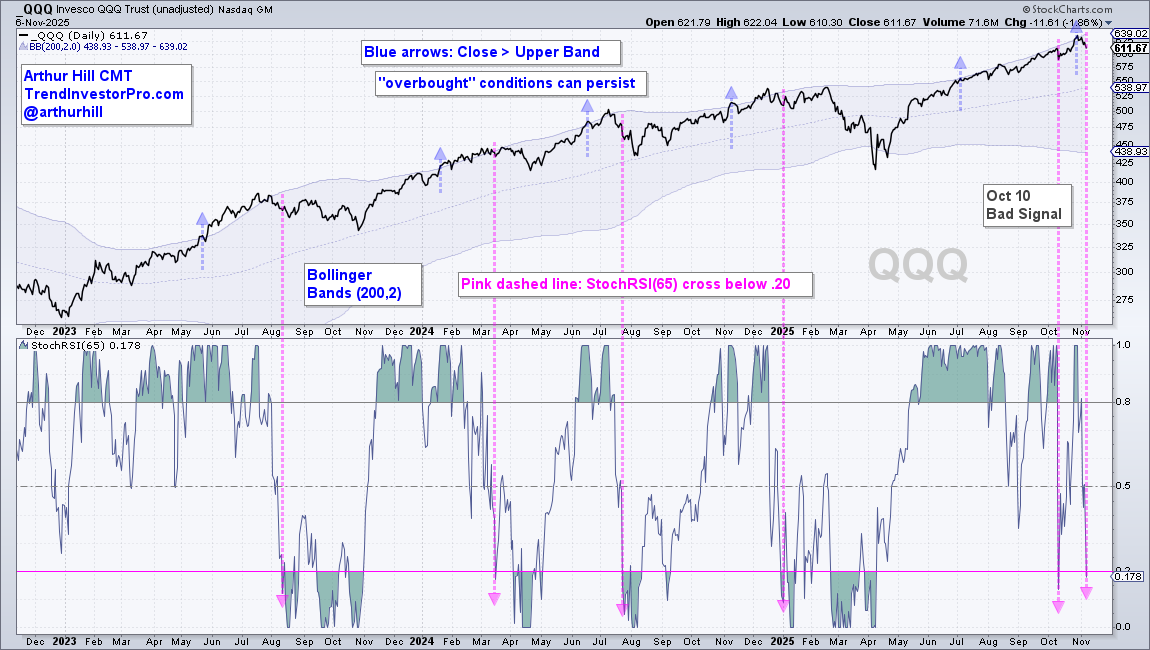
Because overbought conditions can persist, chartists need an indicator to signal a momentum shift to the downside. Such a shift can foreshadow a pullback or even an extended correction, such as those in August-October 2023 and January to March 2025.
I propose StochRSI(65) to identify momentum shifts. This indicator is the Stochastic Oscillator applied to RSI, which makes it a momentum indicator applied to a momentum indicator. It measures the momentum of RSI. Tushar Chande and Stanley Kroll developed this indicator because they wanted more signals and sensitivity from RSI.
StochRSI fluctuates between 0 and 1. A surge from below .20 to above .80 signals a bullish momentum shift, while a plunge from above .80 to below .20 signals a bearish momentum shift. I am using 65 days to capture medium-term shifts.
The chart above shows QQQ with StochRSI(65) in the lower window. The pink lines mark a bearish momentum shift after becoming overbought. These shifts foreshadowed corrections in August-October 2023 and February-March 2025, as well as shorter pullbacks in mid March 2024 and late July 2024. The signal on October 10th did not work because StochRSI surged above .80, which negates a signal. Nevertheless, another bearish momentum signal triggered this week with a move below .20. This puts QQQ in correction/pullback mode.
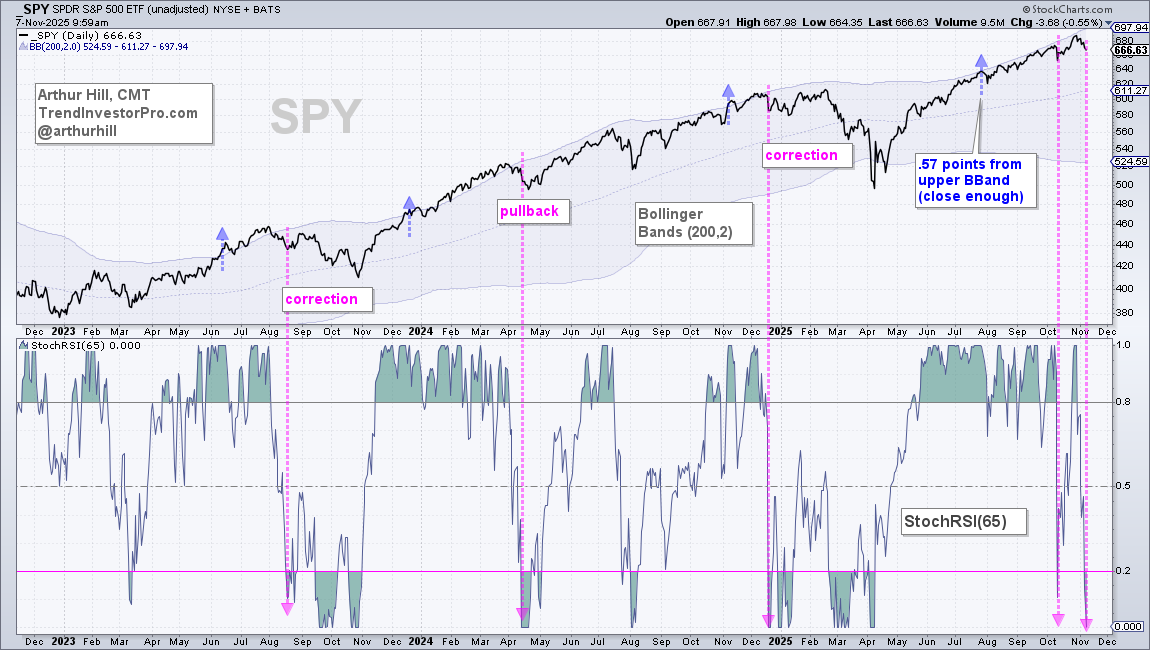
The next chart shows SPY with similar characteristics. StochRSI(65) moved from above .80 to below .20 twice within the last few weeks. This shows two bearish momentum shifts that could lead to a correction or pullback.
Note that all corrections begin as pullbacks and all bear markets begin as corrections. Not all pullbacks lead to corrections and not all corrections turn into bear markets. The call right now is for a pullback that could evolve into a correction. Pullbacks last a few weeks, while corrections last a few months.
DISCLAIMER: This content provided strictly for informational and educational purposes. It should not be interpreted as an offer to buy or sell any security, nor as a solicitation to engage in any investment activity. Nothing here constitutes a recommendation regarding any specific security, portfolio, transaction, or investment strategy.
At times, the author or affiliates may hold positions or interests in securities discussed. Any stocks or examples mentioned are not endorsements or suggestions to purchase. This material does not consider your individual financial goals or circumstances, and you should seek guidance from a qualified financial or investment adviser before making any trading or investment decisions.
Past performance does not guarantee future results.
Send feedback to support(at)trendinvestorpro.com or use the contact form.