Systematic Strategies and Next Level Technical Analysis
Some Warning Signs, but Tech ETFs Still Leading – As are Utes, Industrials, Healthcare
Arthur Hill, CMT
Archive
Equity ETFs
Use CRTL+P to Print
Headlines
Weight of the Evidence Remains Bullish
Some Warning Signs
Fielder’s Choice
SPY and QQQ Hold September-October Lows
Four Leading Sectors (XLK, XLI, XLV, XLU)
Leading Tech ETFs (MAGS, AIQ, ARTY, SKYY, CIBR, SMH, SOXX)
Aerospace & Defense ETF Tests October Lows
Infrastructure ETF Tests Top of Support Zone
Weight of the Evidence Remains Bullish
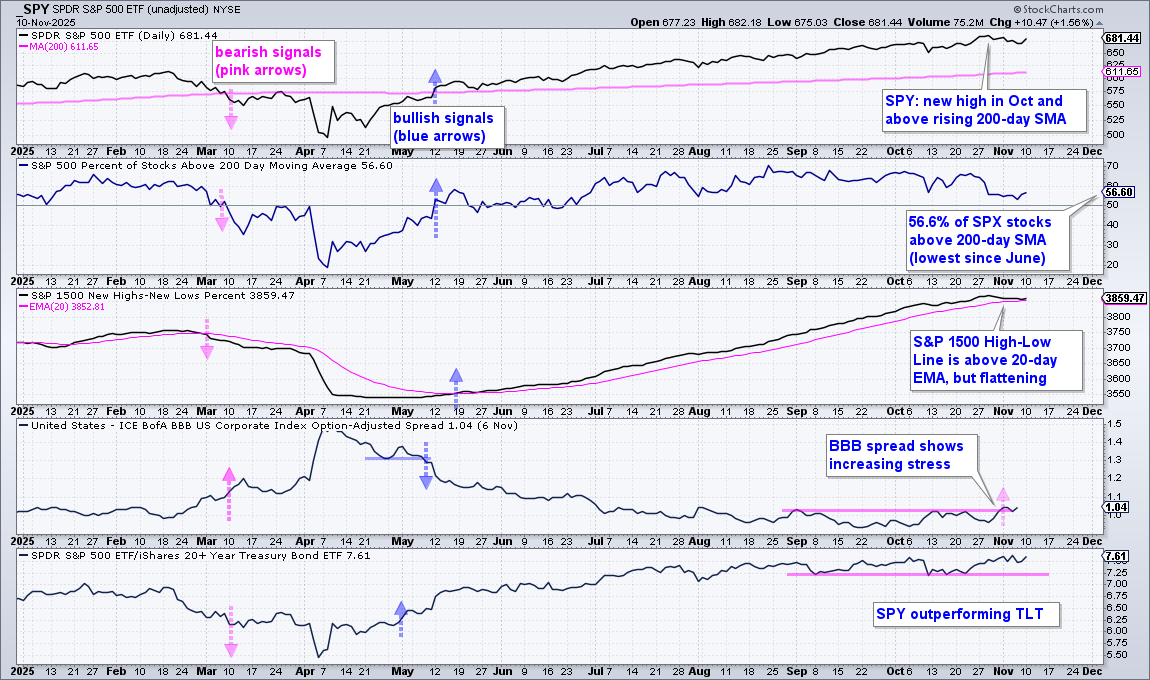
The weight of the evidence remains bullish for stocks, but there are large pockets of weakness within the market. 56.6% of S&P 500 stocks are above their 200-day SMAs, which means 43.4% are below and in long-term downtrends. Even though this is a rather large swath of the market, the cup is half full as long as this indicator is above 50%. The middle window shows the S&P 1500 High-Low Line turning up in mid May and holding above its 20-day EMA. New highs are still outpacing new lows. This line flattened over the last two weeks and a downturn would show an increase in new lows, which would be negative for stocks.
The BBB yield spread narrowed (fell) from early April to late September and then edged higher since early October. This key spread exceeded its early September high (pink line), which means stress is increasing in the credit markets. This is negative for stocks. And finally, the bottom window shows the SPY:TLT ratio turning up in early May and remaining strong into early November. This means stocks are outperforming bonds. Risk assets are outperforming safe haven assets. The September-October lows mark support. A break would show stocks underperforming bonds and be negative for stocks.
Some Warning Signs
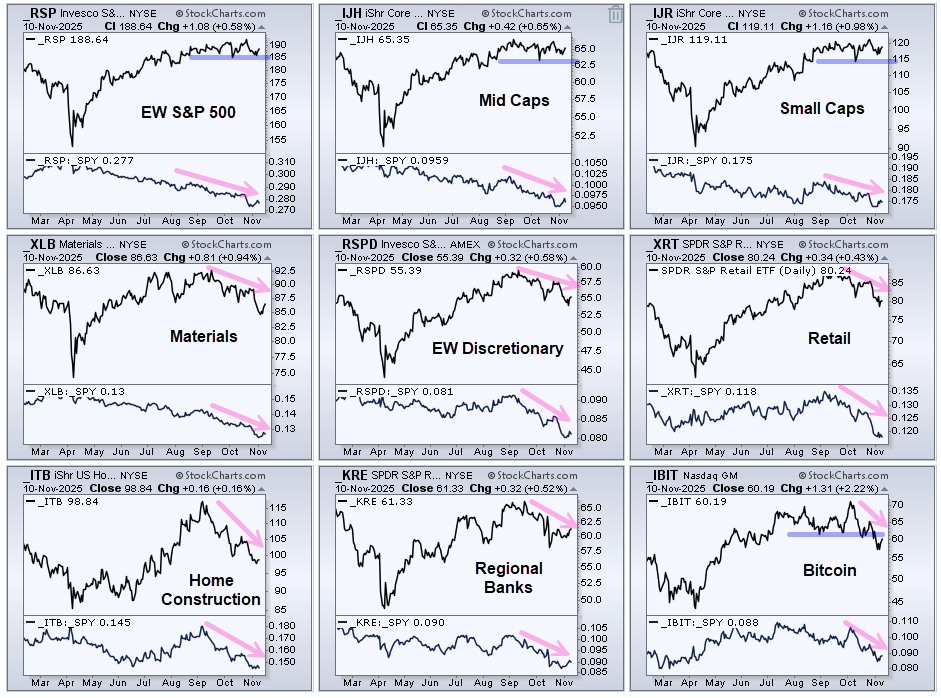
Even though the weight of the evidence still favors the bulls, there are some warning signs out there. On the image below, the top three charts show the S&P 500 EW ETF (RSP), S&P MidCap 400 ETF (IJH) and S&P SmallCap 600 SPDR (IJR) seriously underperforming the S&P 500 SPDR (pink arrows). Nevertheless, these three have yet to break their support levels (blue lines). Support breaks would forge lower lows and reverse their uptrends.
The middle row shows the Materials SPDR (XLB), EW Consumer Discretionary ETF (RSPD) and Retail SPDR (XRT) moving lower the last two months (pink lines). Their price-relatives hit 52-week lows recently (long-term relative weakness). On the bottom row, the Home Construction ETF (ITB) and Regional Bank ETF (KRE) were hit hard and their price-relatives also hit new lows (KRE:SPY ratio). In the bottom right corner, the Bitcoin ETF (IBIT) broke its August-September lows. Relative to SPY, IBIT has been underperforming since August as its price-relative (IBIT:SPY ratio) hit multi-month lows. Bitcoin represents the speculative end of the market.
Fielder's Choice
We have a choice. We can focus on what’s not working and worry. Alternatively, we can focus on what’s working and stay in the game. I think it is important to stay in the game until the weight of the evidence turns bearish. Right now, the weight of the evidence is still net bullish. This means I am focusing on what’s working, such as ETFs in leading uptrends.
SPY and QQQ Hold September-October Lows
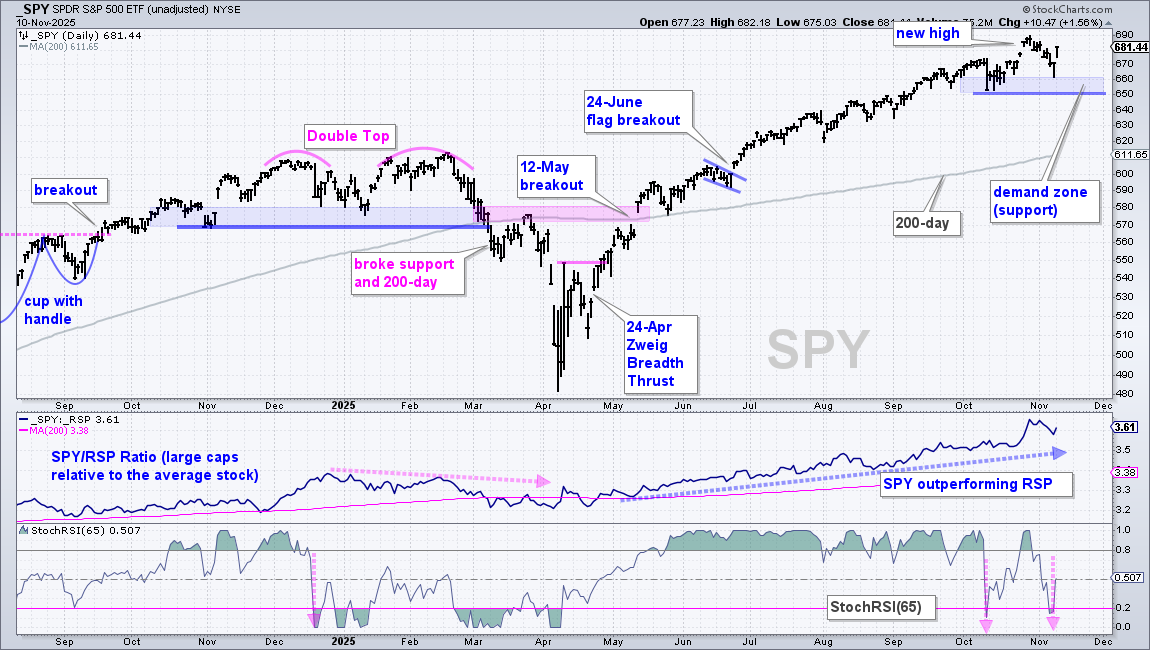
As noted on Friday, SPY and QQQ triggered bearish momentum signals as StochRSI (65) moved from above .80 to below .20 (link here). This could foreshadow the start of a pullback or correction, but we do not know how long it might last and how far prices might fall. A StochRSI(65) cross back above .80 would negate this signal.
On the SPY chart below, the trend is clearly up with a series of higher highs and higher lows since the late April. Each higher high indicates that buyers are confident enough to buy at higher price levels. Each higher low means buyers are eager to step in before prices reach prior demand points. The trend reverses when demand falters and this higher-high higher-low sequence derails.
Chartists should watch the October-November lows because they mark important demand zones. The chart below shows SPY with bounces off the 650 level in mid October and the 660 level with the intraday low last week. These bounces show where demand appeared and buying pressure increased. Taken together, there is a support zone in the 650-660 area. A move below 650 would break support and show an increase in selling pressure. The call would then be for a correction.
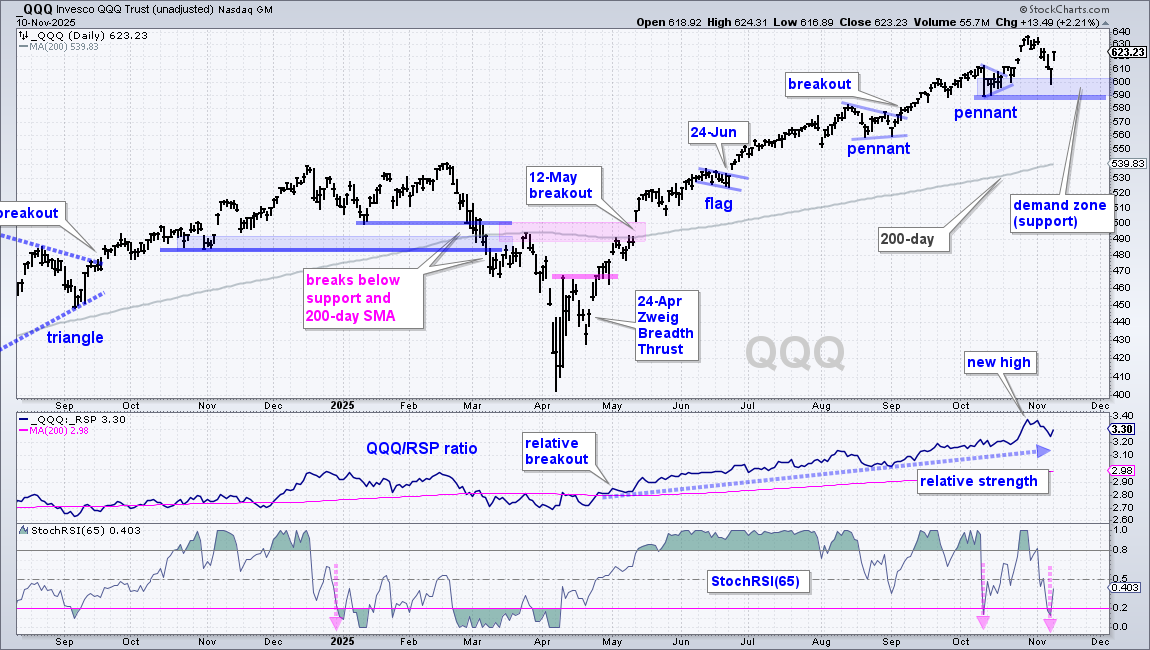
The next chart shows QQQ with a bounce off the 590 level in mid October and an intraday bounce off the 600 level last Friday. The bulls are still in control of this trend because the higher highs and higher lows persist. A break below 590 would show an increase in selling pressure and argue for a correction.
Four Leading Sectors (XLK, XLI, XLV, XLU)
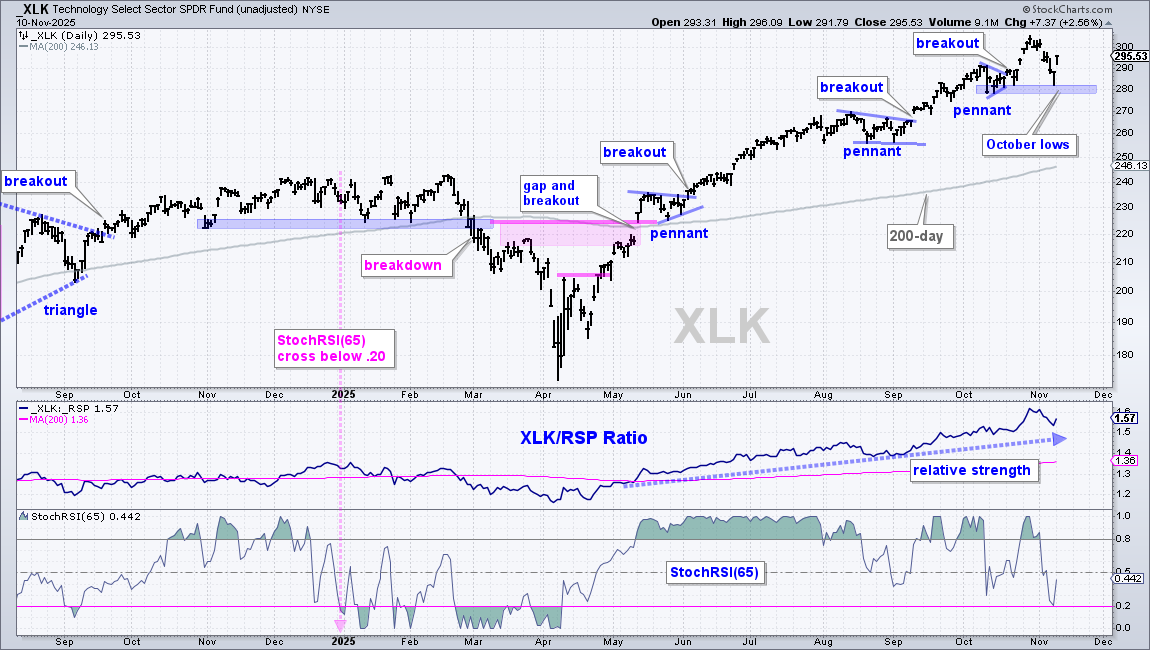
The Technology SPDR (XLK) is the leading sector with a new high in late October. As with SPY and QQQ, XLK established a demand zone (support) in the 280 area with a bounce in mid October and an intraday low on Friday. A close below 278 would break support and argue for a correction. The bottom window shows StochRSI(65) remaining in bull mode because it has yet to cross below .20 (pink line).
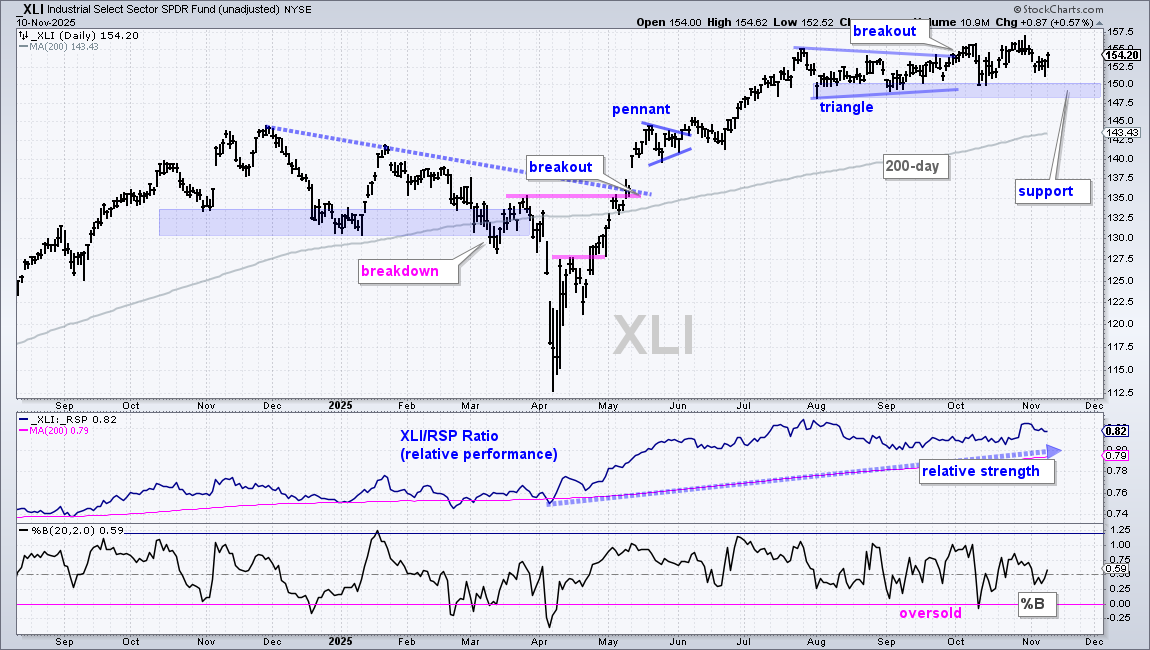
Even though the Industrials SPDR (XLI) has gone nowhere since late July, it recorded new highs in early and late October. Thus, there is more uptrend than downtrend on this chart. Names hitting new highs in October are clearly in uptrends of some sort. The lows from August to September mark support in the 148-150 area. A break here would be negative.
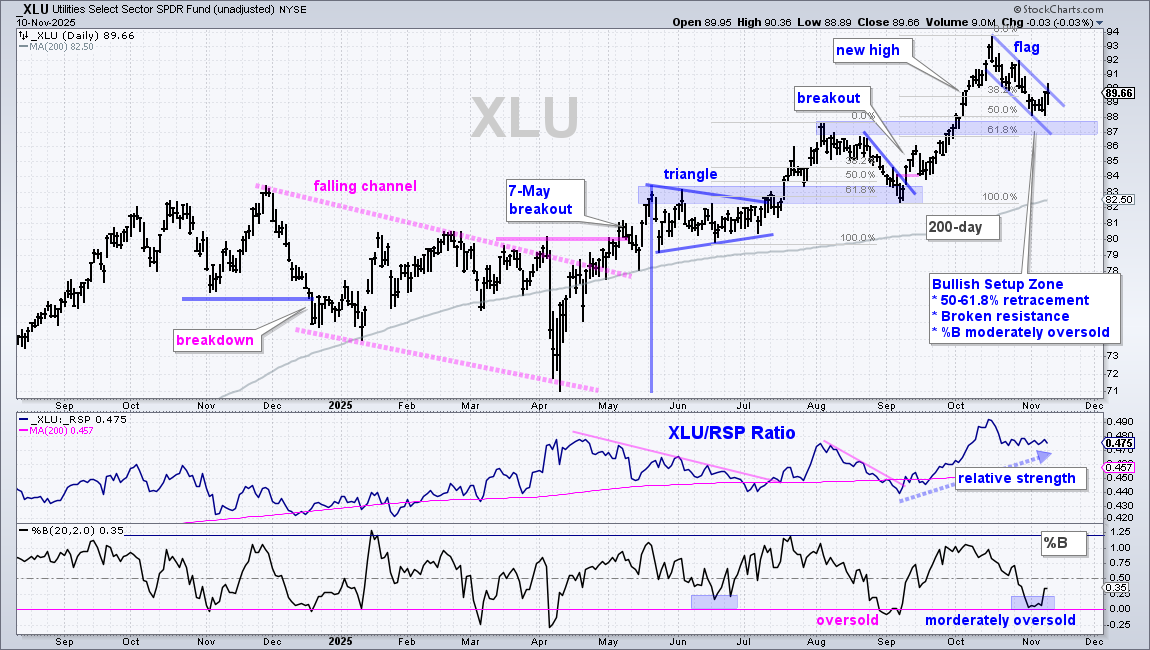
The Utilities SPDR (XLU) led the market from early September to mid October as it surged to new highs. XLU fell back the last four weeks, but I view this as a pullback within a leading uptrend. In addition, XLU is near a Bullish Setup Zone with a falling flag forming. Friday’s surge is a start, but we need follow through for a short-term breakout. A close above 90 would do the trick.
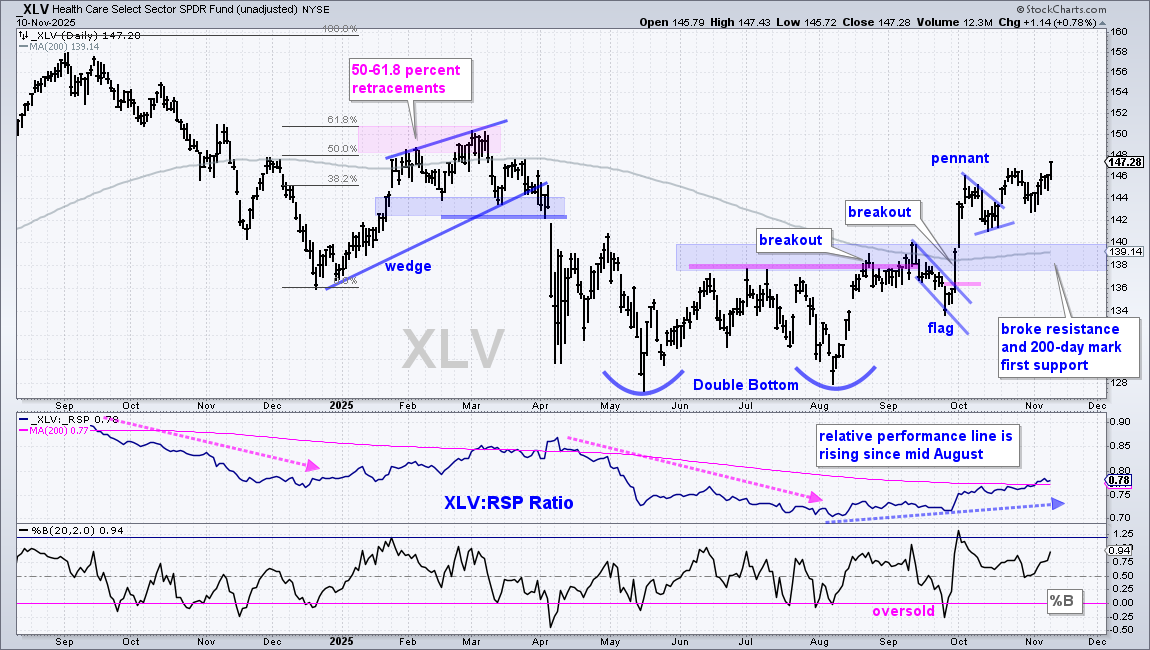
Even though the Healthcare SPDR (XLV) did not record a 52-week high recently, it is clearly leading as it moved above the October high on Monday. Not many names are trading above their October highs right now. The last bullish setup was the pennant in the first half of October. The middle window shows the price-relative rising since mid August and breaking its 200-day SMA in early November. XLV is also outperforming the broader market.
Leading Tech ETFs (MAGS, AIQ, ARTY, SKYY, CIBR, SMH, SOXX)
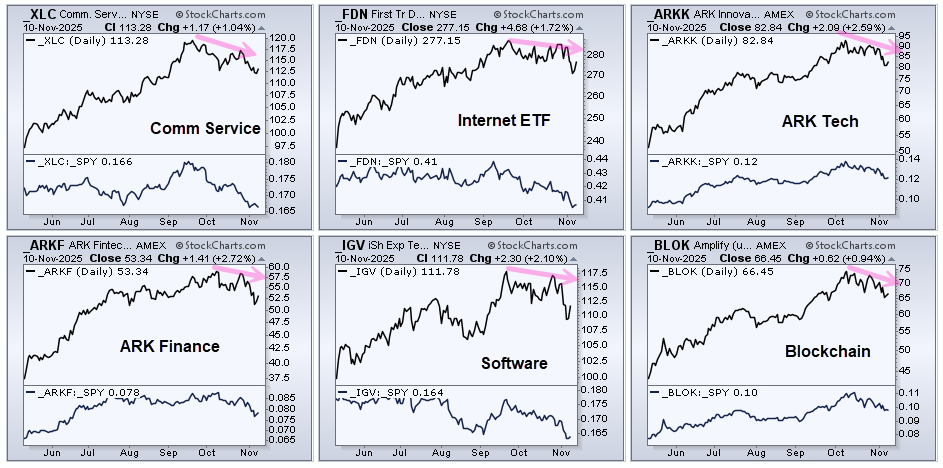
Before looking at the leaders, note that XLC, FDN, ARKK, ARKF, IGV and BLOK are lagging within the tech-related universe. These ETFs formed lower highs in late October and broke their mid October lows with declines in early November. The long-term trends are still up because they are all above their rising 200-day SMAs. Perhaps these declines are corrections within the long-term uptrend. For now, however, they are diverging from the leaders and lagging.
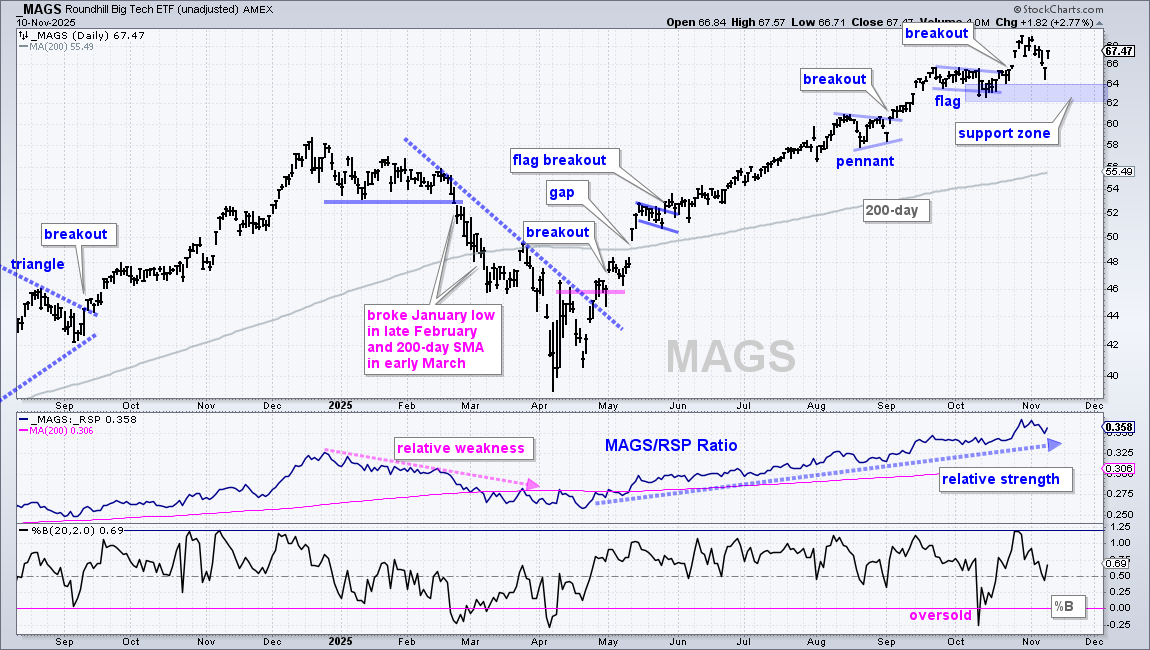
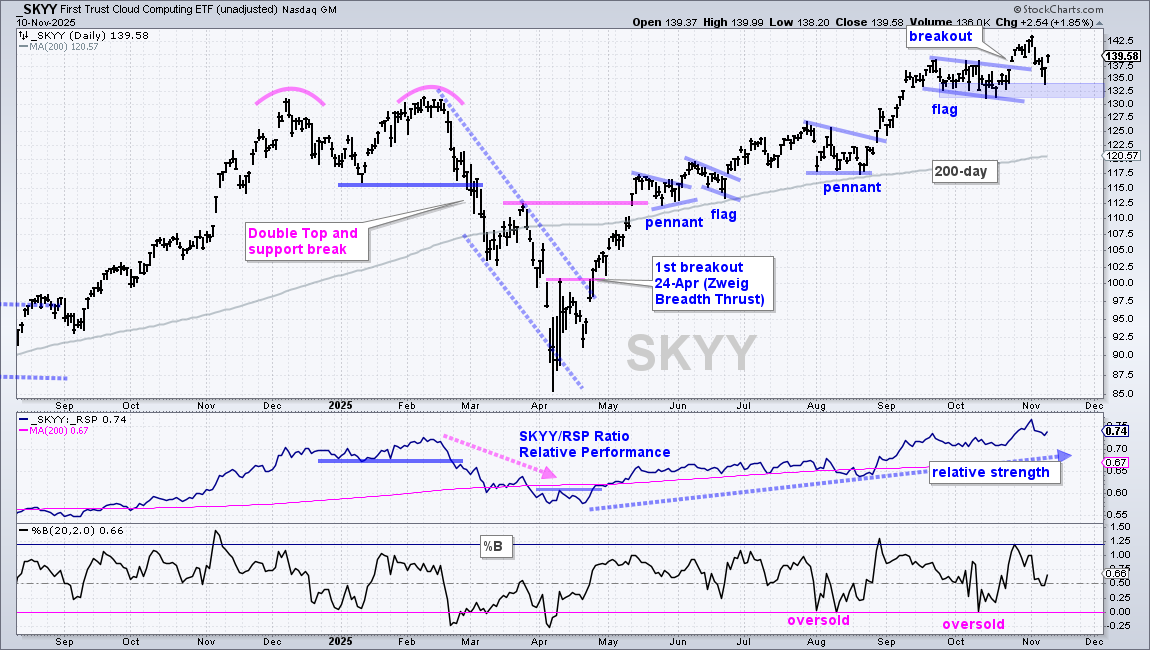
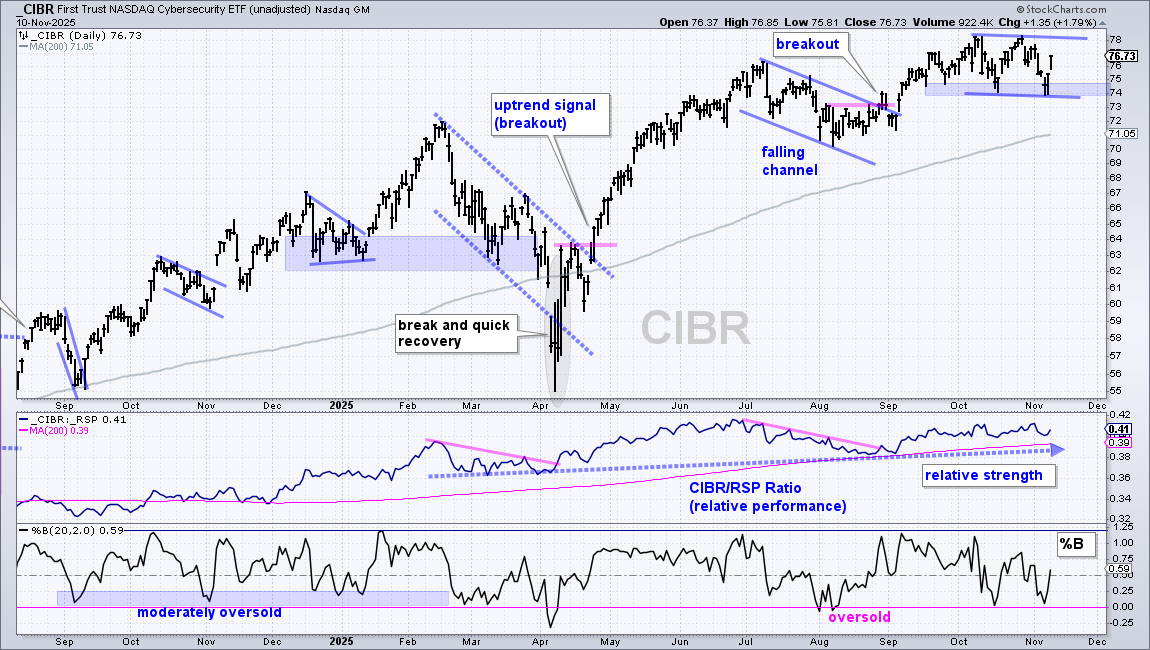
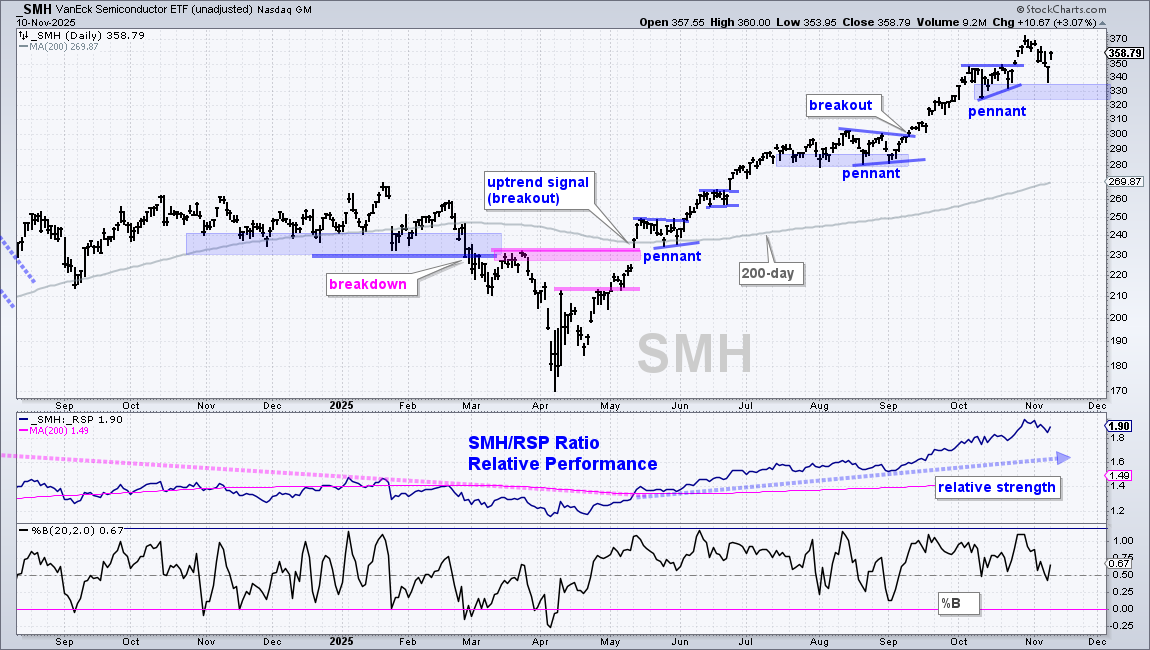
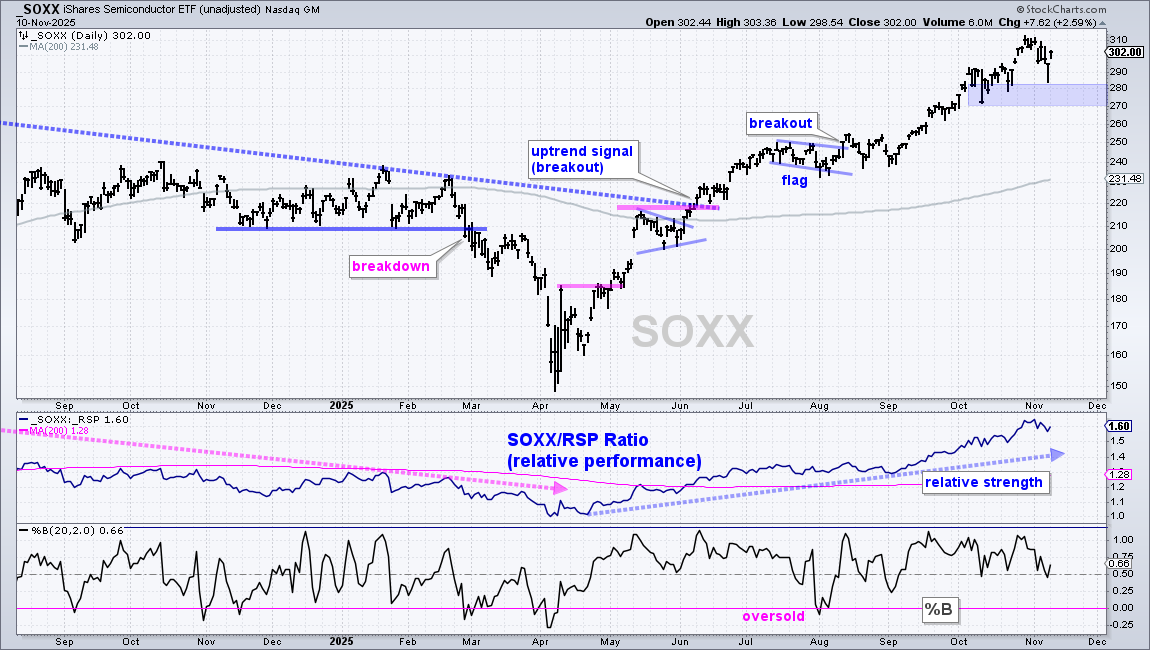
In contrast to the laggards, the leading tech ETFs hit new highs in late October and held above their mid October lows during the early November decline. The first chart shows the Mag7 ETF (MAGS) with a flag into early October, a flag breakout and a new high in late October. MAGS fell back to the breakout area on Friday and rebounded on Monday. I am marking a demand zone (support) in the 62-64 area.
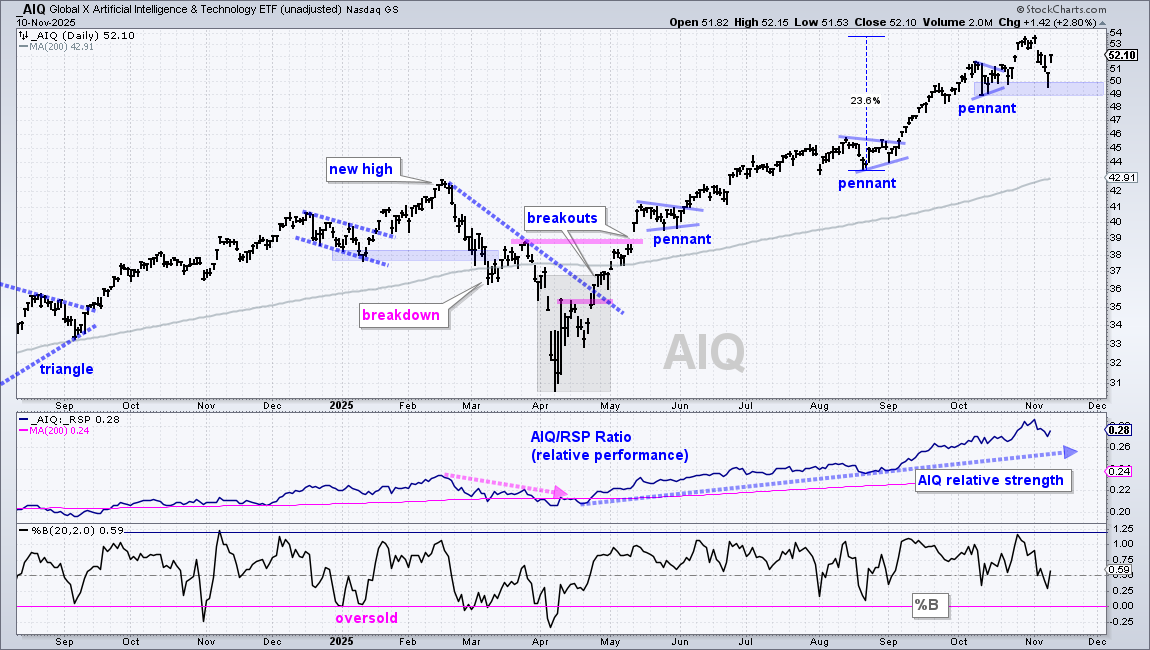
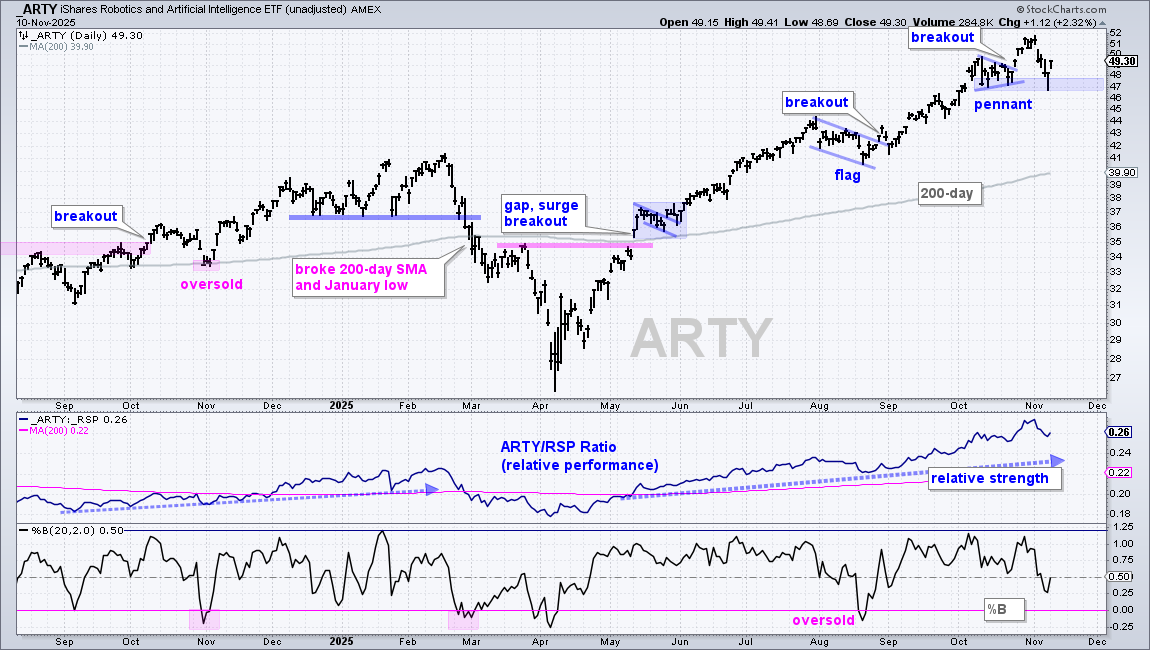
The next charts show tech-related ETFs with support zones to watch (blue shadings). The market is in good shape as long as these leaders hold support. Trouble starts should these leaders break support and forge lower lows.
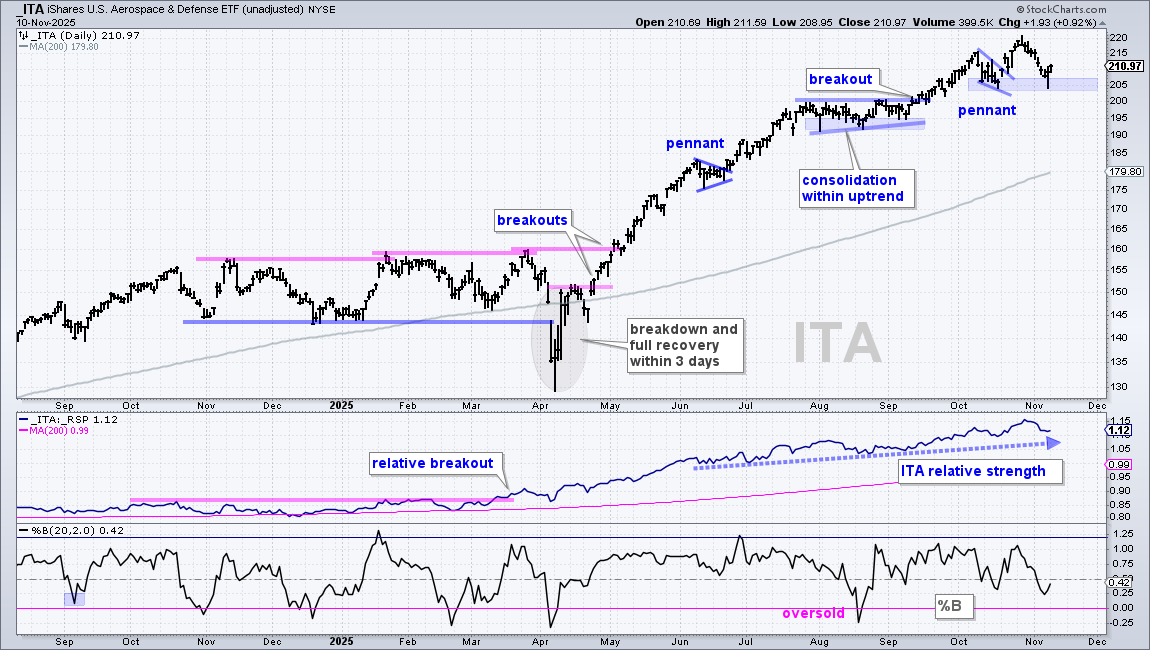
Aerospace & Defense ETF Tests October Lows
The Aerospace & Defense ETF (ITA) is acting just like the tech-related ETFs with a steady advance and new high in late October. ITA fell back towards the October lows last week and bounced on Monday. The blue shading marks first support in the 204-206 area. A break here would show the first increase in selling pressure. Keep in mind that a break below the October low would not reverse the long-term uptrend. Instead, it would suggest that a correction is unfolding and pave the way for the next trading setup (pullback within uptrend).
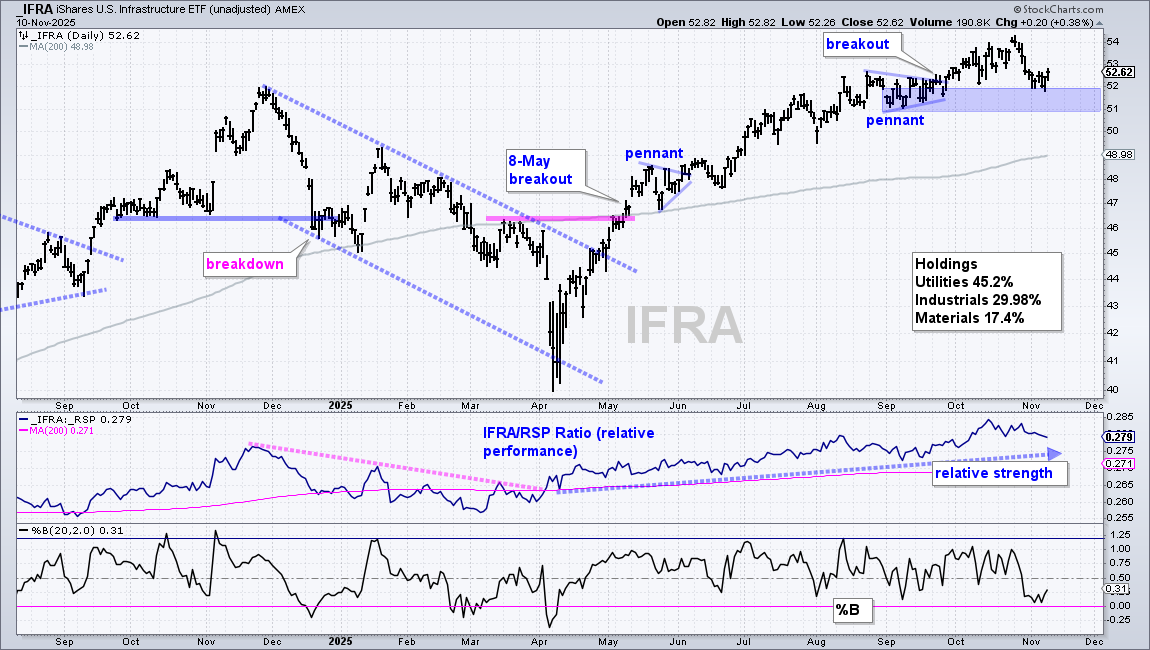
Infrastructure ETF Tests Top of Support Zone
The Infrastructure ETF (IFRA) is also in a leading uptrend with a new high in late October. IFRA fell to the mid October low and stalled the last five days. I am marking a support zone in the 51-52 area. A break here would be negative and argue for a correction. Note that this ETF is dominated by the Utilities sector (45.2%), which is strong. However, 17.4% of its components are from the Materials sector, which is one of the weakest right now.
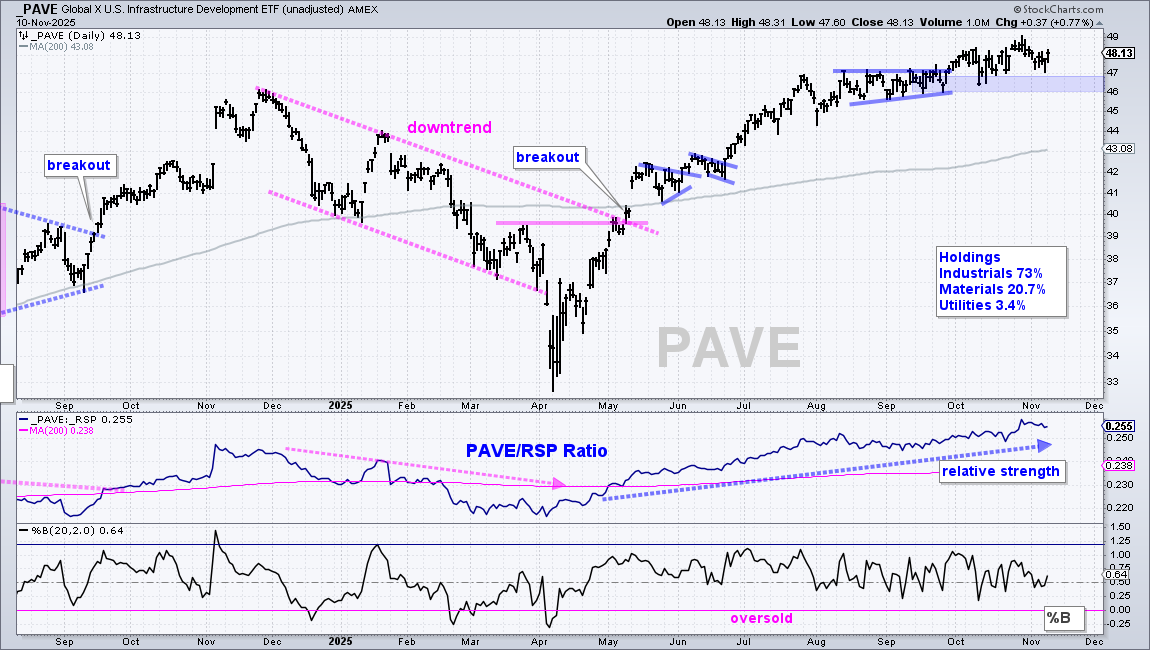
The Global Infrastructure ETF (PAVE) is actually stronger than IFRA. As the holdings show, the industrial sector dominates with a 73% weighting. PAVE hit new highs in late October and held above its mid October low with the early November pullback. I am marking support in the 46-47 area.
DISCLAIMER: This content provided strictly for informational and educational purposes. It should not be interpreted as an offer to buy or sell any security, nor as a solicitation to engage in any investment activity. Nothing here constitutes a recommendation regarding any specific security, portfolio, transaction, or investment strategy.
At times, the author or affiliates may hold positions or interests in securities discussed. Any stocks or examples mentioned are not endorsements or suggestions to purchase. This material does not consider your individual financial goals or circumstances, and you should seek guidance from a qualified financial or investment adviser before making any trading or investment decisions.
Past performance does not guarantee future results.
Send feedback to support(at)trendinvestorpro.com or use the contact form.