The weight of the evidence remains bullish for stocks with large-caps and tech stocks leading the way. Utilities, defense and big banks are also strong. Small-caps and mid-caps are more mixed. We could be in for some volatility as the headlines flow from Washington DC. What else is new? We could also be in for a rough ride because October is coming – and October can be a dangerous month for stocks. The other dangerous months are November, December, January, February, March, April, May, June, July, August and September (Mark Twain). As always, we need to focus on the charts and price action, and tune out the headlines.
Weight of the Evidence is Bullish
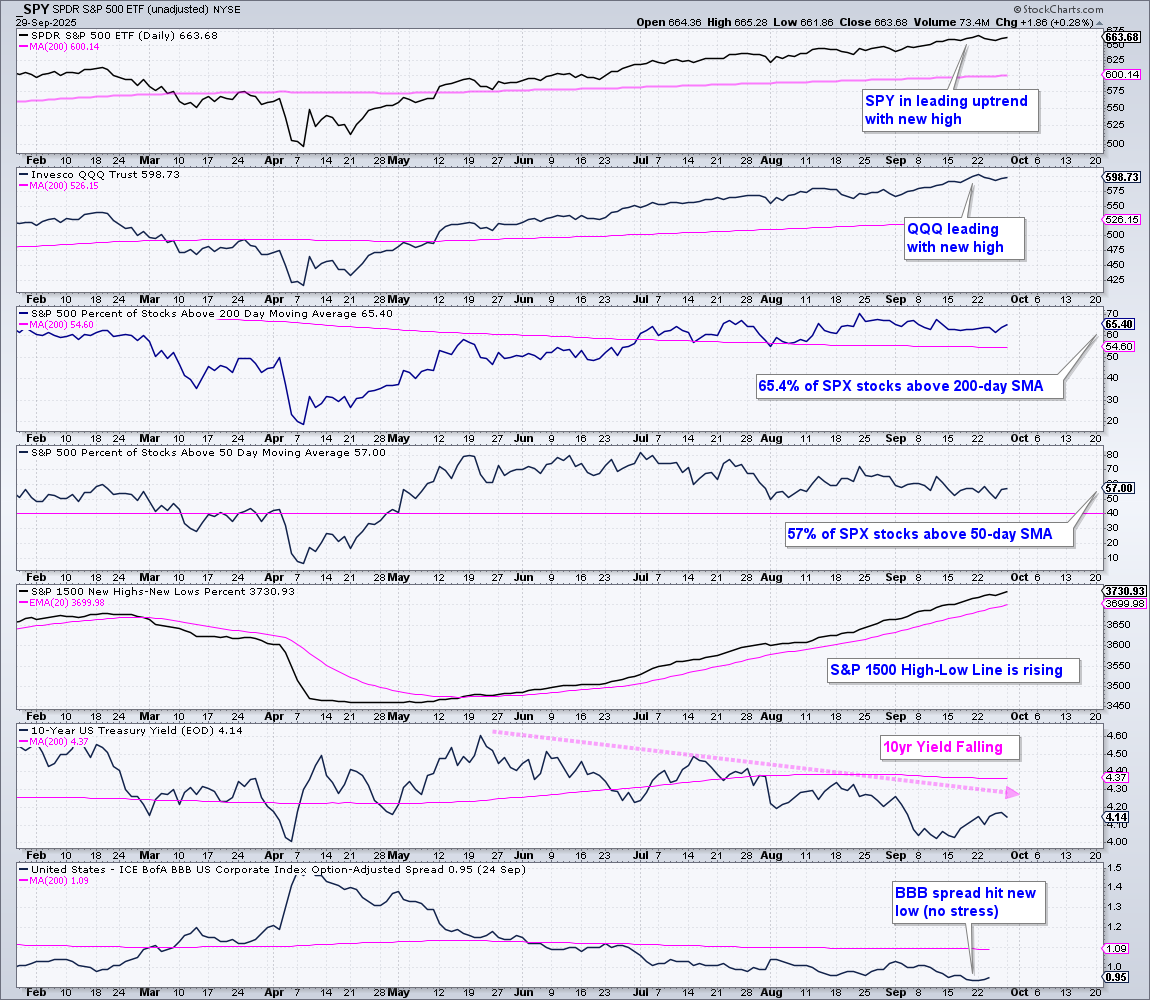
This first chart sums up the broad market environment, which is bullish. Large-caps are leading with SPY and QQQ hitting new highs in late September. 65.4% of S&P 500 stocks are above their 200-day SMAs, which means the vast majority of stocks are in uptrends. 57% are above their 50-day SMAs. This is less than in May-June, but still supportive of a bull market. The trouble starts if this indicator breaks below 40% (pink line).
I am not impressed with the number of new highs, but the S&P 1500 High-Low Line continues to rise and remains above its 20-day EMA. This means new highs are still outpacing new lows. In the credit markets, the 10yr T-Yield ($UST10Y) is in a downtrend and the Fed is dovish. The BBB Yield spread hit a new low in late September and there are no signs of stress in the credit markets.
Rising Channels Define Upswings for SPY and QQQ
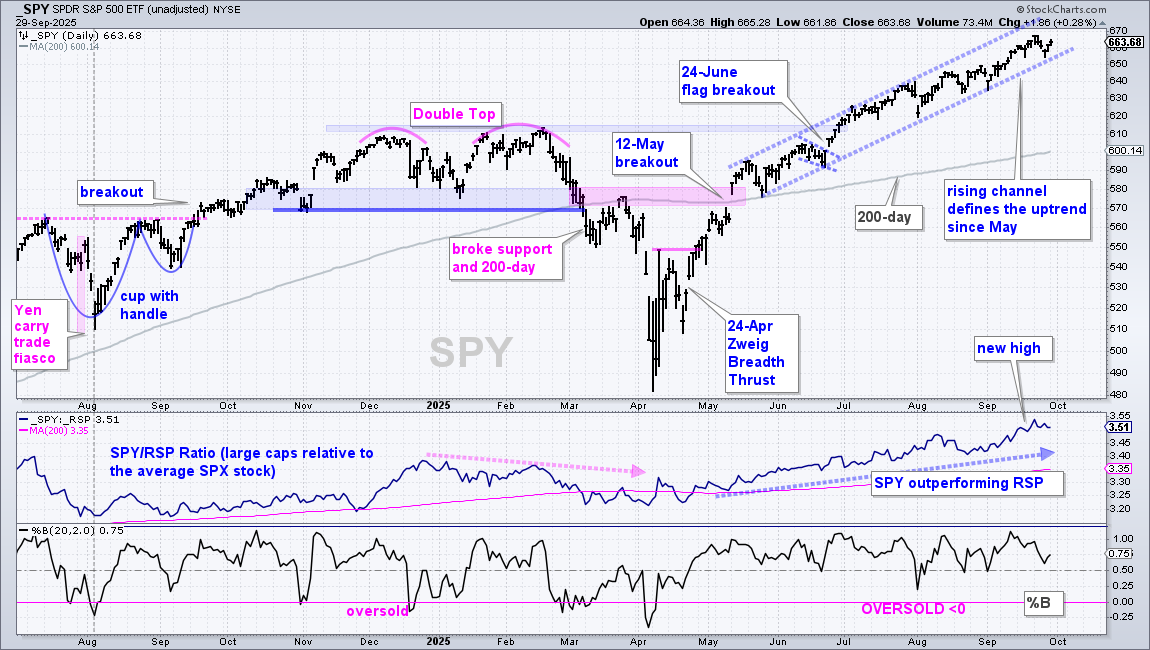
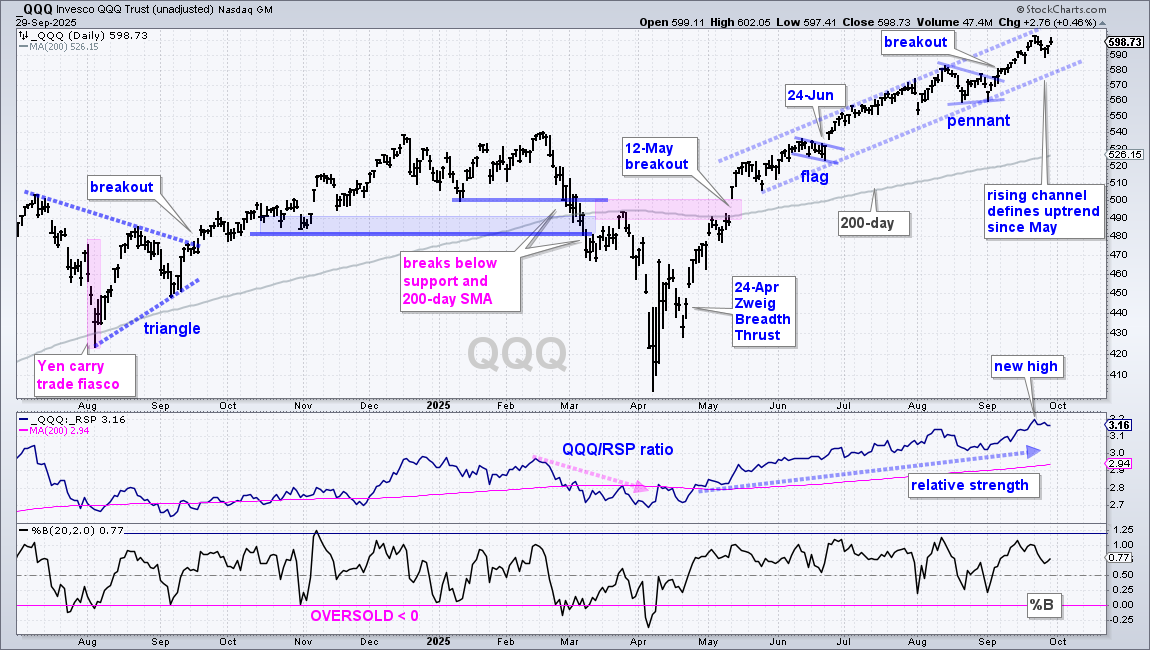
There are no changes in the SPY and QQQ charts. Both are in long-term uptrends and leading the market with new highs in late September. Their price-relatives (SPY/RSP ratio) also hit new highs (relative strength).
Rising channels from mid-May to September define the immediate uptrends. Pullbacks were shallow and there was a push to new highs after each pullback. A break below the lower channel line would show a loss of upside momentum and argue for a corrective period (pullback or consolidation).
Big Tech Continues to Lead the Market
The Technology SPDR (XLK), Communication Services SPDR (XLC) and Mag7 ETF (MAGS) continue to power the market higher. Strength in these three benefits SPY and QQQ, which are driven by large-cap tech. Note that the tech sector accounts for 34.5% of the S&P 500.
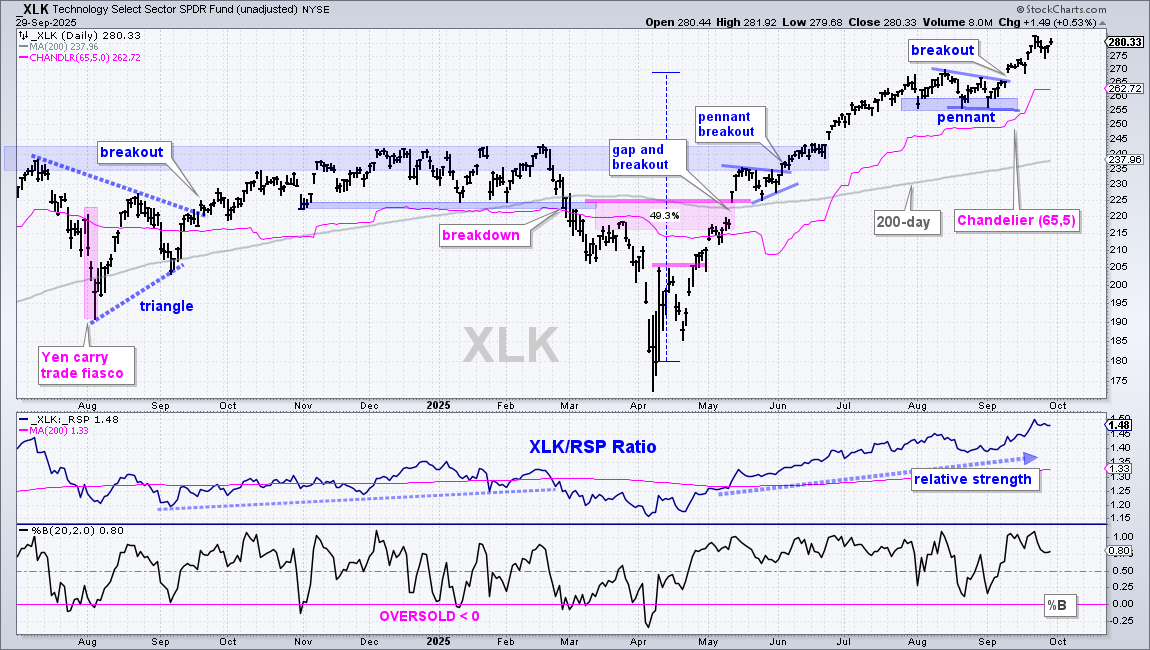
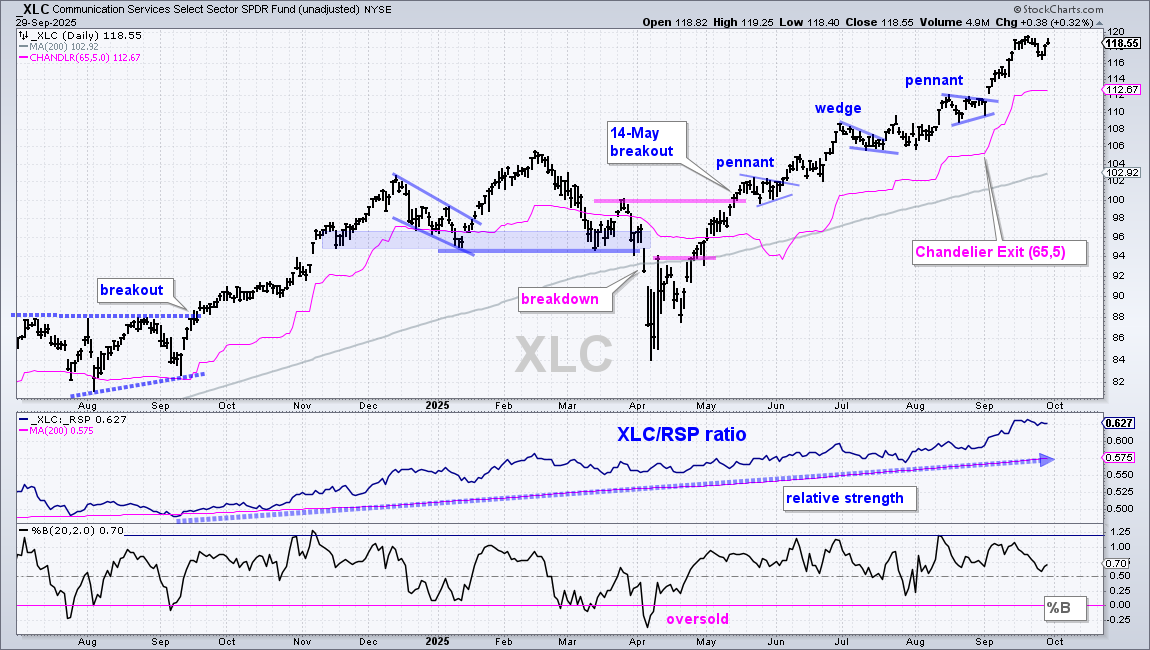
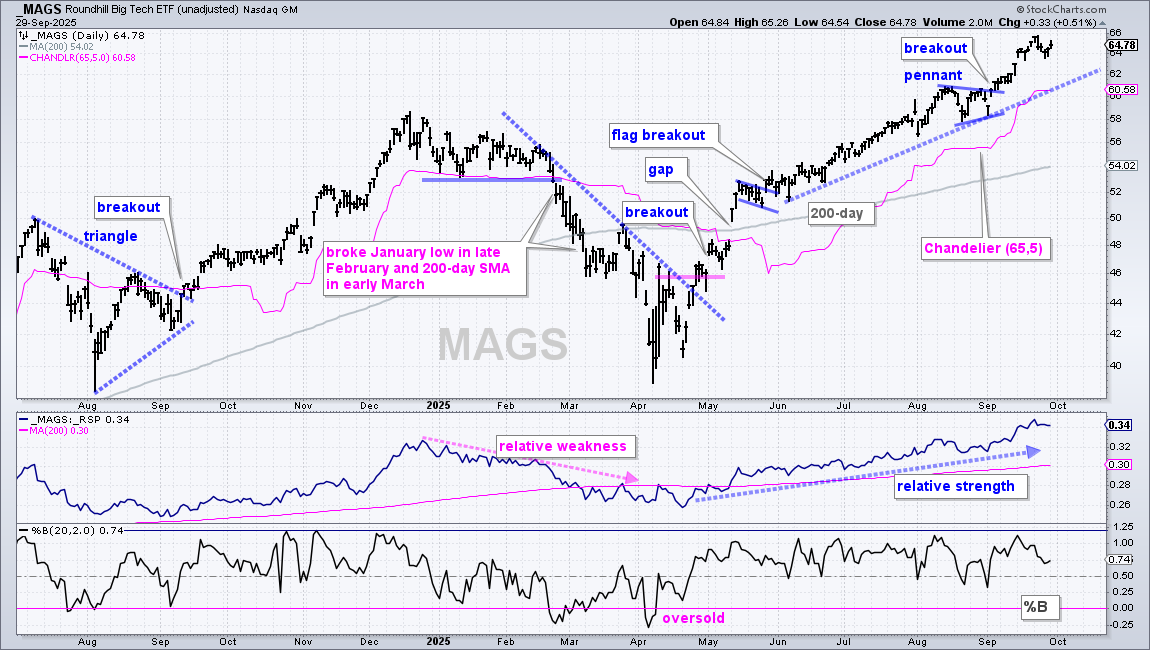
There is no change on these charts because they are in the trend-monitoring phase. There were setups with consolidations in August and breakouts in late August or early September. These ETFs extended their gains after breaking out and reached new highs in late September. They are in leading uptrends, but I do not see any trading setups on the charts. Thus, I am simply monitoring price action at this stage and managing the trade.
The first chart shows the Technology SPDR (XLK) with a pennant breakout in early September and the Chandelier Exit (65,5) for reference. This trailing stop is 5 ATR(65) values below the 65-day high. It continues to rise as long as there are higher highs and the uptrend extends.
The next chart shows the Communication Services SPDR (XLC) hitting a new high as the uptrend extended into late September.
The next chart shows the Mag7 ETF (MAGS) with the Chandelier Exit (65,5) at 60.58. Notice that %B has not been oversold (<0) since April. This is a testament to the strength of the advance since May. Dips were very shallow and there were no oversold setups.
Update on Tech Related ETFs
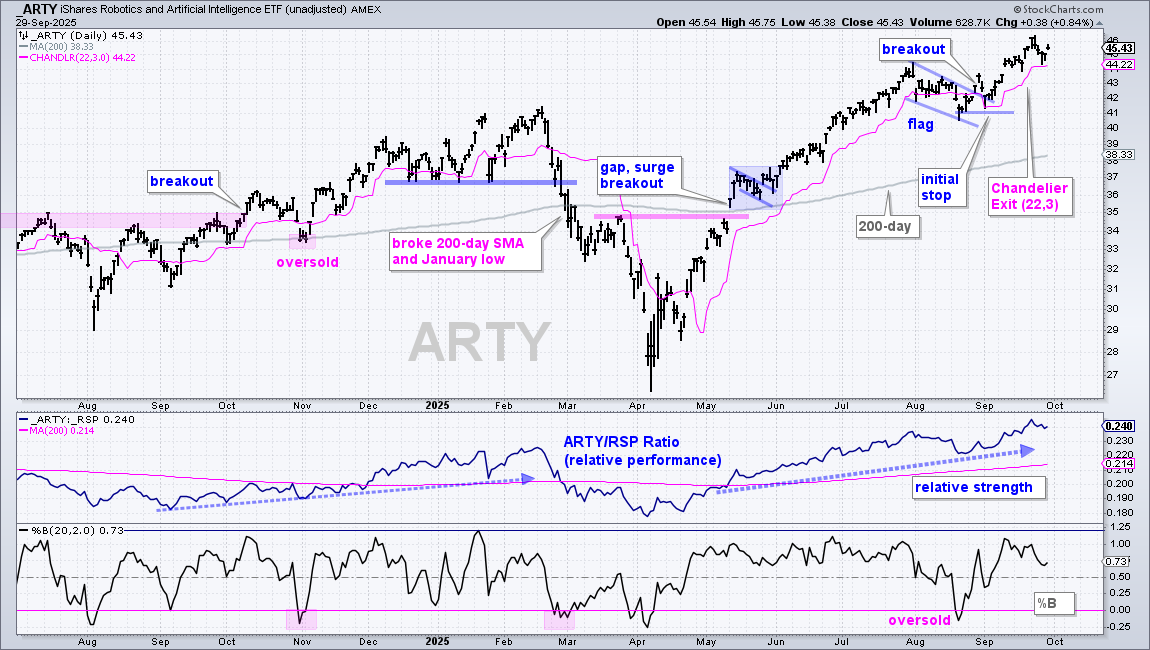
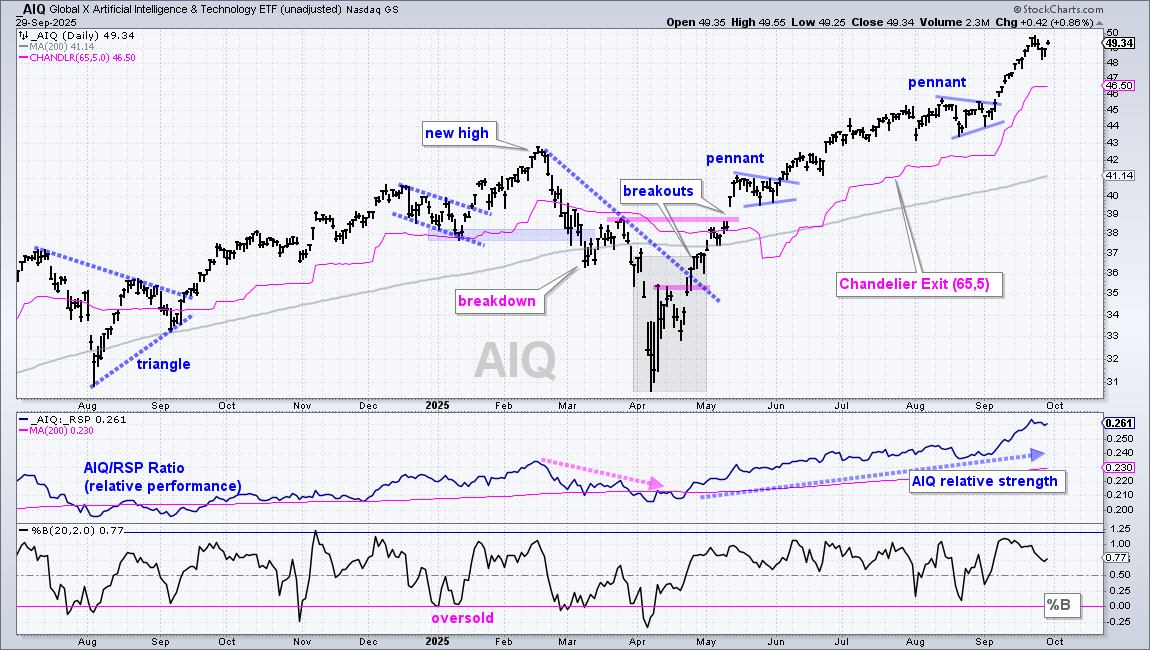
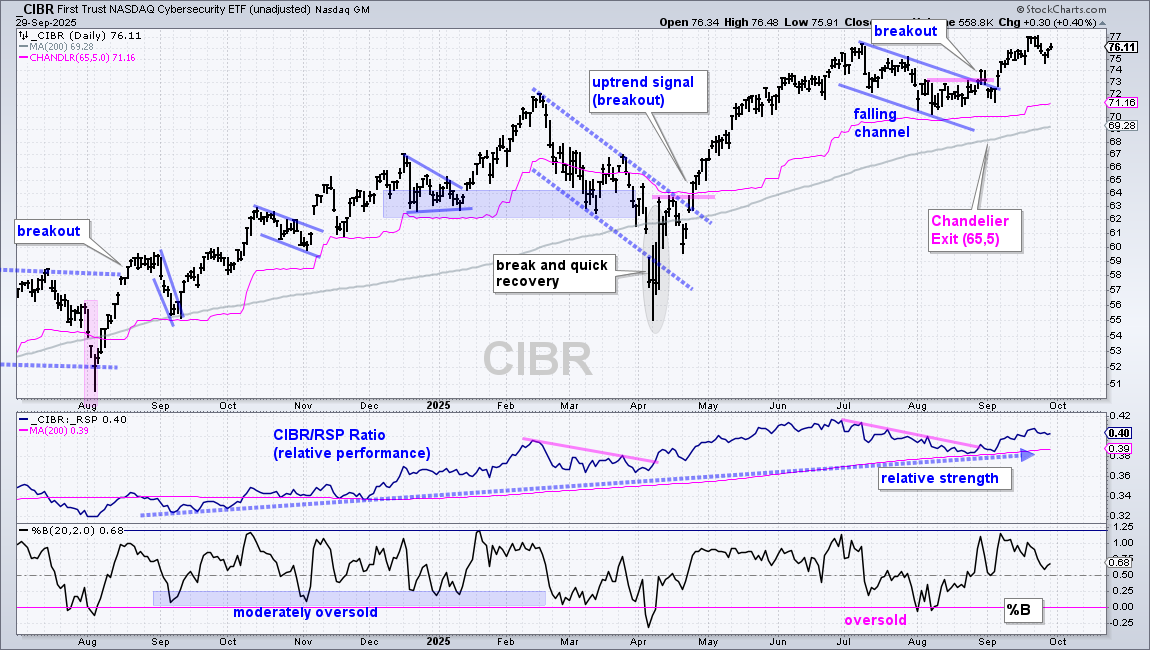
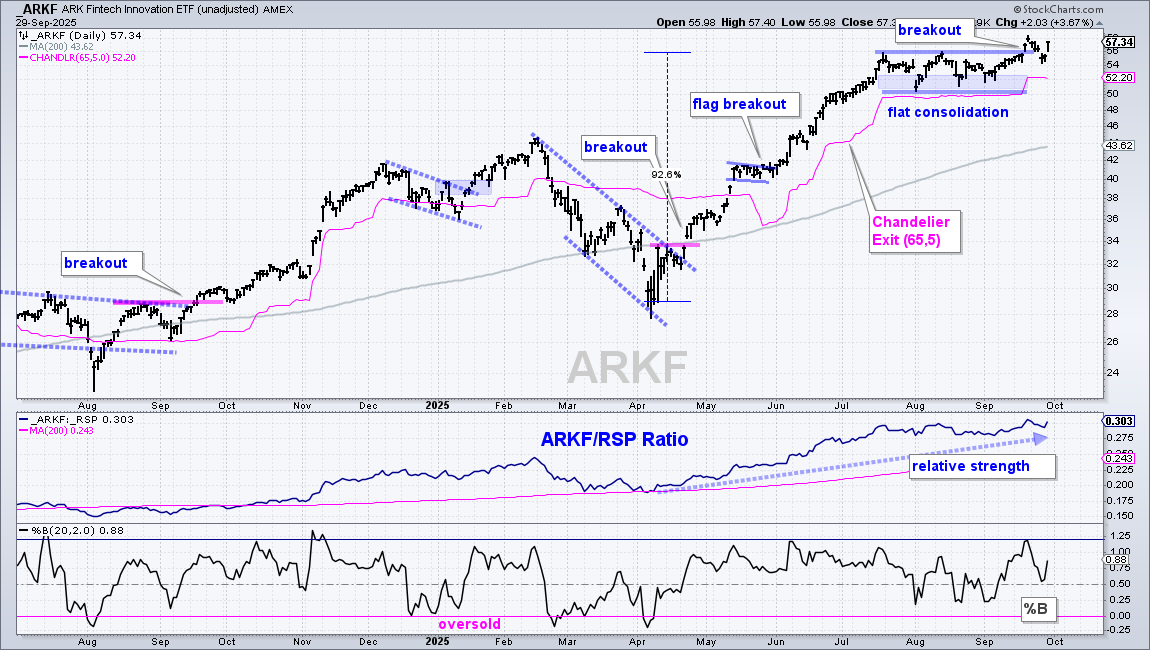
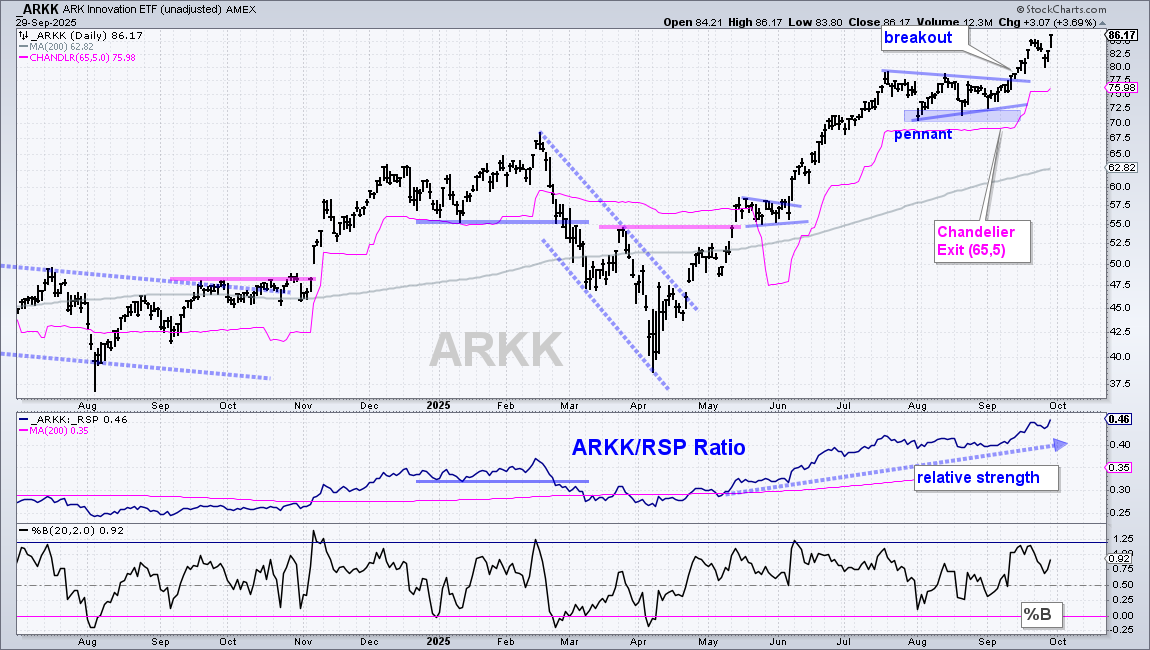
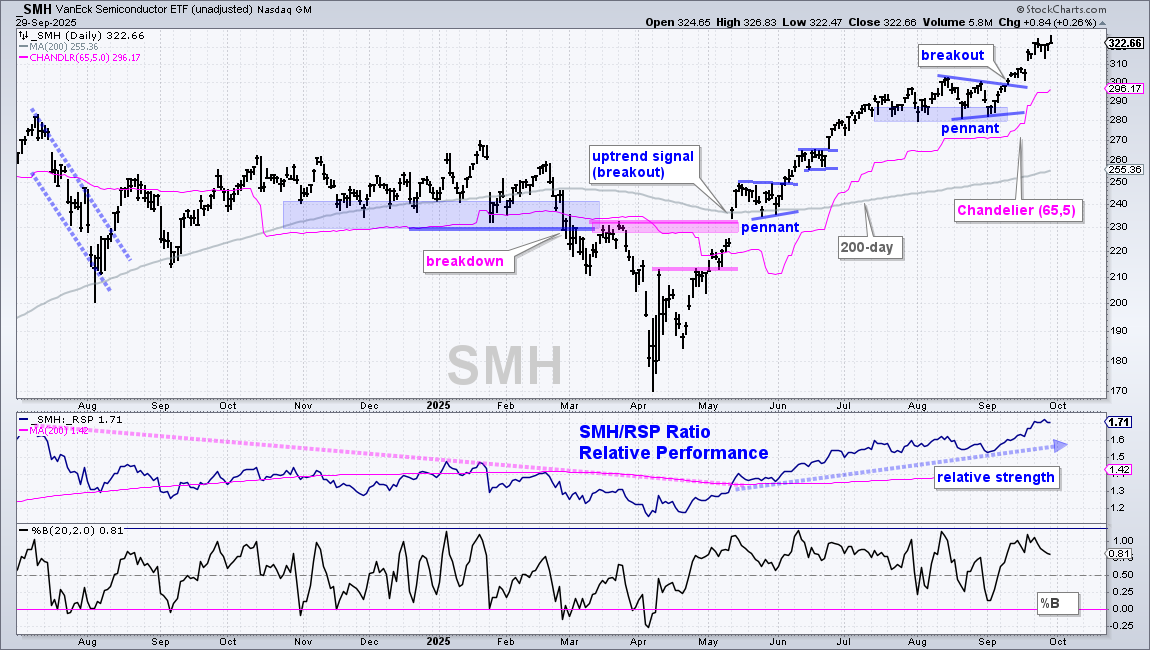
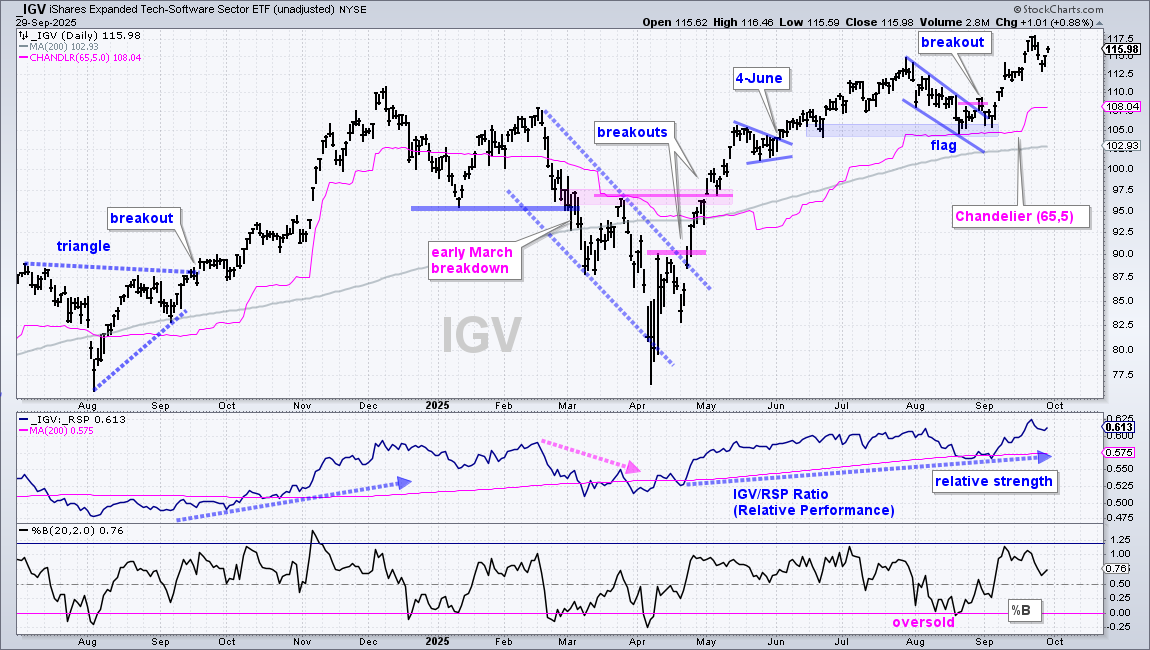
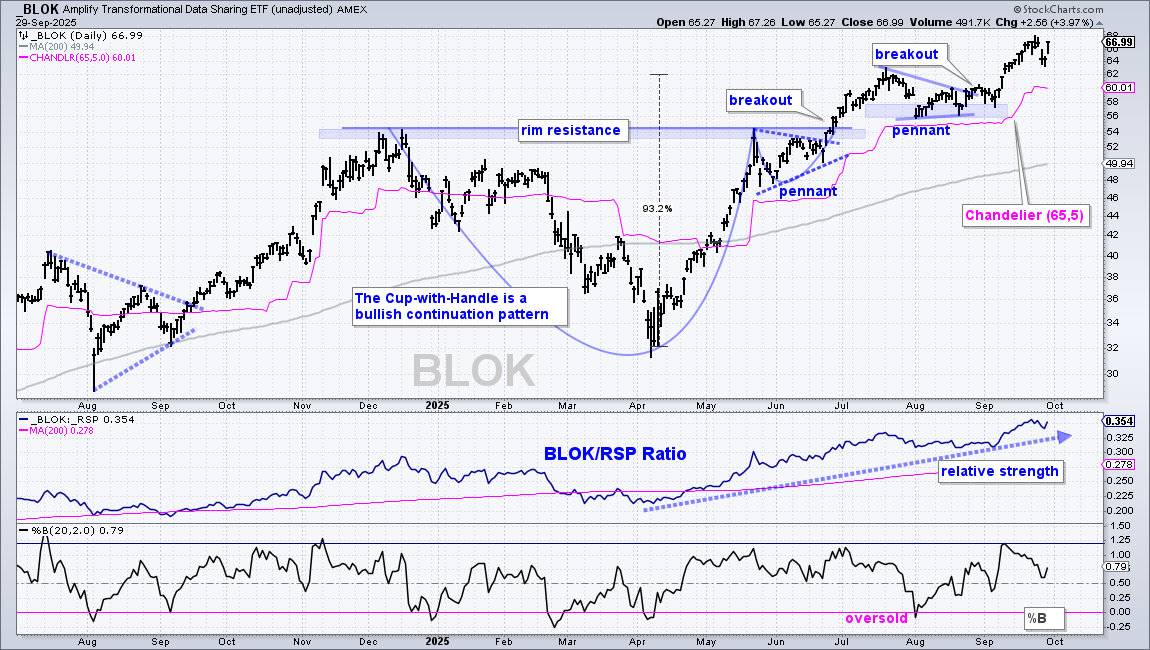
The next charts shows the key tech related ETFs with the Chandelier Exits for reference. The first chart shows the Robotics AI ETF (ARTY) with a Chandelier Exit (22,3). This is the short-term trader’s exit because it is much tighter and more likely to trigger. The Chandelier Exit (65,5) is the trend-follower’s (accumulator) exit because it is much wider. It’s a personal choice.
Finance SPDR Remains in Steady Uptrend
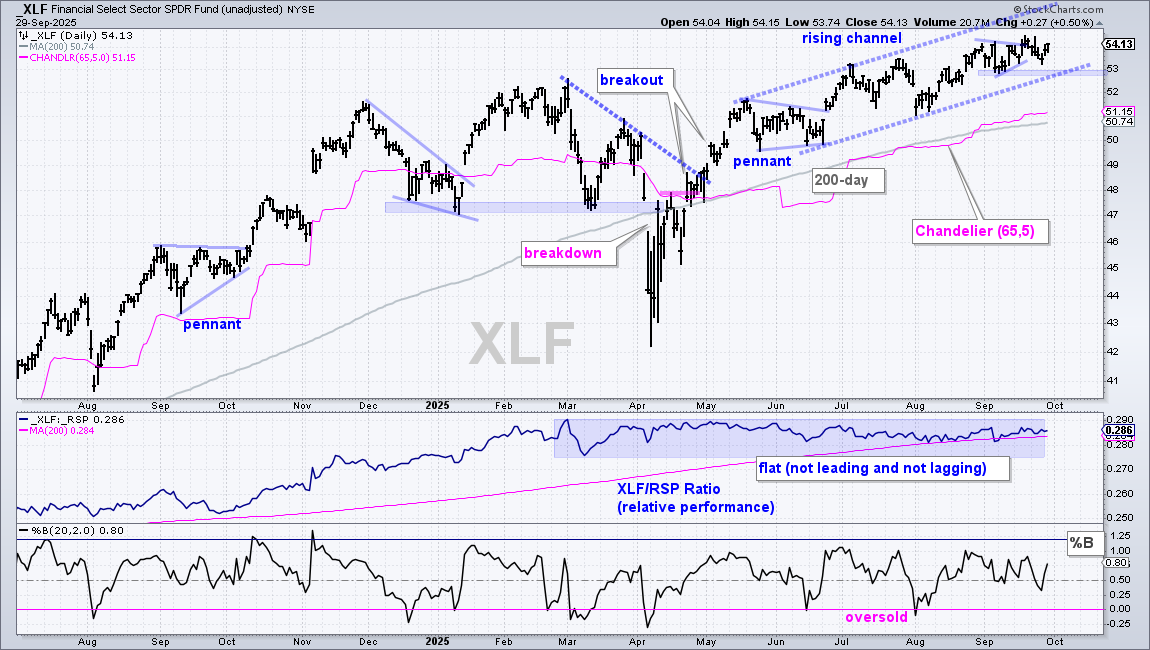
The Finance SPDR (XLF) remains one of the stronger sectors with new highs in July, August and September. As with many ETFs, XLF broke out with a big move in April-May, and then worked its way higher since June. The blue dashed lines define the immediate uptrend as a rising channel. A close below the September low would break channel support and argue for a correction within the long-term uptrend.
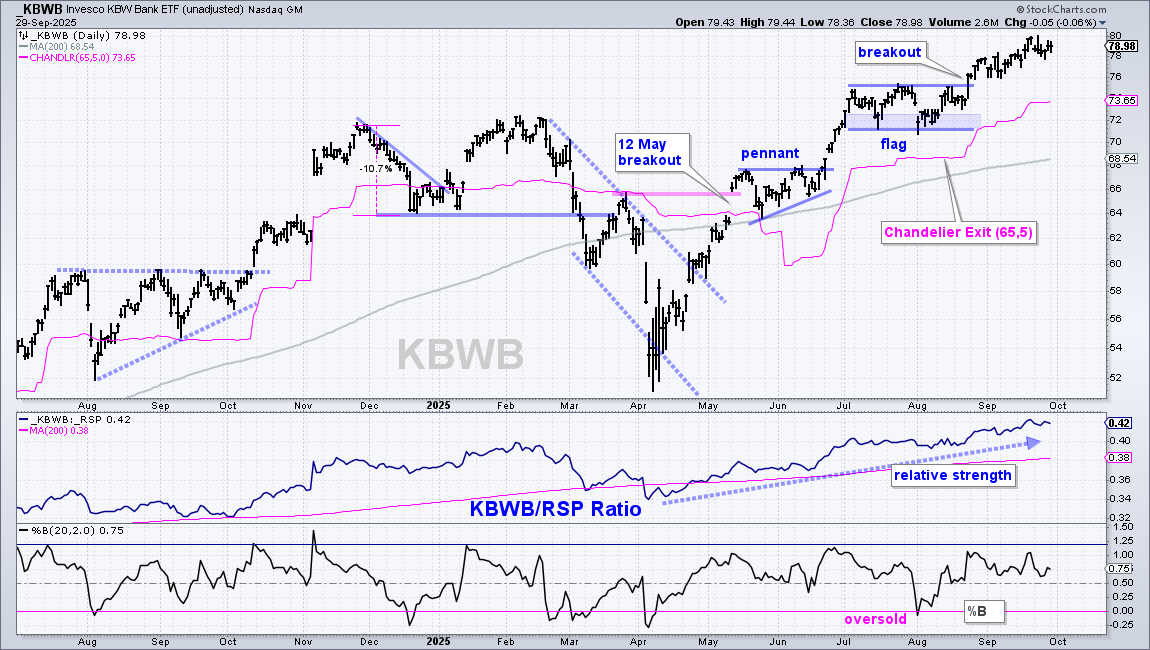
The KBW Bank ETF (KBWB) is leading within the Finance sector. KBWB is stronger than XLF, the Regional Bank ETF (KRE), the Bank SPDR (KBE) and the Insurance ETF (KIE). On the price chart, KBWB consolidated into August and broke out in late August. The ETF extended to new highs in September and the price-relative (KBWB/RSP ratio) also hit new highs (relative strength). The ETF is currently in the trend-monitoring phase, which means it is in the midst of an advance and there is no setup on this chart right now.
Defense ETF Tags Another New High
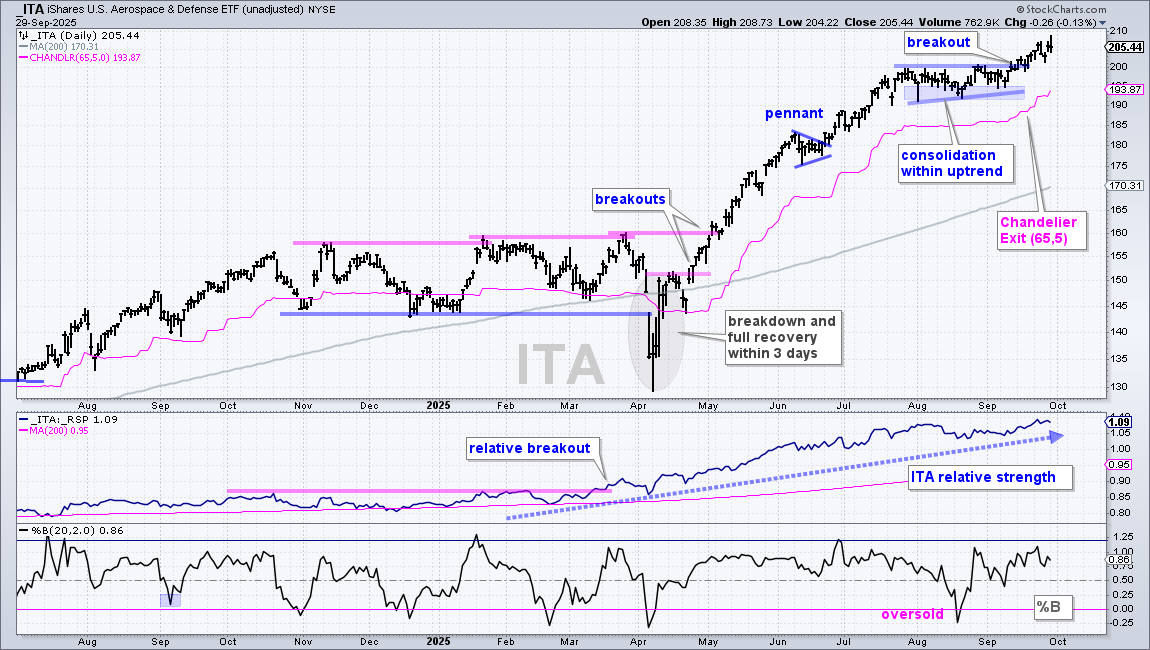
The Aerospace & Defense ETF (ITA) remains a leader with new highs in price and the price-relative (ITA/RSP ratio) in late September. Short-term, the ETF consolidated in August-September and broke out in mid-September. ITA followed through on this breakout with further gains above 205. ITA is in the trend-monitoring phase and there is no trading setup right now.
XLU Starts to Outperform as Breakout Extends
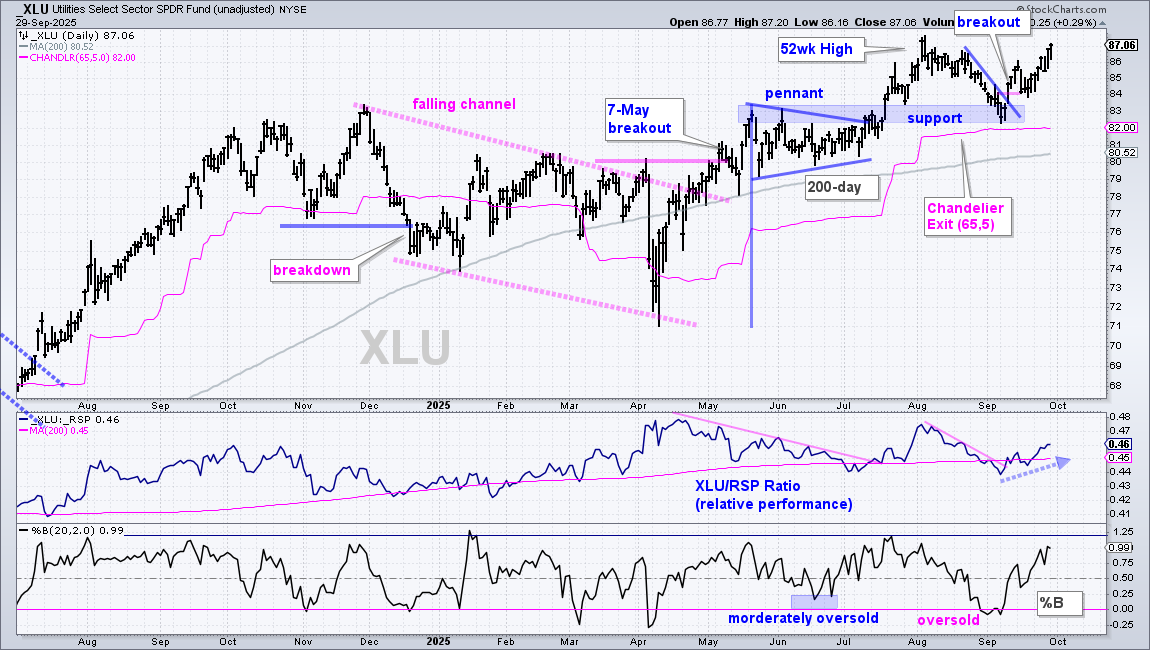
The Utilities SPDR (XLU) is leading in September as it extends on its breakout and the price-relative rises. XLU hit a new high in early August, corrected into early September and broke out with a surge above 84 (10-Sept). Notice that broken resistance turned into support (blue shading) and %B was oversold (<0) in late August (bottom window). This was a classic pullback within an uptrend, and a bullish setup. With strong follow-through on the 10-Sept breakout, the ETF is closing in on another 52-week high. The middle window shows the price-relative (XLU/RSP ratio) turning up this month as XLU outperforms again.
Healthcare Hits Bullish Setup Zone
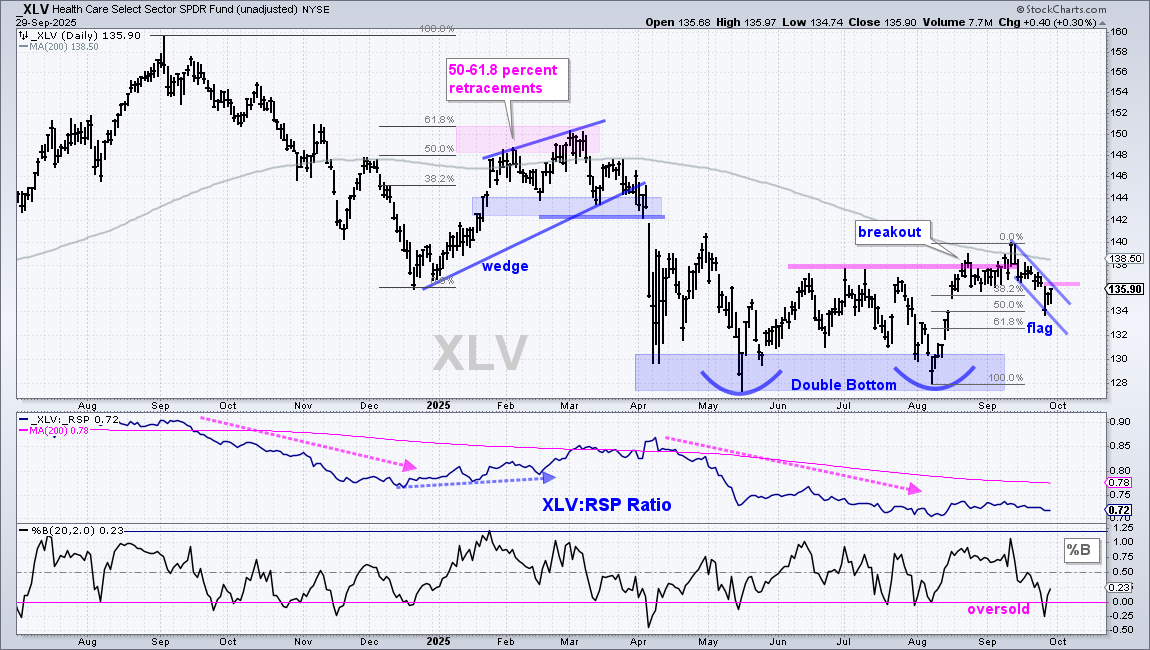
The Healthcare SPDR (XLV) is not a leader, but it shows promise with a Double Bottom breakout and short-term oversold condition. First, the ETF found support in the 128 area with lows in May and August. It then broke the intermittent high with a surge into late August and extended further with a close above the 200-day SMA in early September. These breakouts did not last long as the ETF fell back below the 200-day and the breakout zone. Is this a failed breakout or just a pullback after the August-September surge? I will argue for the latter.
XLV surged 7% in mid August and broke the prior high. I view this as an outsized move or thrust off the support zone in the 128-130 area. XLV broke the June-July highs with strong momentum. A pullback after a big advance is normal. XLV is setting up short-term bullish because %B became oversold, the decline retraced 50% of the prior surge and a falling flag formed. After a big move lower on Thursday, the ETF formed two inside days and a close above Wednesday’s close (136.39) would trigger a short-term breakout.
Housing ETFs Become Oversold
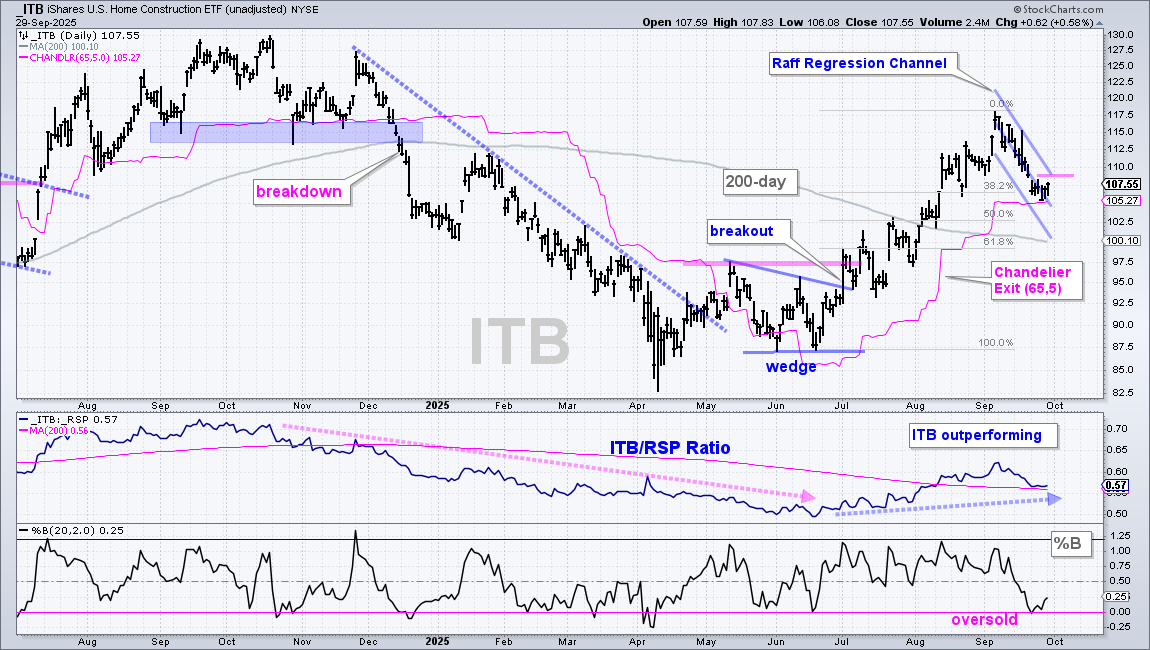
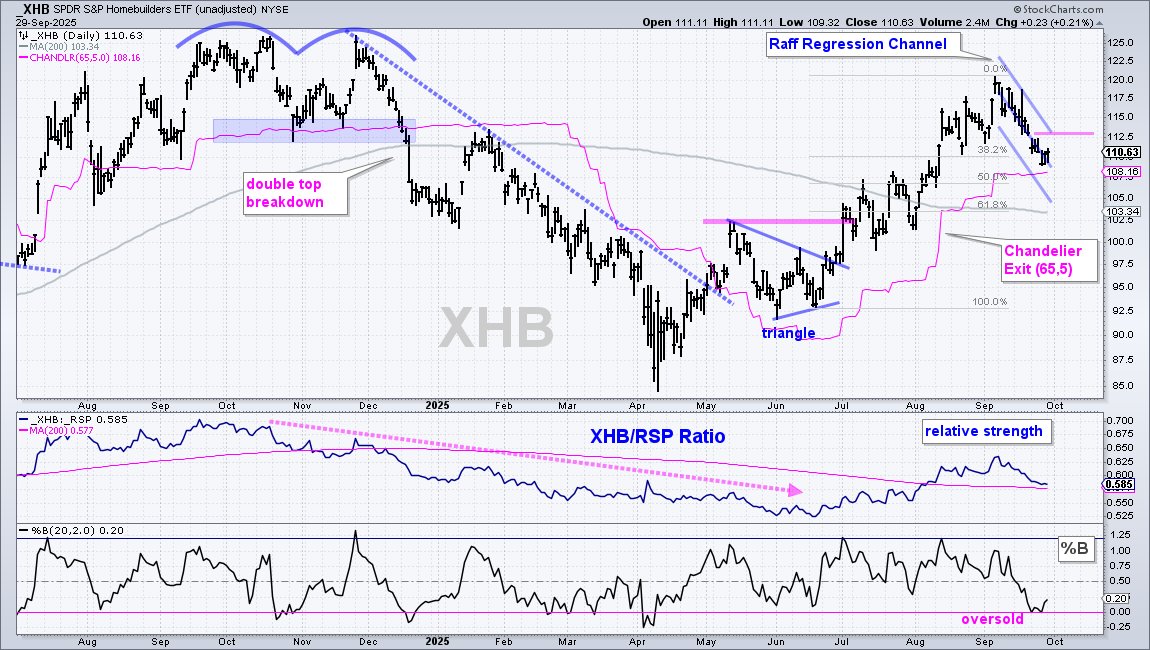
The Home Construction ETF (ITB) and Homebuilders ETF (XHB) surged into early September and pulled back to become oversold in late September. The first chart shows ITB advancing 34% from mid June to early September. ITB broke its 200-day SMA in the process and hit a new high for 2025 (not a 52-week high). The middle window shows the price-relative (ITB/RSP ratio) moving above its 200-day SMA in August as ITB starts outperforming. There is an argument to be made that ITB is in an uptrend and showing relative strength – at least since summer.
Short-term, the ETF pulled back in September with a decline to the 105 area. Pullbacks within uptrends are short-term bullish setups. This pullback also retraced 38-50 percent of the prior advance and produced an oversold condition as %B dipped below zero in late August (lower window). This means we should be on alert for a short-term breakout.
The highs and lows make it impossible to draw a nice flag or wedge on the price chart so I am using the Raff Regression Channel to define the downswing. The middle line is a linear regression and the outer lines are equidistant from the furthest high or low. This channel defines the downswing with resistance marked at 109. A close above this level would produce a short-term breakout. The next chart shows XHB with similar characteristics.
DISCLAIMER: This content provided strictly for informational and educational purposes. It should not be interpreted as an offer to buy or sell any security, nor as a solicitation to engage in any investment activity. Nothing here constitutes a recommendation regarding any specific security, portfolio, transaction, or investment strategy.
At times, the author or affiliates may hold positions or interests in securities discussed. Any stocks or examples mentioned are not endorsements or suggestions to purchase. This material does not consider your individual financial goals or circumstances, and you should seek guidance from a qualified financial or investment adviser before making any trading or investment decisions.
Past performance does not guarantee future results.
Send feedback to support(at)trendinvestorpro.com or use the contact form.