I am posting reports and videos on Saturday (September 13th) because I am traveling next week and it will be difficult to post regular updates. These Saturday reports set the stage for next week with key support levels to watch, recent breakouts to monitor and the situation with market breadth. It is a bull market until proven otherwise.
The Fed meets next week with a policy statement expected on Wednesday, September 17t. Fed statements and actions can lead to above average volatility in the markets (bonds, stocks, gold, $USD). It is important to ignore intraday noise and put price action into perspective. Focus on the charts. Check the trend, pattern at work, active signal, re-evaluation level and support level.
Traveling Next Week – Limited Coverage
Saturday 13-Sept: Report/Video covering Broad Market and Alternative ETFs
Wednesday 17-Sep: Educational Report/Video
Monday 22-Sep: Report/Video with Chart and Analysis Update
Key ETFs and Indicators to Watch for Market Health
There are two stock markets. First, we have the large-cap driven ETFs, such as SPY and QQQ, where the top ten stocks account for a disproportionate share. Second, we have the rest of the stock market, which covers the other 490 stocks in the S&P 500 or the other 90 stocks in QQQ. This is a market of mega caps and the rest.
A comprehensive market picture should focus on price action for SPY and QQQ, as well as breadth indicators for the broader market. SPY and QQQ capture the behemoths, while the breadth indicators show us what is happening inside the indexes. The market is in good shape when SPY and QQQ are in uptrends and breadth indicators are bullish. This is currently the case. Today’s report will review the charts for SPY and QQQ, and then look at some breadth indicators.
Prior Reports/Videos - TLT, XLV, Tech ETFs, XLU
In the Friday Chart Fix, I covered the relationship between TLT and SPY. Bonds are surging, but stocks are fine as long as they continue to outperform bonds. This report also covered the Double Bottom in XLV and a Trend Composite signal in Biogen (BIIB).
On Saturday, I updated the charts from Thursday’s report because the analysis is unchanged. This report covered the key levels for tech-related ETFs (XLK, MAGS, ARTY, CIBR, IGV, BLOK, SMH, SOXX, ARKF, ARKK), as well as IJH, IJR, KRE and XLU.
SPY and QQQ Tag New Highs
I was going to show weekly charts, but the price action since April is the only price action that matters. We can see past signals, setups, support and resistance on the left side. Current and future decisions will come from the right side of the chart.
SPY and QQQ hit all time highs in late June – and then continued higher in July, August and September. There is no historical data above the September high. They are in “uncharted” territory. More importantly, they are in leading uptrends and this is bullish for the rest of the market.
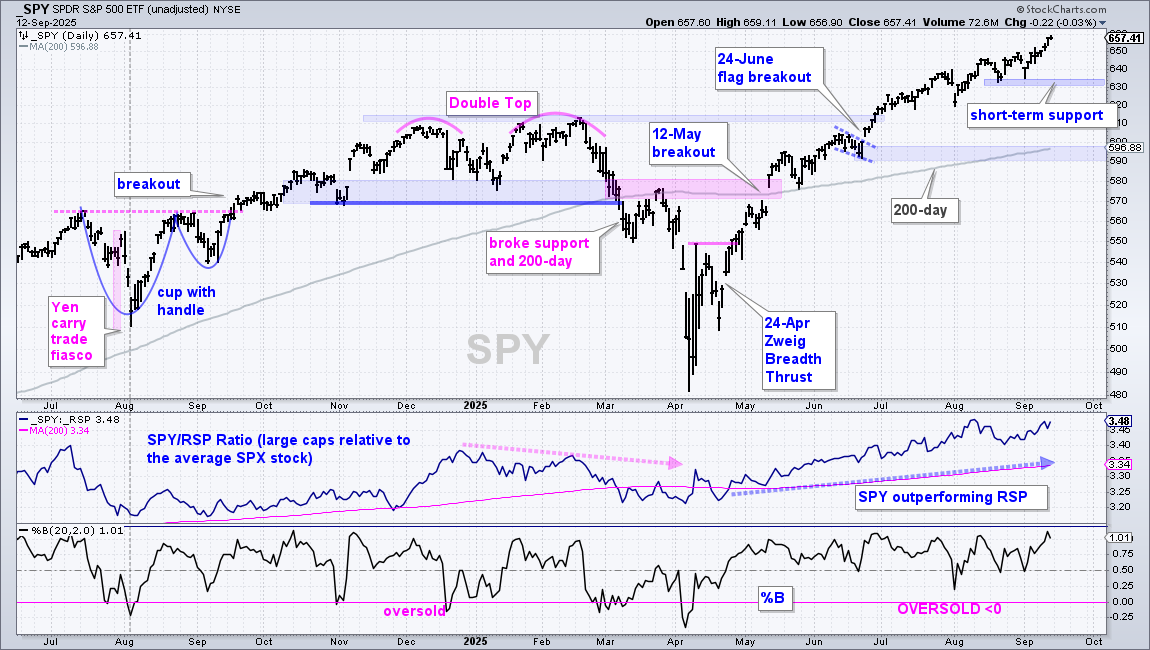
The chart below shows SPY with the Zweig Breadth Thrust on April 24th, the mid May break above the 200-day SMA and the 24-June flag breakout. Since hitting its first new high in late June, SPY continues to work its way higher with shallow pullbacks and quick recoveries. The August lows mark support at 630, which is the first level to watch for signs of a correction.
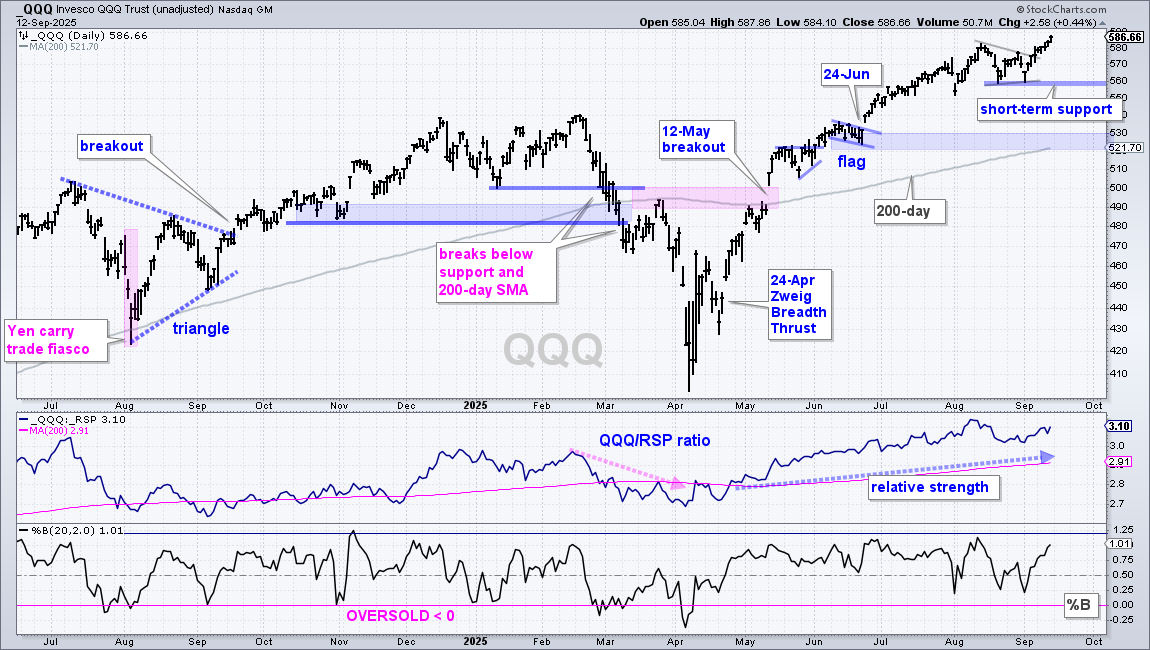
The next chart shows QQQ pushing to new highs in September. The ETF established short-term support at 560 with two lows in late August and early September. A break here would reverse the short-term uptrend and argue for a correction.
High-Low Lines Are Rising
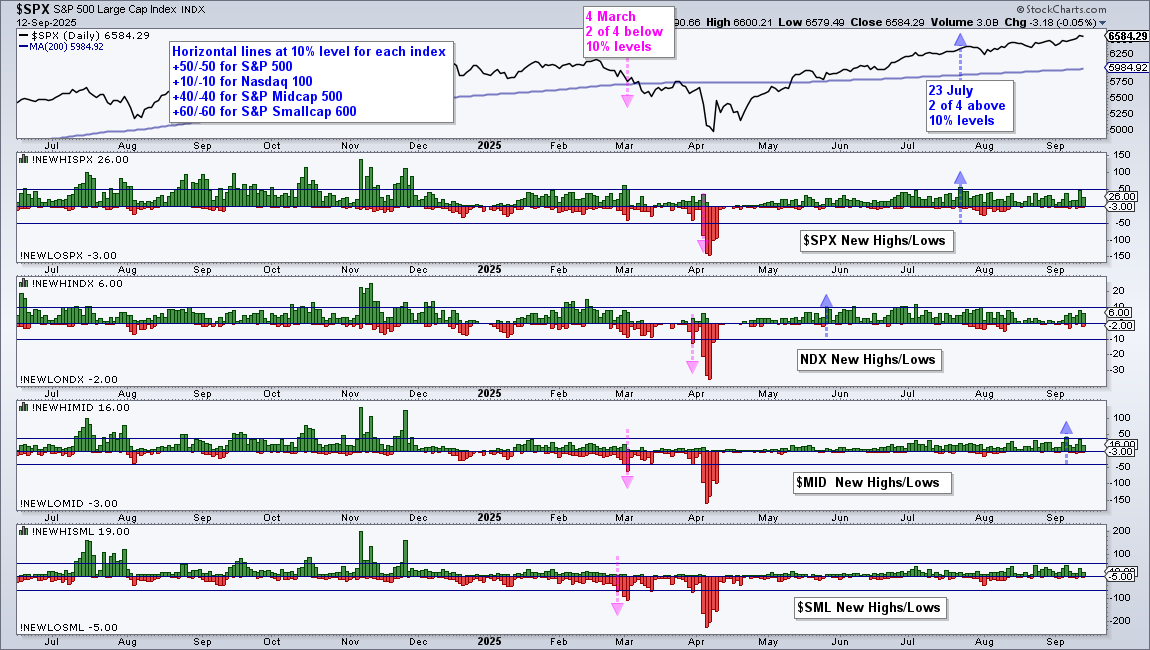
The next chart shows new highs and lows for the S&P 500, Nasdaq 100, S&P MidCap 400 and S&P SmallCap 600. This group turned net bullish on July 23rd when two of the four exceeded their 10% thresholds (blue arrows). As an example, the 10% thresholds for the S&P 500 are +50 and -50. A move above these 10% thresholds shows expanding leadership and this is bullish. This indicator group remains bullish until two of the four move below their -10% thresholds.
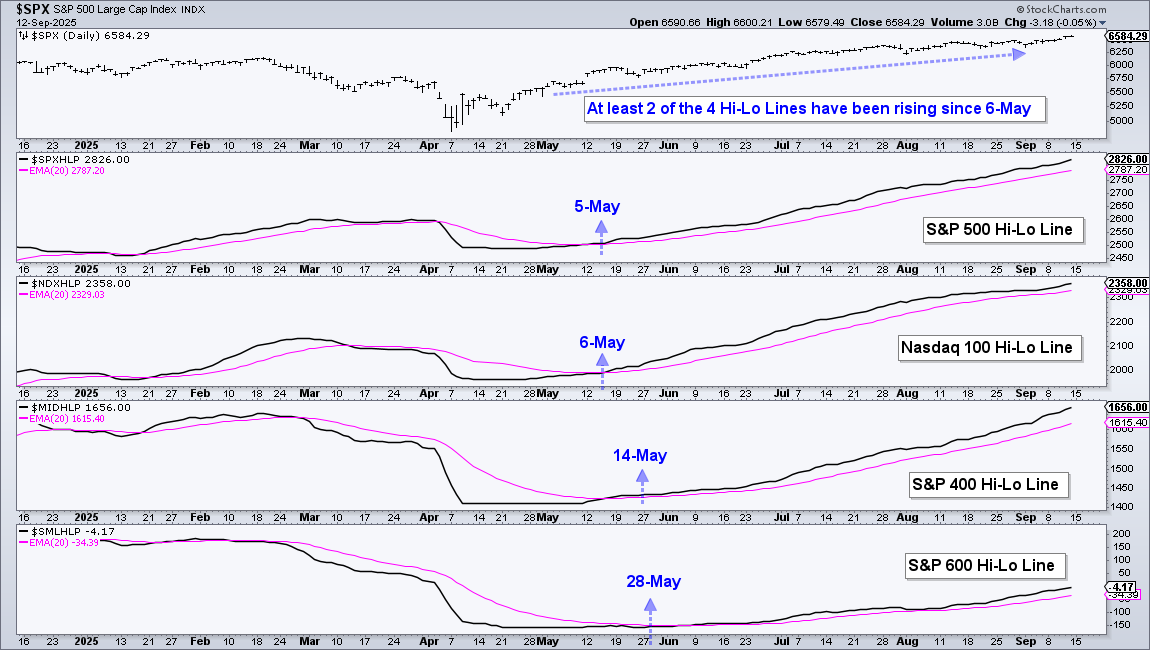
The next chart shows the High-Low Line for these same four indexes. This line is a running total of the difference between 52-week highs and 52-week lows. It rises when new highs outpace new lows and falls when new lows outnumber new highs. While I am unimpressed with the number of new highs, new highs still outnumber new lows and these lines are all rising. The bulls have the edge as long as the High-Low Lines hold above their 20-day EMAs (pink lines).
%Above 50-day SMA
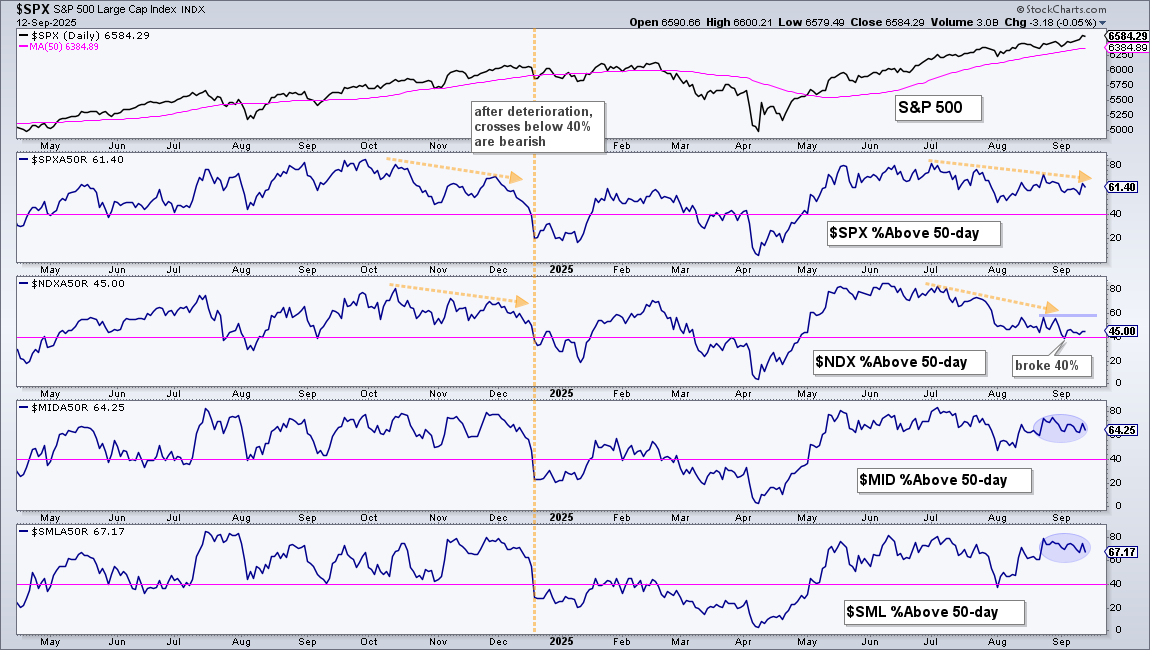
Nasdaq 100 breadth remains weak, S&P 500 breadth is holding up and small/mid cap breadth remains strong. The chart below shows the percentage of stocks above the 50-day SMA for the S&P 500, Nasdaq 100, S&P MidCap 400 and S&P SmallCap 600. NDX %Above 50-day is below 50%, but the other three are above 60%. The deterioration in Nasdaq 100 breadth from July to September is fairly remarkable. It was above 80% in June, it fell to 45% this week, and it even crossed below 40% on September 3rd. This is negative, but the other three are holding up. Moves below 40% in the others would be bearish for the broader market.
Trading Strategies Need Strong Breadth
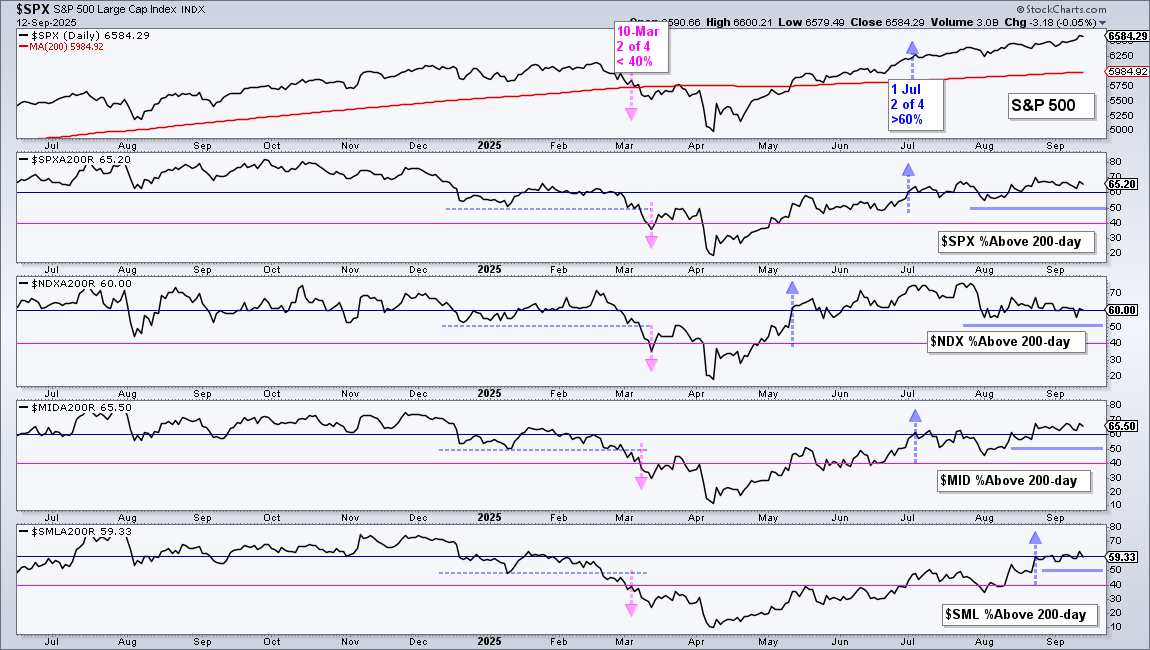
Breadth indicators are important for trading strategies that pick stocks. Our chances of success improve when breadth is strong. For example, we have a higher chance of success when 70+ percent of S&P 500 stocks are above their 200-day SMAs. Chances of success diminish when breadth is mediocre. For example, when 50% of S&P 500 stocks are above their 200-day SMAs. The odds are stacked against us when breadth is weak or when bearish signals trigger. For example, when less than 40% of S&P 500 stocks are above their 200-day SMAs. The chart below shows the percentage of stocks above their 200-day SMAs for the big four indexes. Overall, breadth conditions are good for stock strategies.
SPY and QQQ Sometimes Ignore Breadth
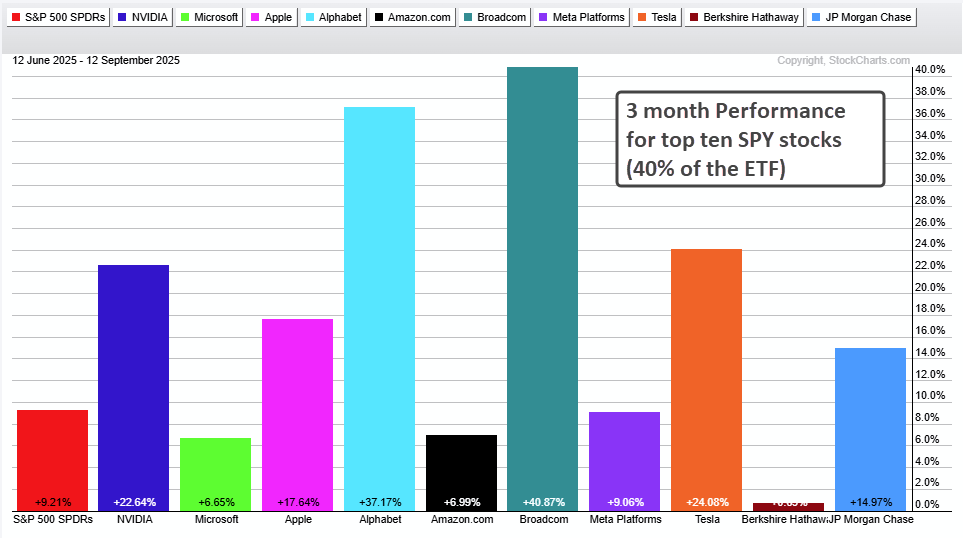
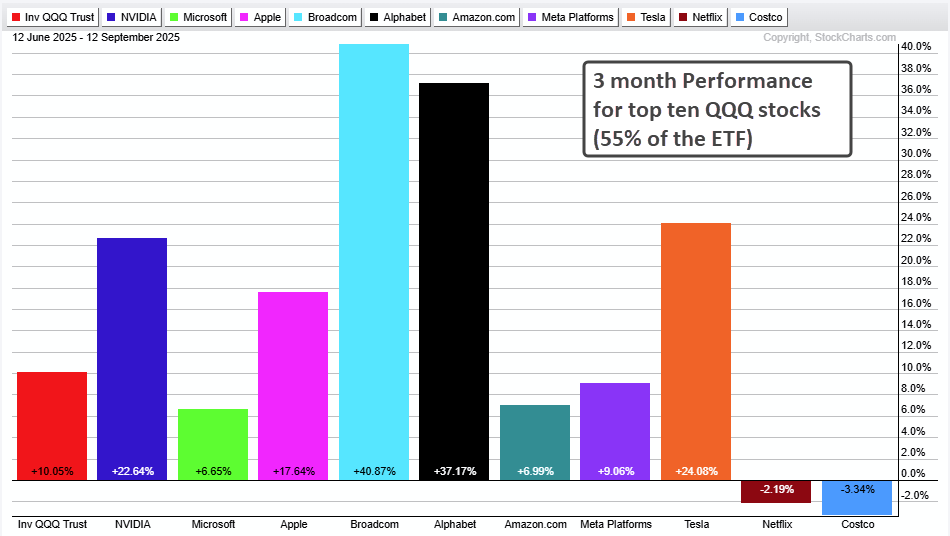
Note that large-caps drive SPY and QQQ, which means breadth indicators can diverge from the price of the underlying. The top ten stocks in the S&P 500 account for around 40%. This leaves the remaining 60% for the other 490 stocks. The top ten stocks in the Nasdaq 100 account for 55%, which leaves the remaining 45% for the other 90 stocks. Outsized gains in the top stocks can offset weakness in the other stocks.
The image below shows 3-month performance for the top ten S&P 500 stocks. Six are up more than 15% and four are up more than 20%. Broadcom is up 40.87% and Alphabet is up 37.17%.
The image below shows 3-month performance for the top ten Nasdaq 100 stocks. Four are up more than 20%.
DISCLAIMER: This content provided strictly for informational and educational purposes. It should not be interpreted as an offer to buy or sell any security, nor as a solicitation to engage in any investment activity. Nothing here constitutes a recommendation regarding any specific security, portfolio, transaction, or investment strategy.
At times, the author or affiliates may hold positions or interests in securities discussed. Any stocks or examples mentioned are not endorsements or suggestions to purchase. This material does not consider your individual financial goals or circumstances, and you should seek guidance from a qualified financial or investment adviser before making any trading or investment decisions.
Past performance does not guarantee future results.
Send feedback to support(at)trendinvestorpro.com or use the contact form.