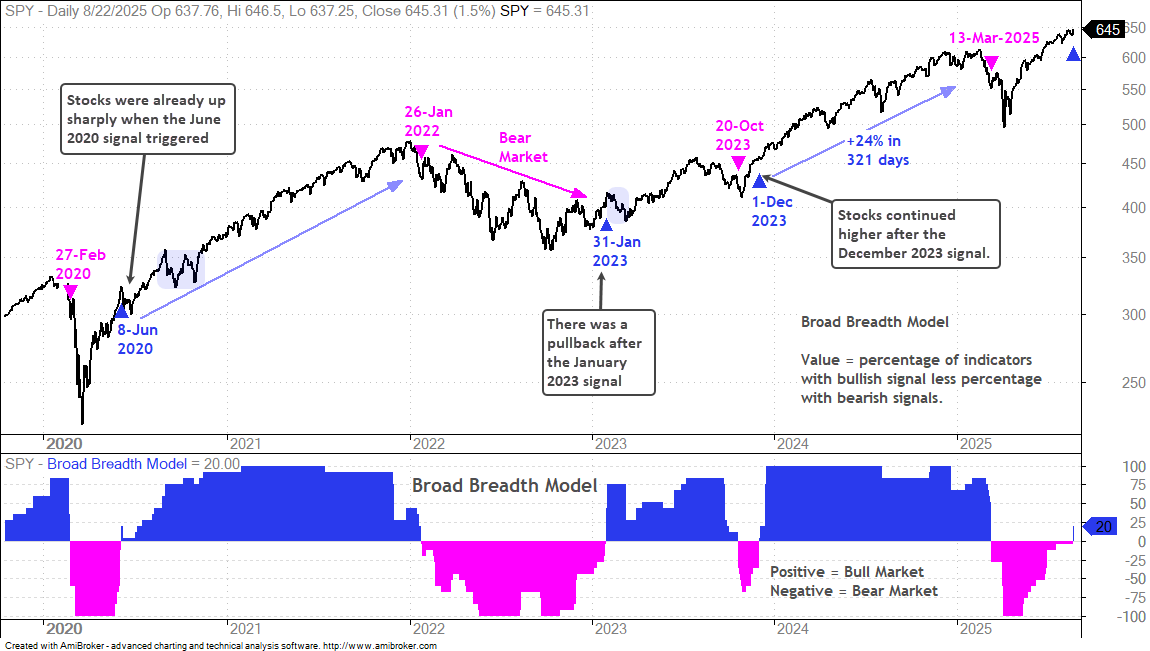
It was a long time coming, but the Broad Breadth Model finally turned bullish as small-caps and mid-caps surged on Friday. These groups were weighing on the S&P 1500 breadth indicators. Not any more. The bullish signal means strength within the market is broadening and the systematic strategies are active.
Now what? Today’s report will look at prior BBM signals and compare these with the current signal. We then turn to the elephant in the room: many of these momentum names sport huge gains already. They also have above average volatility, with works both ways (up and down). Instead of fully embracing momentum, it may be a time to cherry pick names and wait for tradable pullbacks.
Note that I will post a report and video on Monday morning.
Broad Breadth Model Signals
The chart below shows the Broad Breadth Model signals since 2020. There are four bullish signals (blue triangles) over the last five years. I would equate the current signal with the one in June 2020, which also occurred after a V reversal and big advance. After this signal, SPY dipped with a pullback into late June and then zoomed higher into late August 2020. A correction then unfolded as SPY consolidated in September-October (blue shading).
There was a correction after the January 2023 signal as stocks pulled back in February-March (blue shading). The market did not look back after the December 2023 signal as it zoomed higher until April 2024. The December 2023 signal was also ideal because it occurred after a correction into October 2023.
Even though SPY and QQQ appear ripe for corrections, the Broad Breadth Model indicates that upside participation is increasing within the stock market and this is bullish. Traders wary of the current environment can wait for a correction or drawdown.
Huge Move since Early April
With the Broad Breadth Model turning bullish, the S&P 500 and Nasdaq 100 rotation strategies became active. These are momentum-rotation strategies that trade the stocks with the strongest upside momentum and rotate out when their ranking drops. Stocks with the strongest upside momentum are almost always overextended (overbought). Momentum strategies buy high and (hopefully) sell higher.
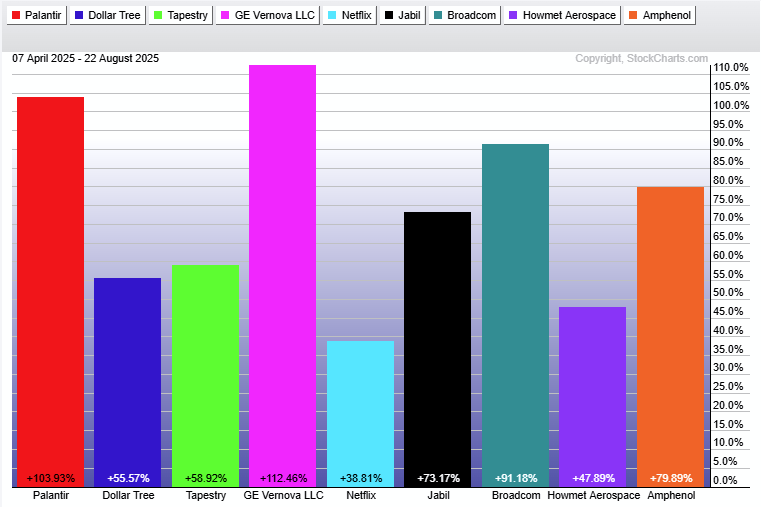
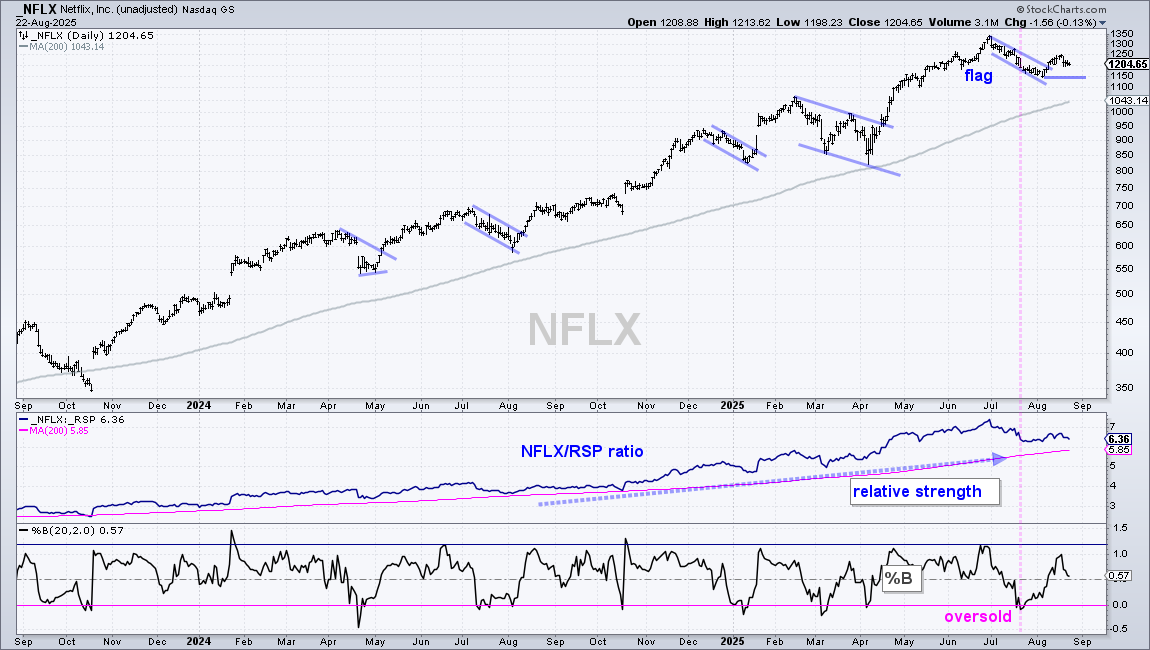
Despite the nature of momentum strategies, I am wary of overbought conditions because the moves from early April to August were HUGE. Many of these stocks are up substantially since April (95 days). Here are the gains for some of the leaders: PLTR (+104%), TPR (+58%), DLTR (+55%), GEV (+112%), NFLX (+38%), JBL (+73%), AVGO +90%), HWM (+48%) and APH (+79%).
Momentum Cuts Both Ways
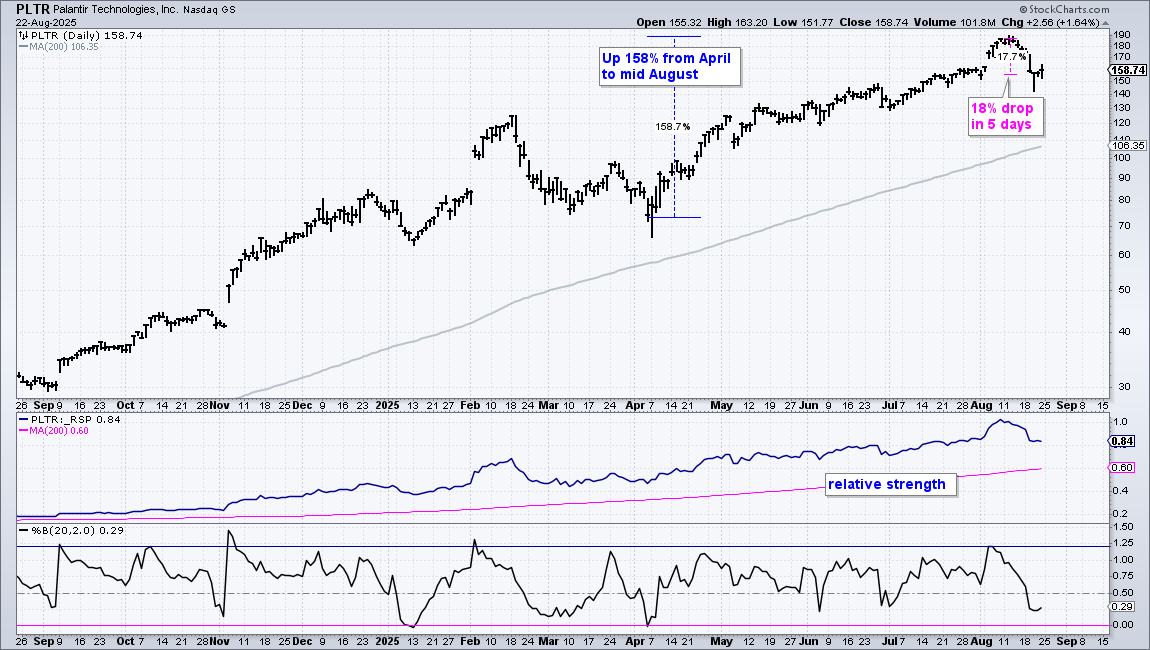
Momentum is a double-edged sword that cuts both ways. Palantir (PLTR), for example, is the current momentum leader. The long-term trend is up with strong momentum, but it fell ~18% from August 12th to August 20th. There is no questioning the uptrend and leadership, but PLTR has above average volatility, which means the swings will be big in both directions.
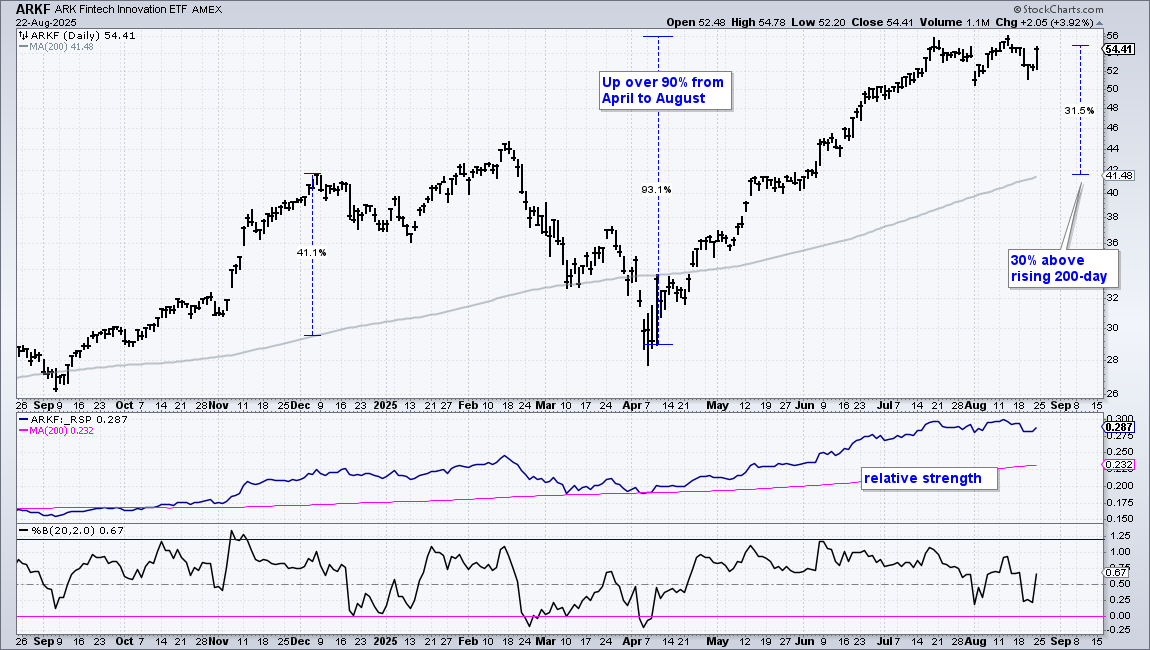
The ARK Fintech Innovation ETF (ARKF) is the momentum leader for the equity ETFs. ARKF advanced over 90% from April to mid July and is currently over 30% above its rising 200-day SMA. There is no questioning the uptrend and leadership, but ARKF has above average volatility, which means the swings will be big in both directions. Ditto for ARKK.
Cherry Picking Among the Leaders
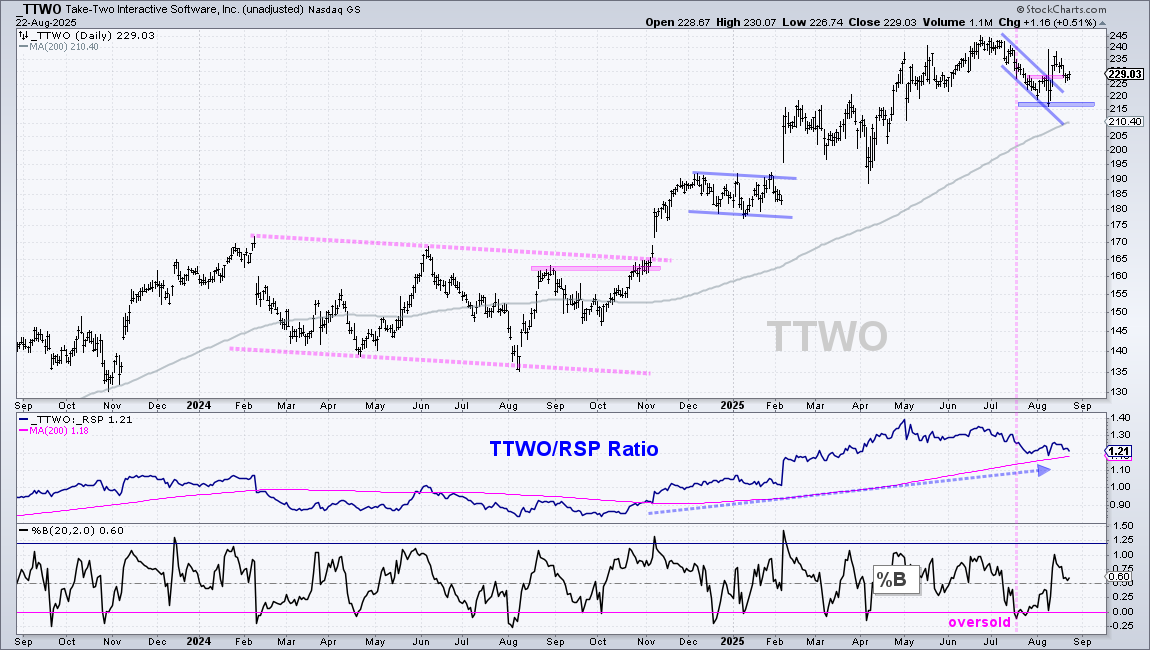
Another strategy would be to cherry pick among the leaders. I am always looking for tradable pullbacks with leading uptrends. Chartists could use the top 100 S&P 500 stocks for the starting watch list. Chart these names with RSI and %B to identify oversold conditions. Analyze the charts for signs of firming, short-term relative strength, a tradable pattern or support level. This is the way I found TTWO and NFLX, which were featured here.
Send feedback to support(at)trendinvestorpro.com or use the contact form.