This report features 10 stock setups. Most are in long-term uptrends and showing relative strength. UBER, for instance, broke out to new highs and is consolidating above these highs. Several oversold setups are also featured because stocks pulled back into early August. CCK fell back to its prior breakout as %B dipped below zero. We will also discuss some nuances with oversold conditions.
These charts extend two years to maintain the long-term perspective. There are price bars with the 200-day SMA in gray. The middle windows shows the price-relative, which measures relative performance using a ratio chart. For example, the AAPL/RSP ratio rises when AAPL outperforms and falls when AAPL under performs. The pink line is the 200-day SMA of the price-relative. The bottom window usually shows a price oscillator, such as %B. This indicator becomes oversold with a move below zero, which means the close is below the lower Bollinger Bands (20,2). In general, I am looking for oversold conditions and pullbacks within leading uptrends.
Crown Castle becomes Oversold after Breakout
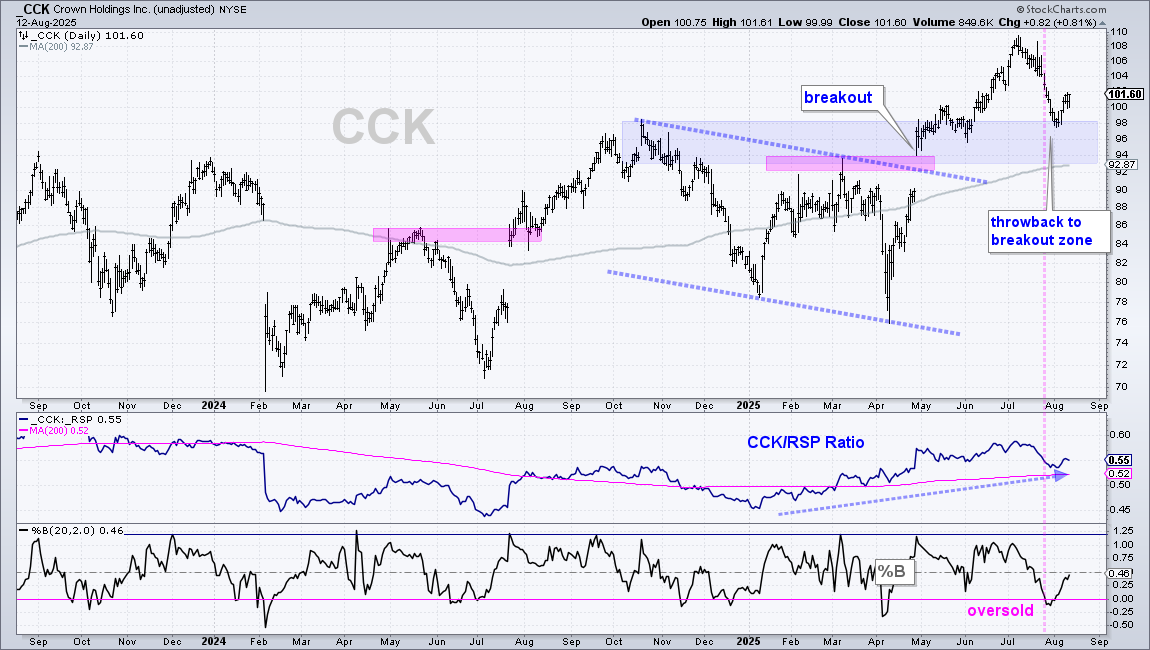
The chart below shows Crown Castle (CCK) with a breakout in April and new highs in May, June and July. After becoming overbought in early July, the stock fell back to the breakout zone, which turns into first support (blue shading). %B also became oversold with a dip below zero (pink dashed line). Notice, however, that CCK did not bottom with the oversold reading. Instead, it continued lower for another week and reached the top of the support zone. This decline back to the breakout zone is a throwback. Throwbacks offer a second chance to partake in the breakout because price is back near the breakout. CCK turned up the last five days to affirm support here. Long-term, the rising 200-day marks support at 93.
Take-Two Breaks Flag Line
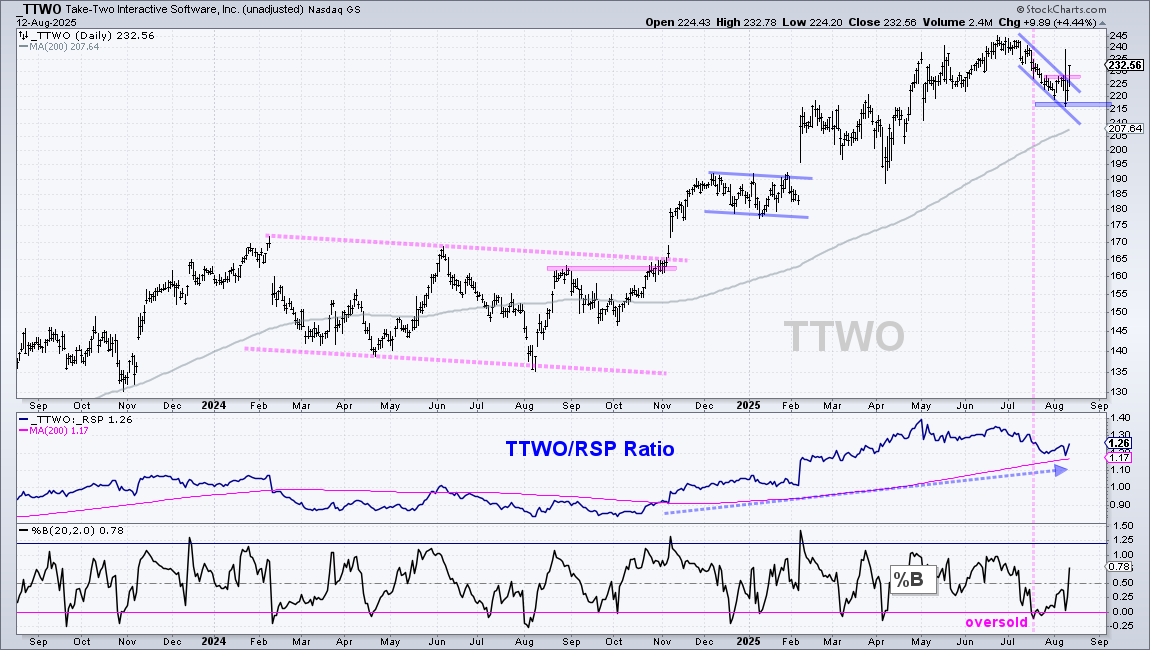
The next chart shows Take-Two (TTWO), which makes video games. The stock broke out in early November and extended higher with new highs throughout 2025. TTWO corrected in July with a decline to the 220 area. %B became oversold early in this decline (pink dashed line) as the stock fell for another three weeks. Sometimes stocks become oversold and remain oversold. TTWO remained on my radar because the long-term trend was up and I viewed the decline back to 220 as a pullback within this uptrend. A falling flag formed and the stock broke out with a surge on Tuesday. Re-evaluation support is set at 215.
Netflix Breaks Flag Line
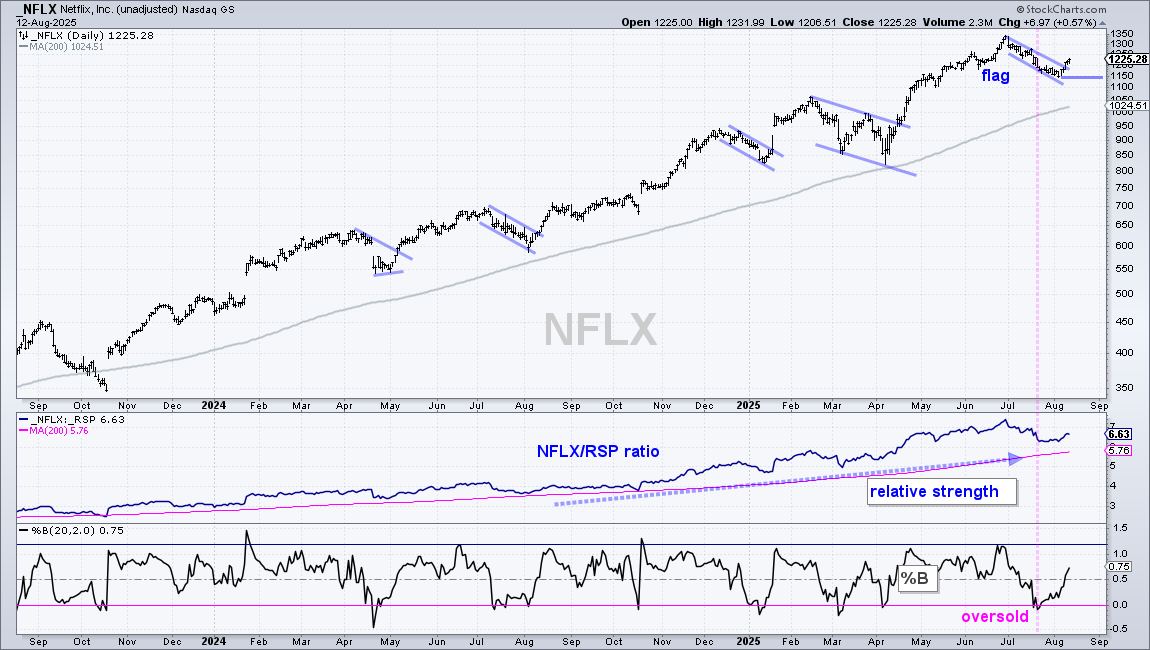
The next chart shows Netflix (NFLX) in beast mode since the gap-breakout in October 2023 (bottom left). Price then rose consistently for almost two years. NFLX even held above the 200-day SMA during the early April rout. Most recently, NFLX advanced from 850 to 1350 (April to June) and then corrected into early August. %B dipped below zero in the middle of this pullback (pink dashed line). A falling flag formed and the stock broke out with a surge the last four days. This signals a continuation of the uptrend with the flag lows mark re-evaluation support.
Uber Consolidates above Breakout Zone
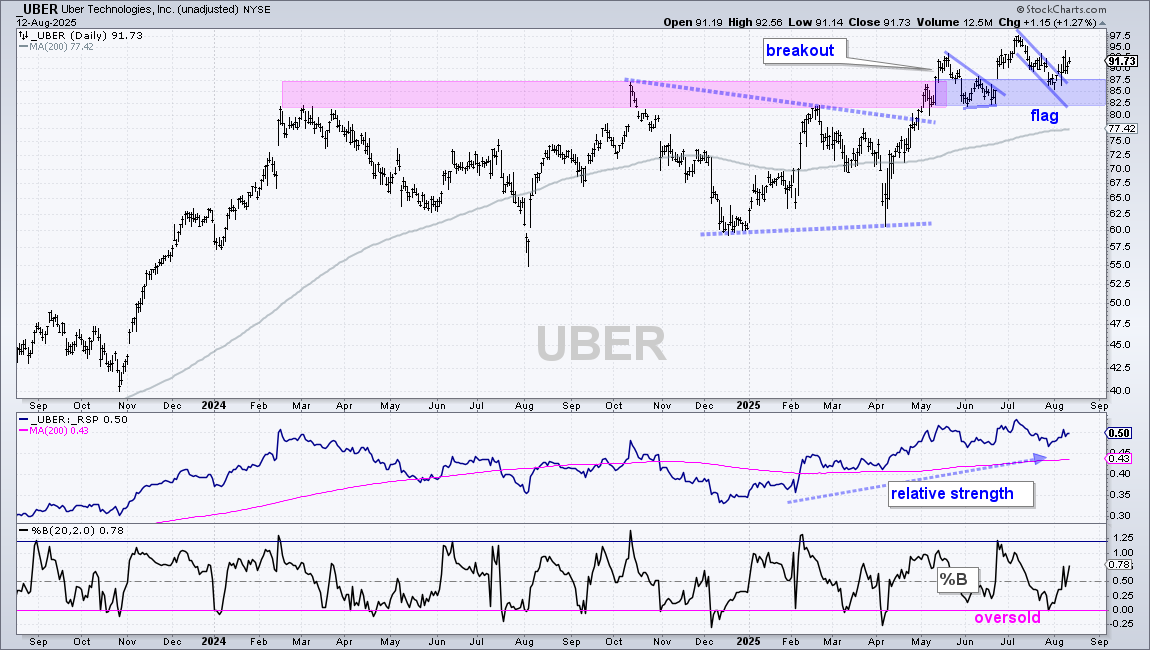
The next chart shows Uber Technologies (UBER) doubling from late October 2023 (40) to mid February 2024 (80). The stock then embarked on a long consolidation as it traded between 60 and 90 the next 15 months. UBER ended this consolidation period with a breakout and new high in May. I view this as bullish. The stock has since consolidated above the breakout zone, which turns into first support (blue shading). Most recently, a falling flag formed and %B tagged the zero line in late July. Thus, we have a short-term bullish continuation pattern, a support zone and an oversold condition. This is a short-term bullish setup. UBER broke out last week. I would stay bullish on the stock as long as it holds the rising 200-day SMA.
AbbVie Outperforms within Healthcare
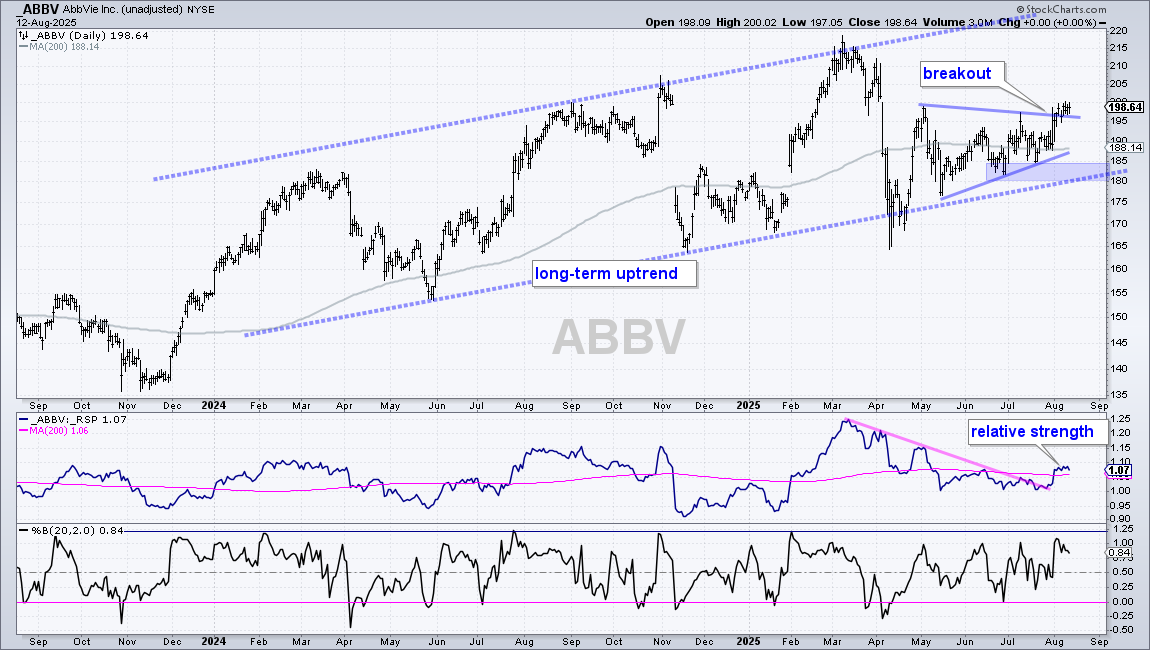
The next chart shows AbbVie (ABBV), which is part of the weakest sector (Healthcare). ABBV is holding up relatively well because it still sports a long-term uptrend (blue dashed lines). Short-term, the stock surged in April and then consolidated with a triangle into July. ABBV broke out with a surge above 195 and I view this as bullish. The blue shading marks re-evaluation support in the 180-185 area.
Cintas Forms Cup-with-handle
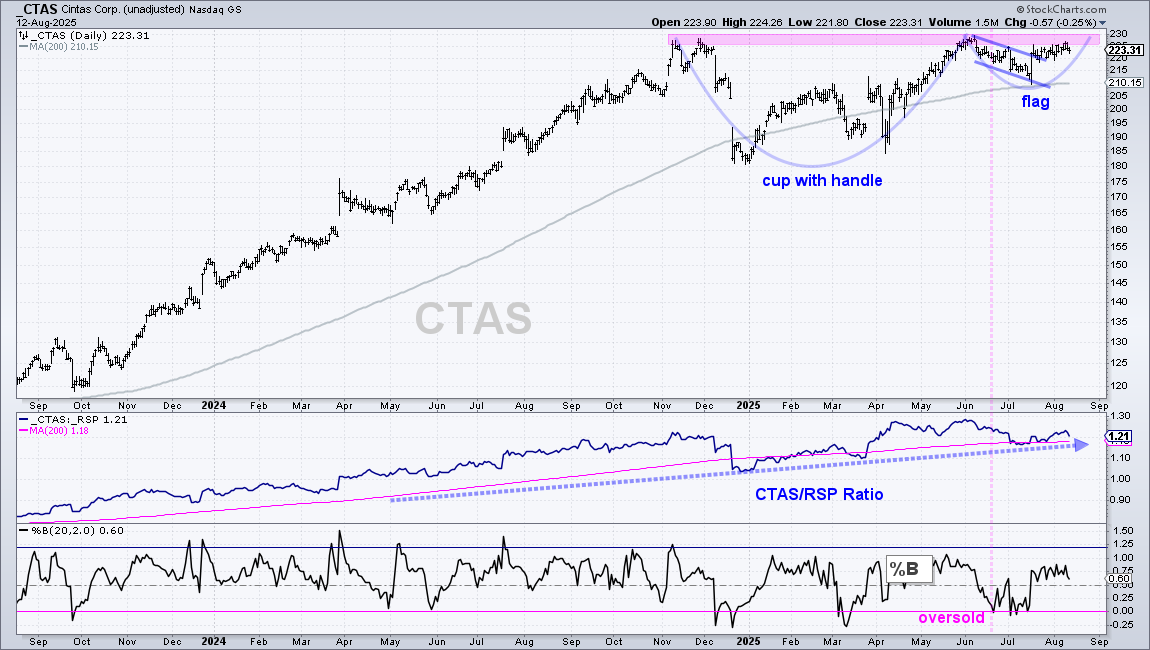
The next chart shows Cintas (CTAS) with a large cup-with-handle taking shape. These are bullish continuation patterns that form within an uptrend. The cup extends from November 2024 to June 2025, the handle is a work in progress and rim resistance is at 230 (pink shading). A break above 230 would record a new high and confirm the pattern. Within the handle, CTAS formed a falling flag and broke the flag line with a surge in mid July. Follow through since this breakout has been tepid, but the breakout is holding and still bullish. A close below the flag low (210) would negate this bullish setup.
Palo Alto becomes Oversold after Plunge
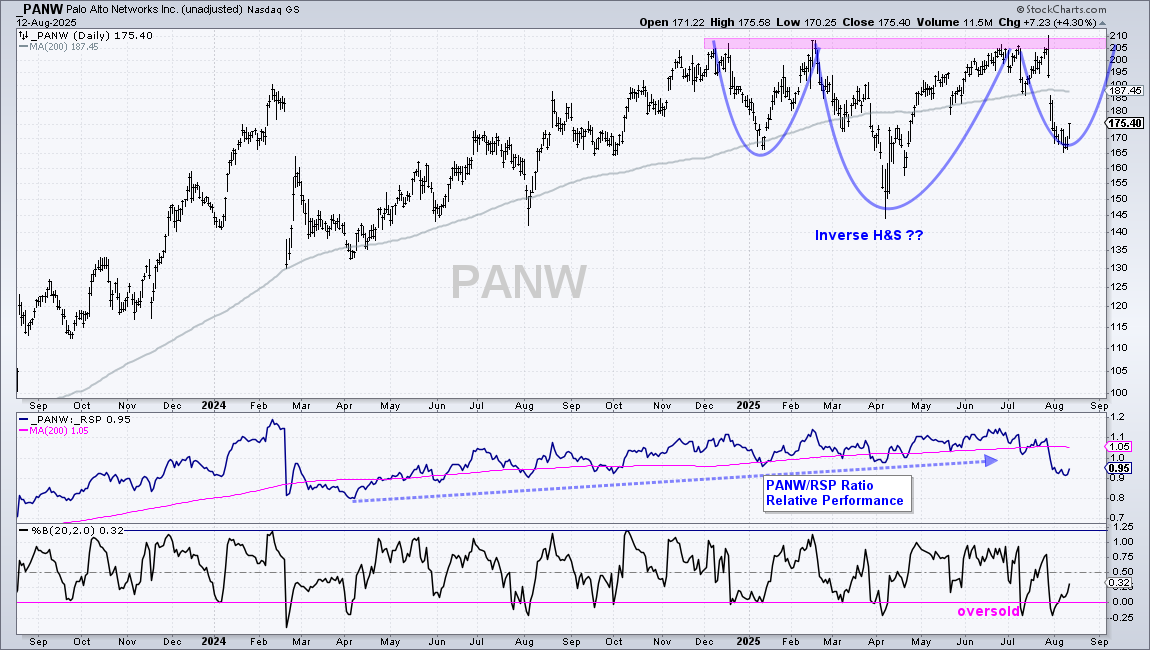
The next chart shows Palo Alto Networks (PANW) hitting resistance in the 205-210 area and plunging to the 170s with a sharp decline. This decline is related to news that Palo Alto plans to merge with CyberArk (CYBR). PANW is no stranger to big declines because it fell sharply in February 2024, and then clawed its way to new highs by the end of the year. Despite the break below the 200-day and multi-month low in the price-relative, an inverse head-and-shoulders is possible (blue lines). The current low is near the January low and the stock is firming in the 165-170 area. A run back to resistance would complete the right shoulder and a breakout at 210 would confirm the pattern.
Apple Gets Volatility Breakout
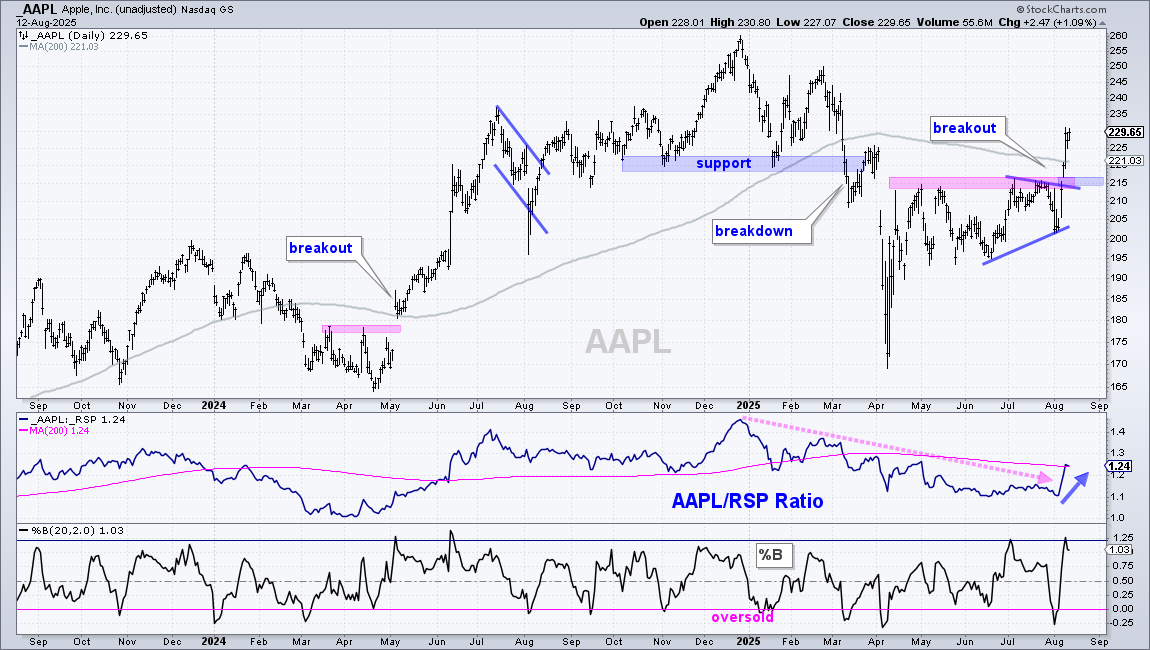
The next chart shows Apple (AAPL) with a breakout surge similar to April-May 2024. The stock surged 12% in April-May and broke above the falling 200-day SMA with a gap. Notice how the stock continued higher after this breakout surge and did not look back. Flash forward to August and we have a breakout with a 14% surge. AAPL also broke the falling 200-day SMA. This breakout reverses the long-term downtrend, which signaled back in March. AAPL could continued to work its way higher or we could see a throwback to the breakout zone around 215. A pullback to the 215-220 area would offer a second chance to partake in the breakout.
Tesla Breaks Out of Triangle
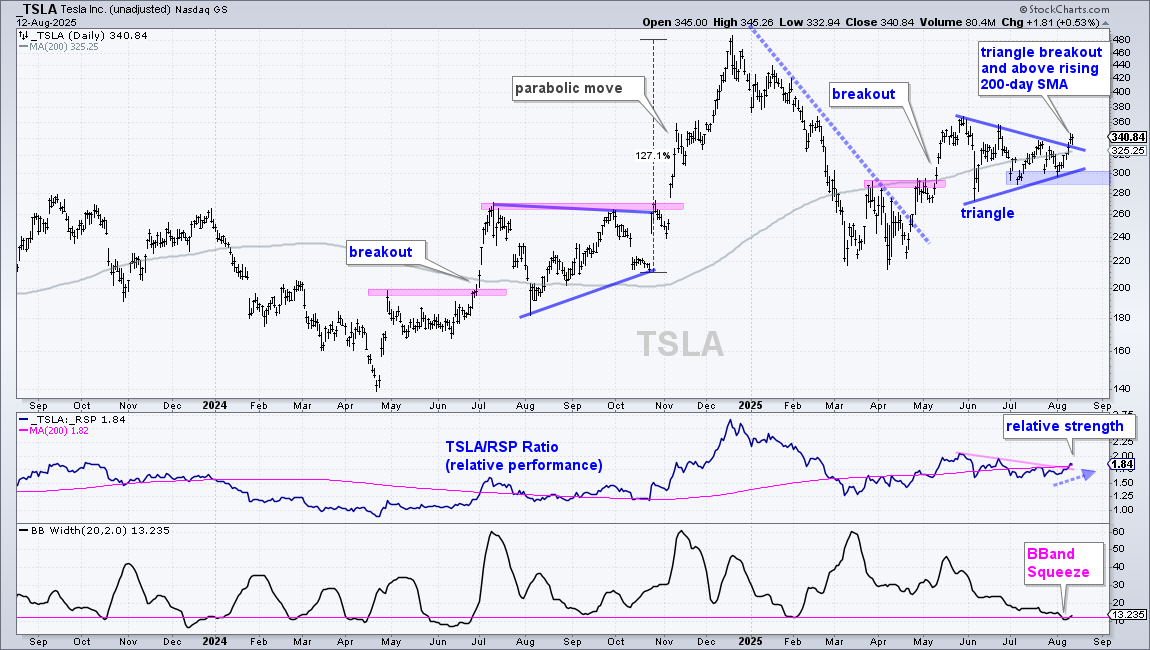
The next chart shows Tesla (TSLA) breaking out of a triangle and moving back above the rising 200-day SMA. Overall, I see more evidence for an uptrend because TSLA broke resistance with a surge in May and the 200-day SMA is rising. After the breakout surge, the stock consolidated with a triangle and Bollinger Bandwidth fell to its lowest level of the year (<12 pink line). This marks a Bollinger Band squeeze or volatility contraction, which could give way to a volatility expansion. Given the triangle breakout and rising 200-day, the expansion should be to the upside. Re-evaluation support is marked in the 290-300 area.
ASML Corrects after Breakout Move
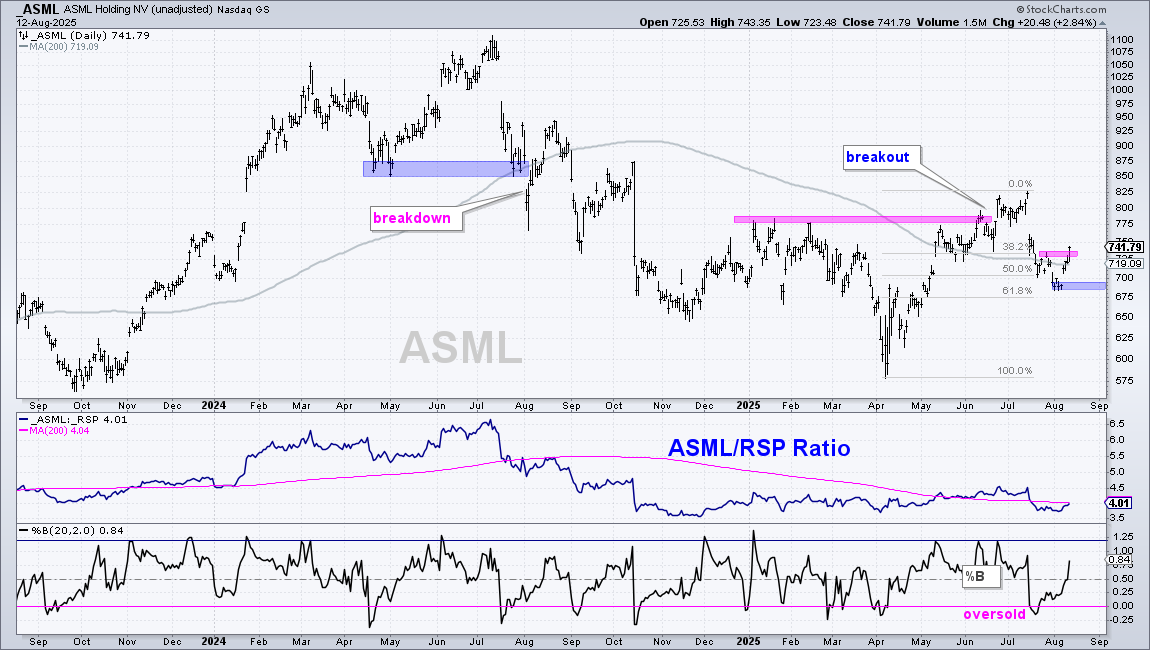
The next chart shows ASML correcting after a breakout move and turning up this week. Long-term, ASML trended lower from July to April 2024. The stock reversed this downtrend with a breakout in June (higher high). ASML became overbought after a move from 575 to 825 and then corrected with a decline below 700. This decline retraced 50-61.8% of the prior advance and the stock firmed in this retracement zone. ASML broke short-term resistance with a surge this week and this signals an end to the correction. This move also put the stock back above its 200-day SMA. The August lows mark re-evaluation support.
Send feedback to support(at)trendinvestorpro.com or use the contact form.