The stock market remains in risk-on mode, but the bull run is selective. SPY and QQQ tagged new highs in mid August. Even though mid-caps and small-caps surged last week, IJH and IJR remain well below their November highs and continue to lag large-caps. The new high list shows leadership concentrated in the Technology and Communication Services sectors. Narrow leadership means this is a stock pickers market, as opposed to a bull market that lifts all boats. Overall, stocks look ripe for a correction after the big gains from early April to mid August. Timing a correction, however, is a different matter. The trading bias remains bullish for stocks. This means pullbacks are opportunities to trade within the bigger uptrend.
New High List Heavy in Tech and AI
Here is a list of some ETFs that hit new highs within the last five days.
S&P 500 SPDR (SPY)
Nasdaq 100 ETF (QQQ)
S&P 500 High Beta ETF (SPHB)
S&P 500 Momentum ETF (MTUM)
Technology SPDR (XLK)
Communication Services SPDR (XLC)
Global AI & Tech ETF (AIQ)
Robotics Automation ETF (ROBO)
ARK Fintech Innovation ETF (ARKF)
Semiconductor ETF (SMH)
Semiconductor ETF (SOXX)
Retail SPDR (XRT)
Infrastructure ETF (IFRA)
Metals & Mining SPDR (XME)
Silver Miners ETF (SIL)
SPY and QQQ Lead with New Highs
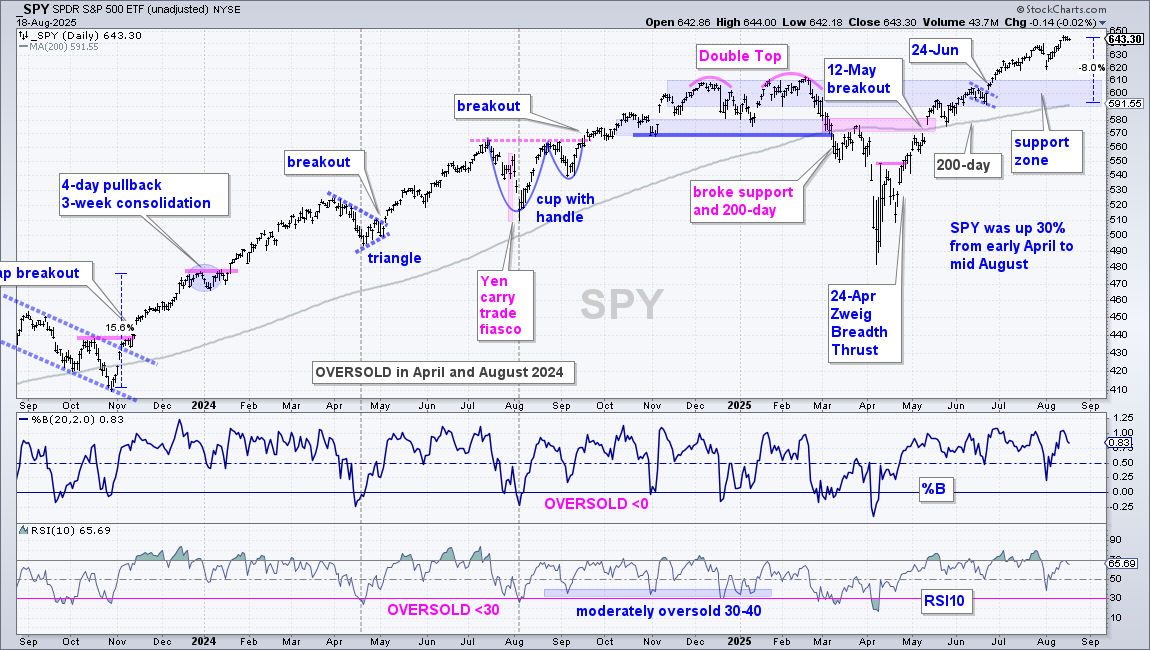
The S&P 500 SPDR (SPY) remains in an uptrend since the gap and breakout on May 12th. SPY surged off the early April low with a steep advance. This move slowed after the gap-breakout on May 12th, but the trajectory (trend) is clearly up with a new high in mid August. On a closing basis, SPY advanced some 30% from early April to mid August. Even though the ETF seems ripe for a corrective period, overbought conditions do not guarantee a correction. Should SPY correct, I would mark support in the 590-610 area, which would entail a 5-8 percent pullback. Support here stems from broken resistance, the June low and the rising 200-day SMA.
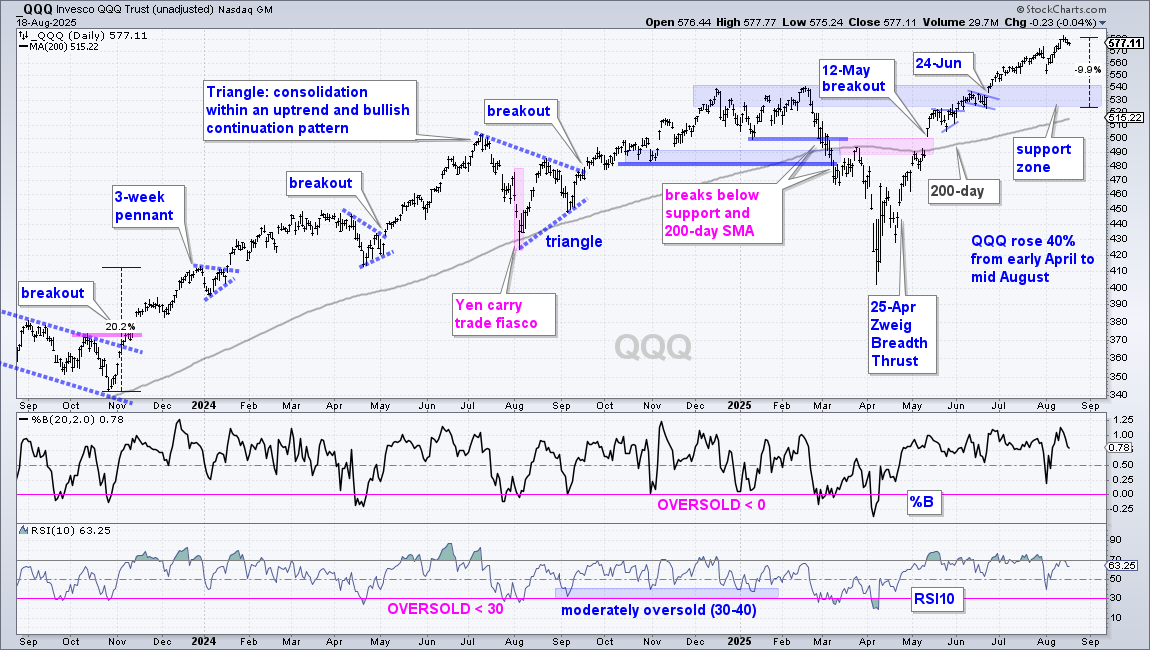
The next chart shows QQQ with similar characteristics. I am marking support in the 525-540 area (blue shading). A correction to this area would mark a 7-10 percent pullback.
93 Days Since Last Oversold Condition
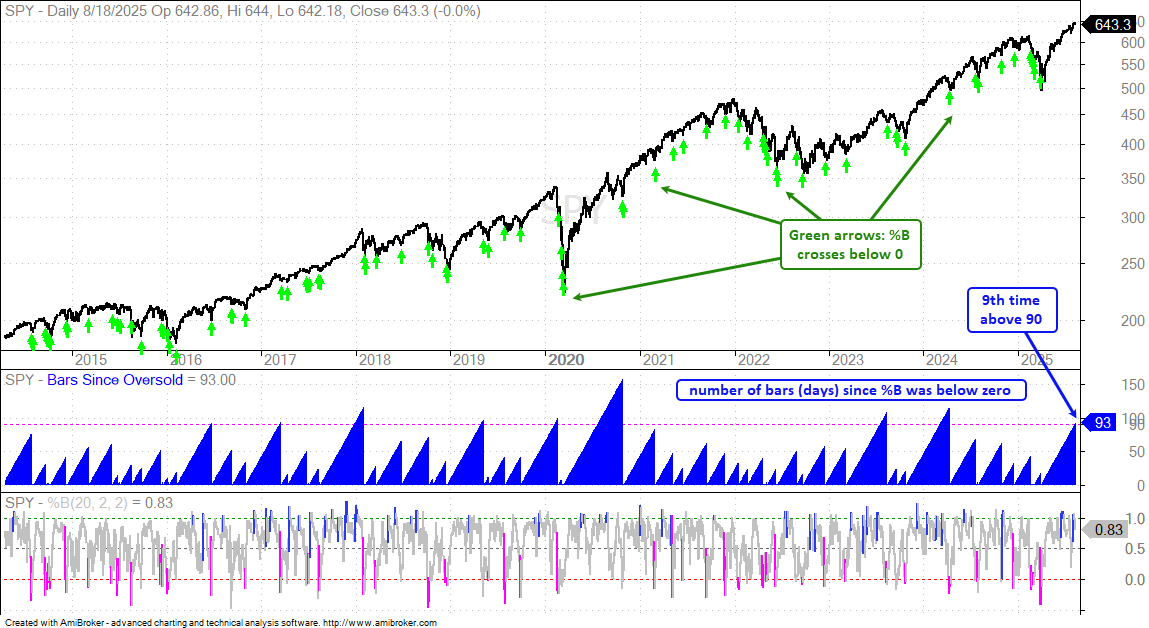
The chart below shows %B(20,2) in the lower window and the number of bars (days) since %B was below zero in the middle window. The green arrows on the SPY price chart show when %B crossed below zero to signal an oversold condition. This means the close was below the lower Bollinger Band (not shown). It has been 93 days since %B was below zero, the last oversold condition. The pink line is at 90 and this is the ninth time above 90 (since 2014). 90+ days without an oversold condition is a long stretch. This stretch extended to 150 days in October 2020, but most stretches ended after nearing the 100 day mark (90 to 110 days).
Mid and Small Caps Still Lagging
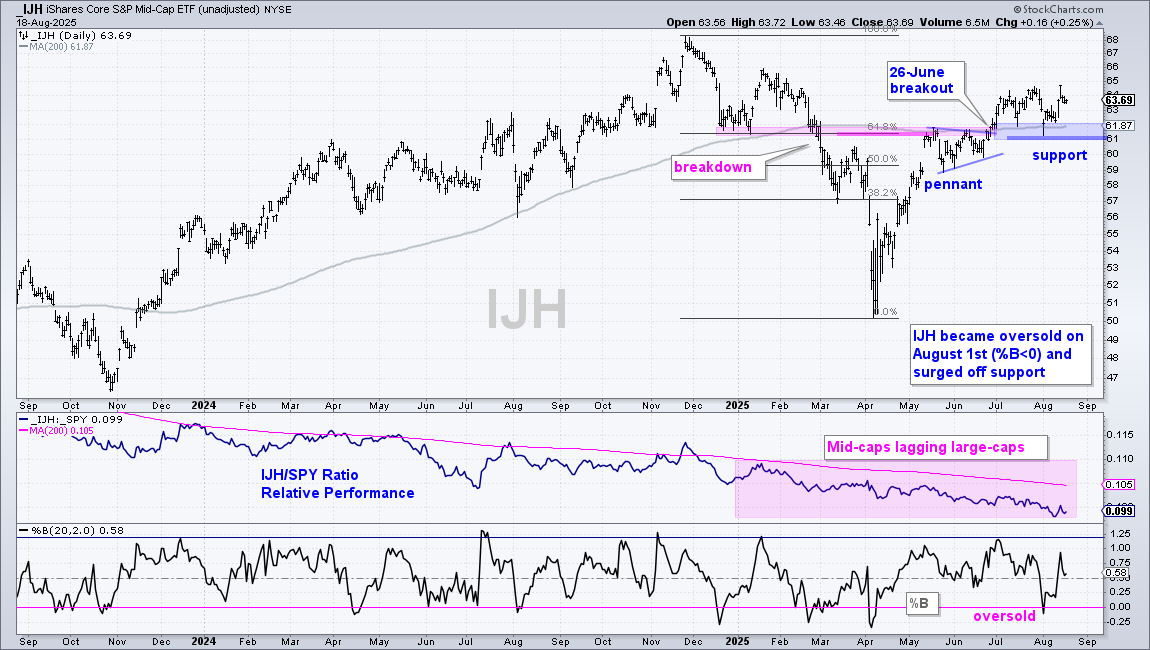
The S&P MidCap 400 ETF (IJH) is in an uptrend since the breakout on June 26th, which is when the ETF broke the 200-day SMA and mid May high. IJH stalled after this breakout, but the breakout is holding and remains bullish until proven otherwise. With lows in mid July and early August, the ETF established support in the 61-62 area (blue shading). The 200-day SMA is currently at 61.87. Also note that IJH surged 3.8% on August 12th and 13th. This is a strong move that should hold. Failure to hold this surge and support break at 61 would be bearish. The middle window shows the IJH/SPY ratio trending lower throughout 2025, which means mid-caps are lagging large-caps.
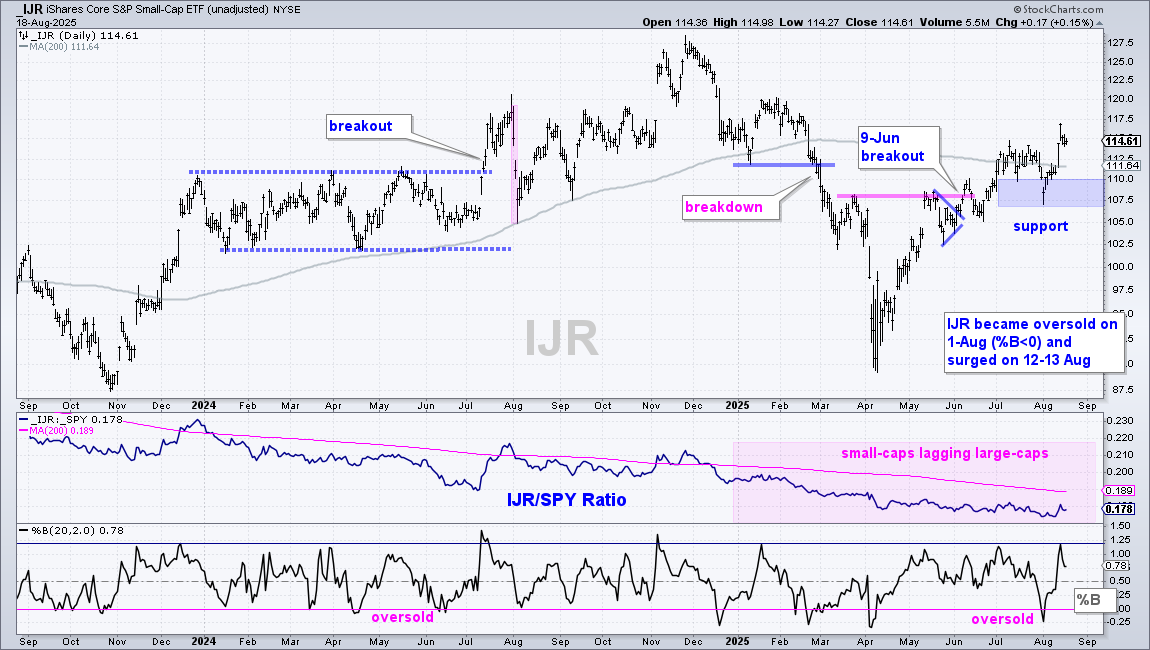
The S&P SmallCap 600 SPDR (IJR) is in an uptrend since the breakout on June 9th. Price action since this breakout has been choppy, but the ETF continues to work its way higher. Most recently, IJR became oversold on August 1st as it gapped below 110 and %B dipped below zero. The ETF immediately recovered with a surge above the July high. It is important that this surge holds because it reinforces support in the 107-110 area. A break below 107 would reverse the upswing. The middle window shows the IJR/SPY ratio moving lower throughout 2025, which means small-caps are lagging large-caps.
Mediocre Breadth (%Above 200, High-Low Percent)
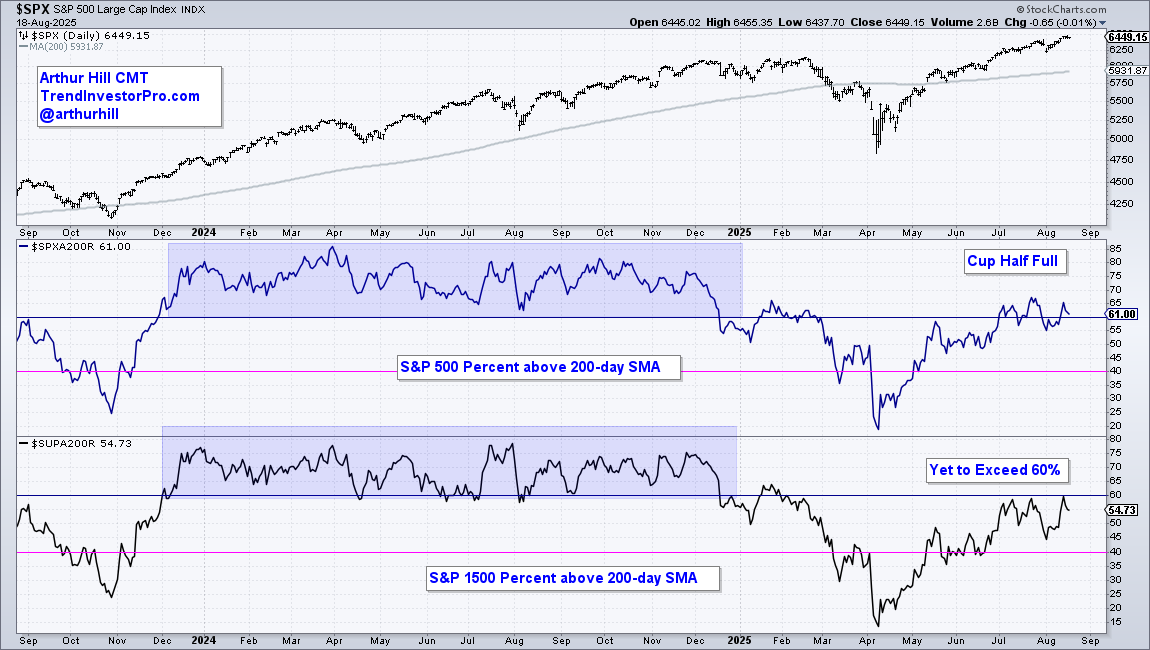
The breadth cup remains half full with S&P 500 stocks doing the heavy lifting. The chart below shows the percentage of stocks above the 200-day SMA for the S&P 500 in the middle window and S&P 1500 in the lower window. 2024 marked the glory days when these indicators were above 60% most of the time (blue shading). SPX %Above 200-day SMA made it back above 60% on July 1st and has since oscillated around this level (cup half full). S&P 1500 %Above 200-day SMA has yet to breach the 60% level, although it came close a few times. It is currently at 55%, which means 45% of S&P 1500 stocks are below their 200-day SMAs. A break above 60% would show broadening strength and this would be bullish for stocks, especially mid-caps and small-caps.
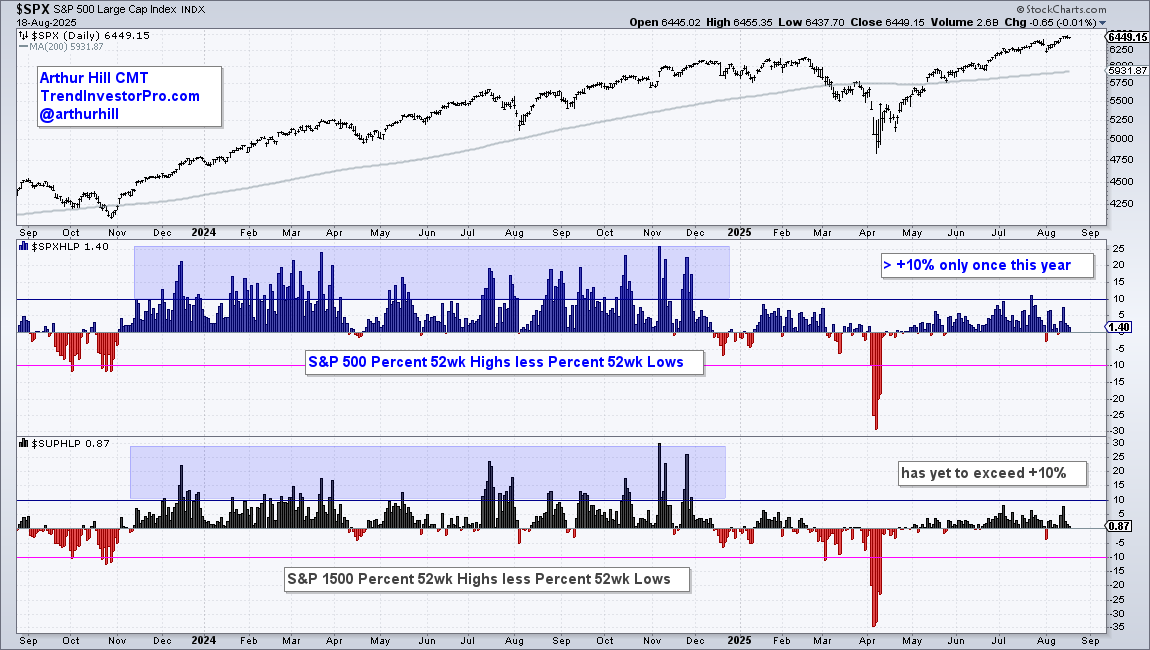
The next chart shows High-Low Percent for the S&P 500 and S&P 1500. High-Low Percent is the percentage of new 52-week highs less the percentage of new 52-week lows. Again, the blue shading shows the glory days of 2024 when High-Low Percent regular exceeded +10%. The surge off the April lows was strong, but High-Low Percent is still dragging its feet. SPX High-Low Percent exceeded +10% only once and S&P 1500 High-Low Percent has yet to exceed +10%. This means upside leadership is relatively narrow (a few stocks leading the market). This is not a broad bull market that lifts most boats. It is a selective bull market.
Yield Spreads remain Narrow (no Stress)
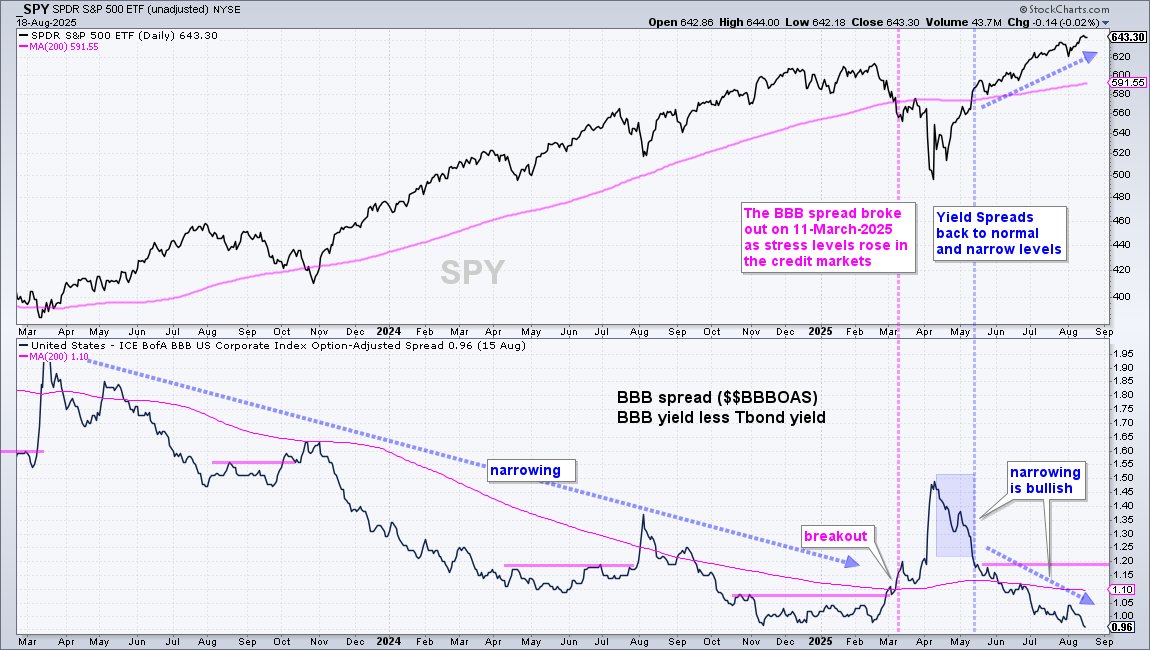
The next chart shows the Junk and BBB yield spreads. The BBB spread is the difference between the BBB corporate bond yield and a comparable US Treasury yield. BBB bonds are the lowest rated investment grade corporate bonds (the risk asset). US Treasuries represent the safe haven asset. In the lower window, the BBB spread is .96, which means BBB bonds yield .96% more than US Treasuries. This is a very narrow spread that shows confidence in the credit market. This spread has been narrowing since early April and this narrowing is positive for stocks.
Send feedback to support(at)trendinvestorpro.com or use the contact form.