Systematic Strategies and Next Level Technical Analysis
Comparing 2020 with 2025 – Tech ETFs Extended – KRE Support – GLD Gets Quiet
Arthur Hill, CMT
Archive
Use CRTL+P to Print
Headlines
Comparing Now to March-August 2020 (XLK)
Leading and Extended: XLK, MAGS, AIQ, SMH
Semiconductor ETF Gets Flag Breakout (SOXX)
Cybersecurity ETF Corrects (plus CRWD)
Regional Bank ETF Holds Upswing as KBWB Leads
Gold SPDR Gets Very Quiet
Tech ETFs Ripe for a Correction
Today’s report starts by comparing the current March-August sequence with the March-August period in 2020. History does not repeat itself, but it sometimes rhymes. We then turn to four tech-related ETF that are very extended and ripe for a correction. The Regional Bank ETF helped small-caps last week and it is important that KRE holds its surge. We close with the Gold SPDR, which turned real quiet the last six days.
Comparing 2020 and 2025
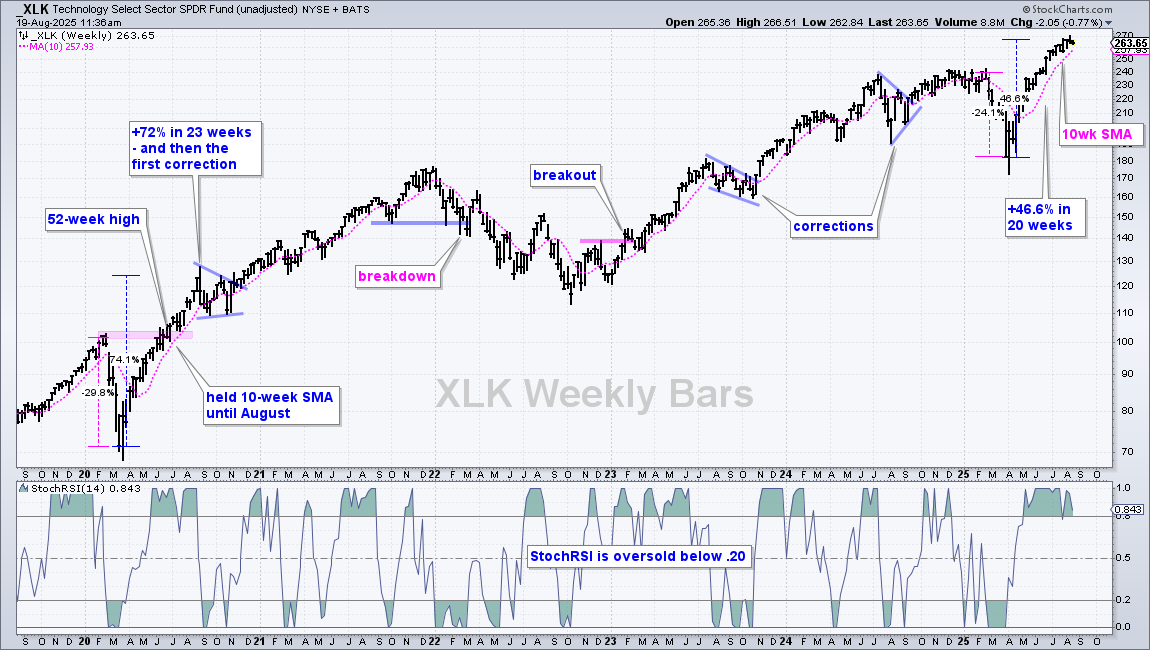
The current plunge-surge sequence is comparable to the March-August 2020 period. XLK fell 30% into March 2020 and then surged 74% into August 2020 (23 weeks). XLK hit a new high in June, continued higher and did not correct until August, two months after first hitting a new high. Notice that the 10-week SMA (pink line) captured this steep surge as it held from April to August. The close below the 10-week SMA signaled the start of the correction, which formed a triangle into October.
The current situation shows a 24% plunge into April and a 46.6% surge into mid August (20 weeks). XLK hit its first new high in late June, which was seven week’s ago. XLK has held the 10-week SMA since the advance started. As with SPY and QQQ, XLK is extended and ripe for a correction, which would be healthy. A close below the 10-week SMA could foreshadow a correction.
The indicator window shows StochRSI(14), which is the Stochastic Oscillator applied to RSI. It measures the momentum of momentum and signals oversold when below .20.
Leading and Extended: XLK, MAGS, AIQ, SMH
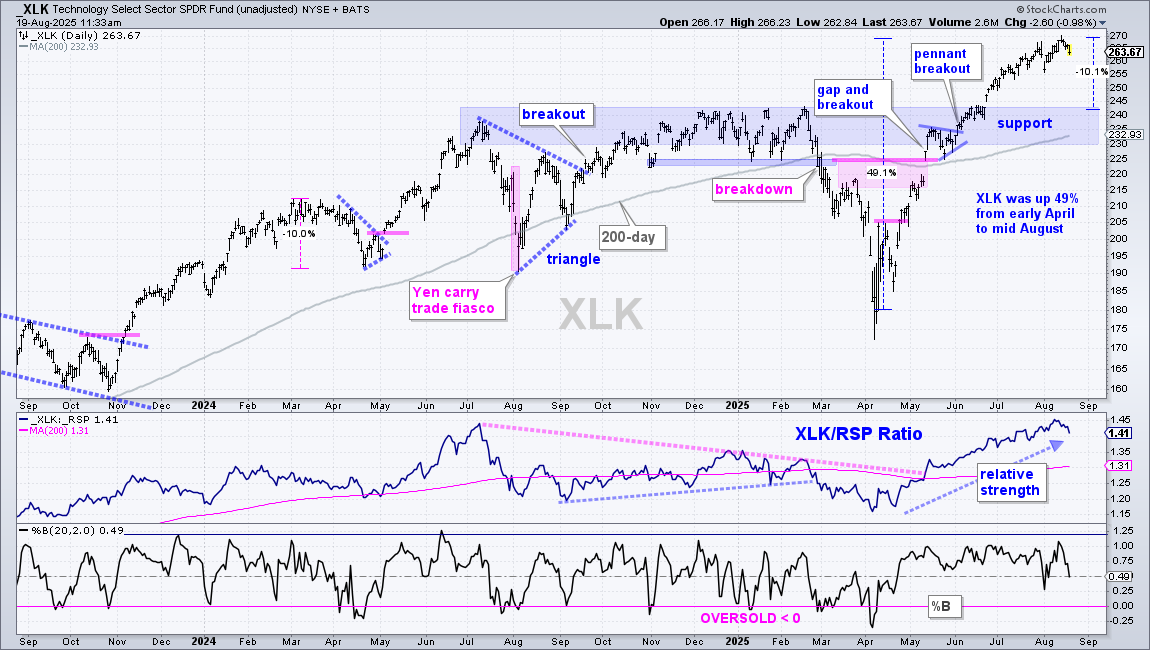
The Technology SPDR (XLK) is a clear leader with the mid May gap/breakout and a string of new highs since late June. XLK hit a fresh new high last week and price is well above the rising 200-day SMA.
Despite a strong uptrend and relative strength, XLK is looking extended over the short and medium term. Note that XLK rose 49% from early April to mid August, which includes a 20% advance from late June to mid August. These are big moves in a relatively short periods of time. Time to rest.
Corrections or pullbacks are never certain and they are extremely difficult to time. Traders holding XLK or buying XLK at current levels must, however, consider the possibility. Note that XLK could fall 10% to the 240s and still be in a strong uptrend. The blue shading marks a support zone based on prior resistance and the rising 200-day SMA.
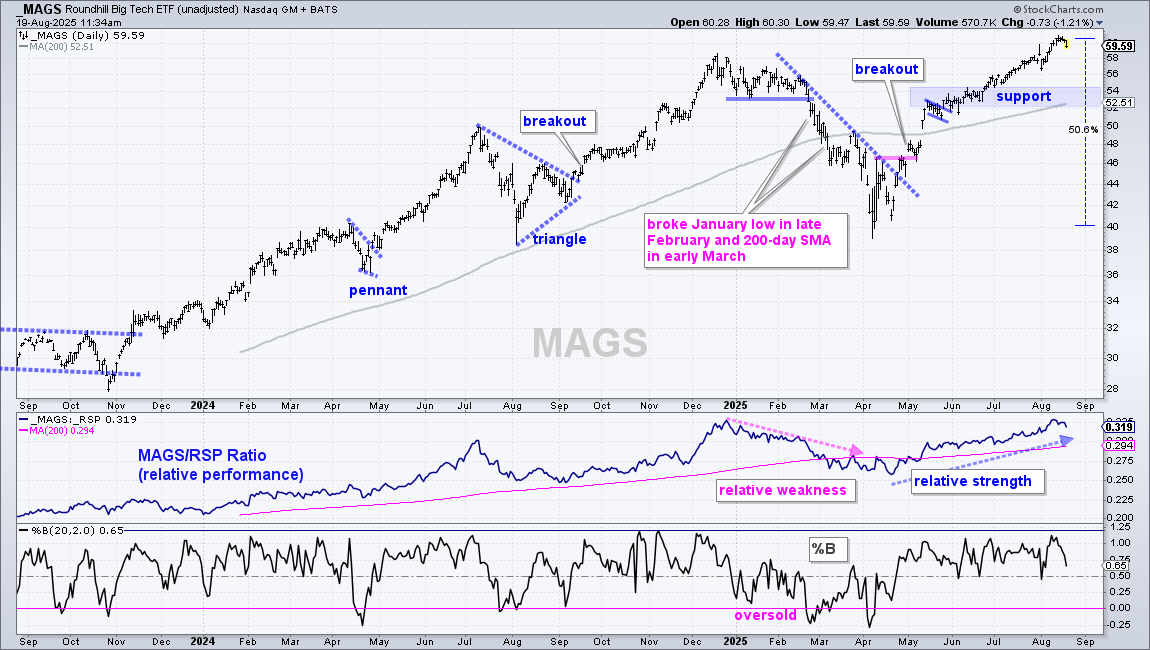
The next chart shows the Mag7 ETF (MAGS) with a 50% advance from early April to mid August. Support is set in the 52-54 area (blue shading).
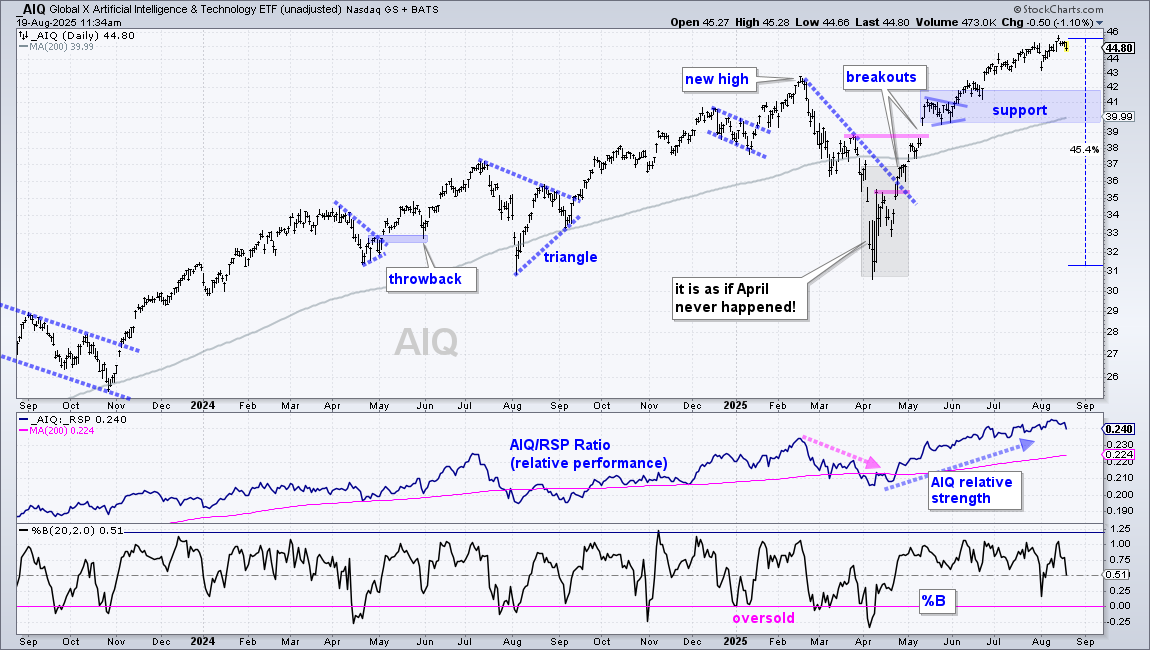
The next chart shows the Global AI & Tech ETF (AIQ) with a 45% advance and support in the 40-42 area.
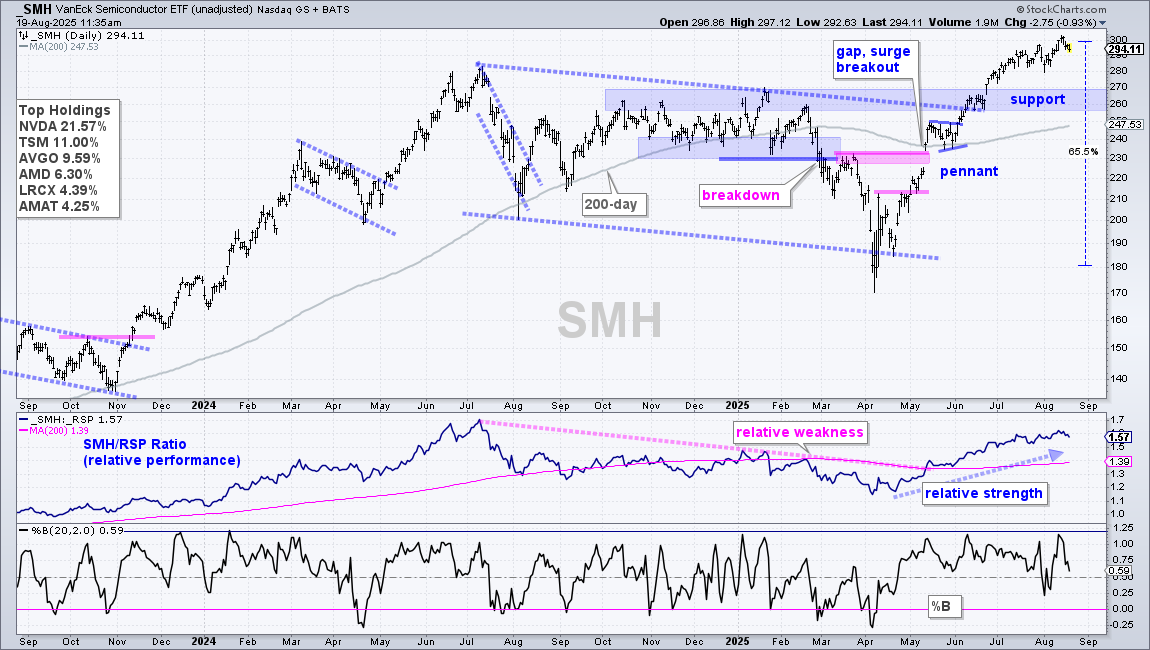
The next chart shows the Semiconductor ETF (SMH) with a 65% advance and support marked in the 260-270 area.
SOXX with Flag Breakout
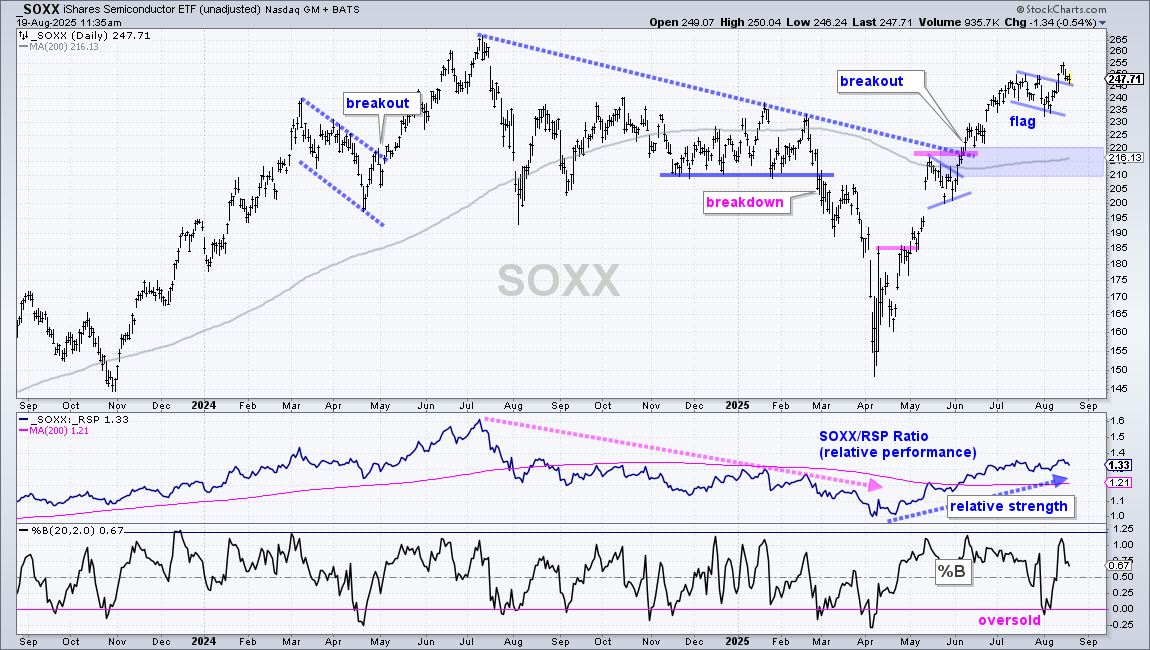
The next chart shows the Semiconductor ETF (SOXX) with a flag breakout working. Keep in mind that SOXX is part of the tech sector and could come under pressure should XLK correct. SOXX reversed its downtrend with a breakout in early June. This is when it broke the July 2024 trendline, the mid May high and 200-day SMA. The breakout zone and 200-day SMA turn support in the 210-220 area.
Short-term, SOXX consolidated with a flag from mid July to early August. The ETF became oversold on August 1st as %B dipped below zero and then surged above the flag line last week. This flag breakout signals a continuation of the June-July advance. A close below 235 would negate the flag breakout, but this would not affect the long-term uptrend. Instead, such a decline would probably be part of a bigger correction and lead to the next setup.
CIBR Corrects (plus CRWD)
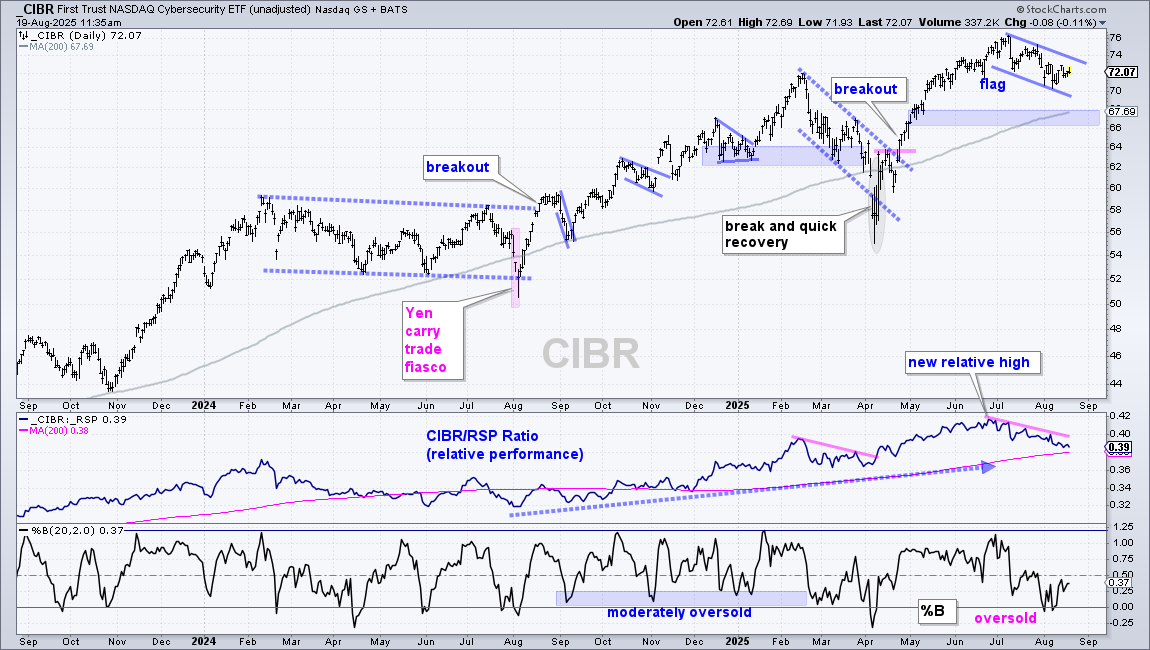
The next chart shows the Cybersecurity ETF (CIBR) with a new high in early July and a flag correction underway. Corrections are sometimes short (a few weeks) or long (several weeks or even months). There were short pullbacks in September, October and December 2024 (solid lines), and long corrections from February to August 2024 and from February to April 2025 (dashed lines).
The current pullback is 28 days (six weeks) and %B became oversold with two dips below zero. Pullbacks and oversold conditions within uptrends are opportunities. A breakout at 74 would break the flag line and signal a continuation higher. Note that CIBR is also part of the tech sector and could come under pressure should XLK correct.
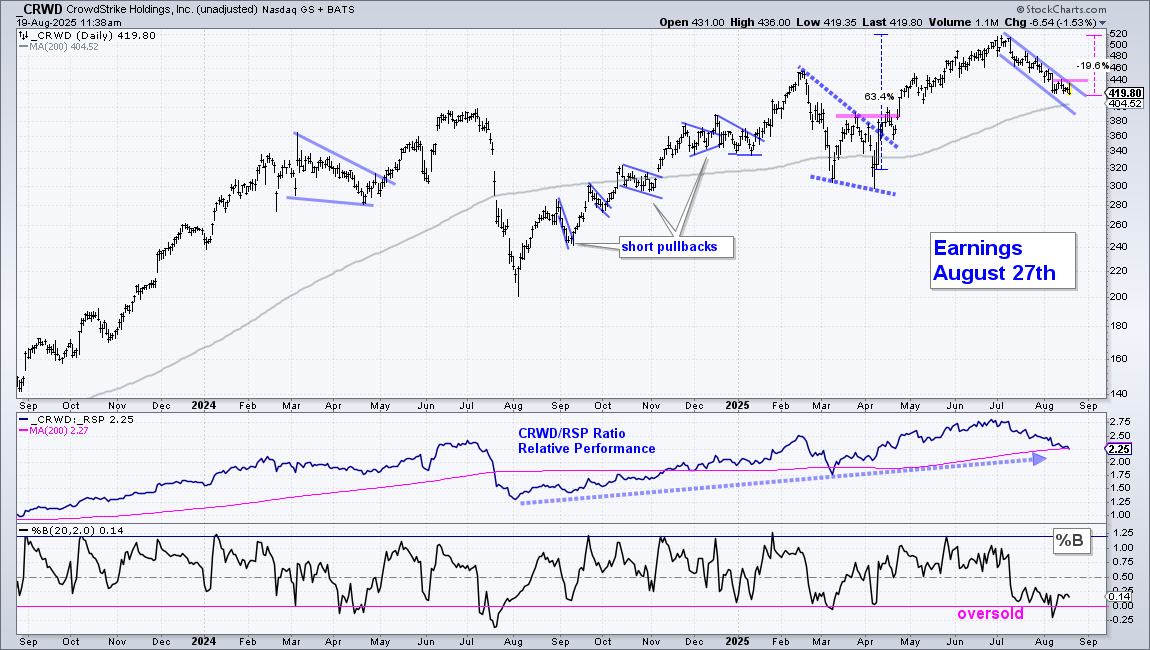
The next chart shows CrowdStrike (CRWD), which accounts for 7.17% of CIBR. The stock is in a long-term uptrend with a new high in July and price above the rising 200-day SMA. CRWD corrected in July-August with a 20% decline from its highs. Note that the stock was up 63% from early April to early July. The current decline is a correction within an uptrend. CRWD became oversold during this decline as %B dipped below zero in early August. The setup here is bullish and a breakout at 440 would reverse the short-term decline. Achtung! Earnings are scheduled for August 27th.
KRE Holds Upswing as KBWB Leads
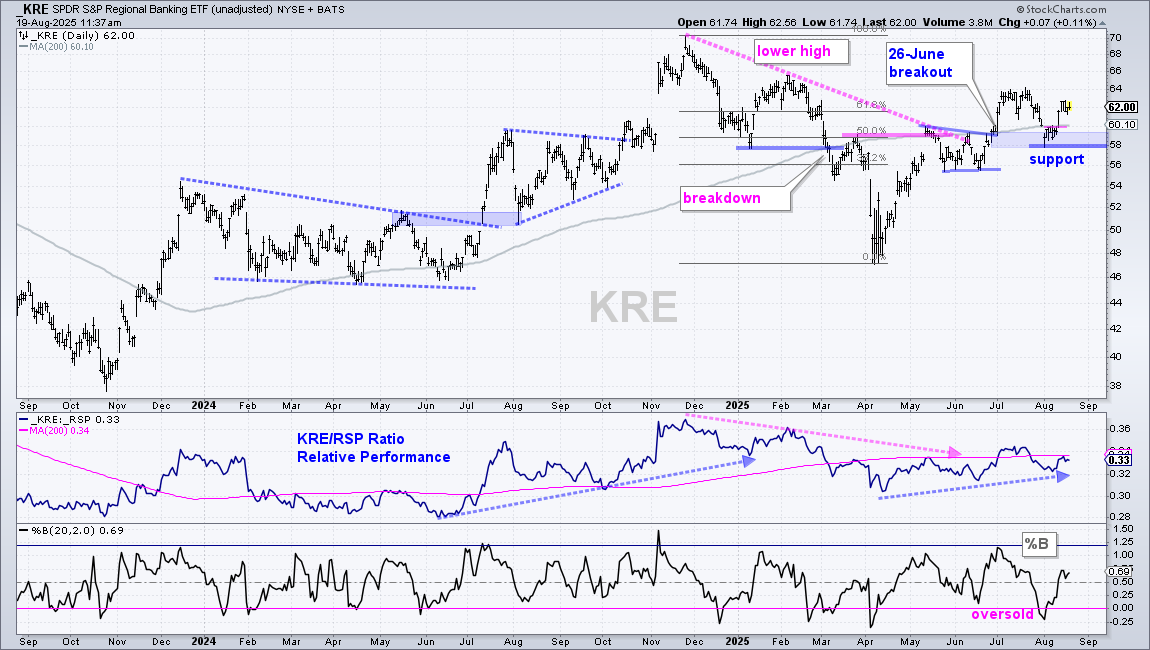
The Regional Bank ETF (KRE) sprang the life last week with a surge off support and a move back above the 200-day SMA. This move helped small-caps because the finance sector accounts for 26.72% of the S&P SmallCap 600 SPDR (IJR) and 24.26% of the Russell 2000 ETF (IWM). Watch KRE for clues on small-caps. Overall, KRE is in a long-term uptrend since the breakout on June 26th. The ETF fell back to the breakout zone in early August and became oversold (%B<0). This gave way to a strong bounce above 62 last week. This bounce reinforces support in the 58-60 area and it is important that 58 holds. A support break here would negate the bounce and reverse the uptrend.
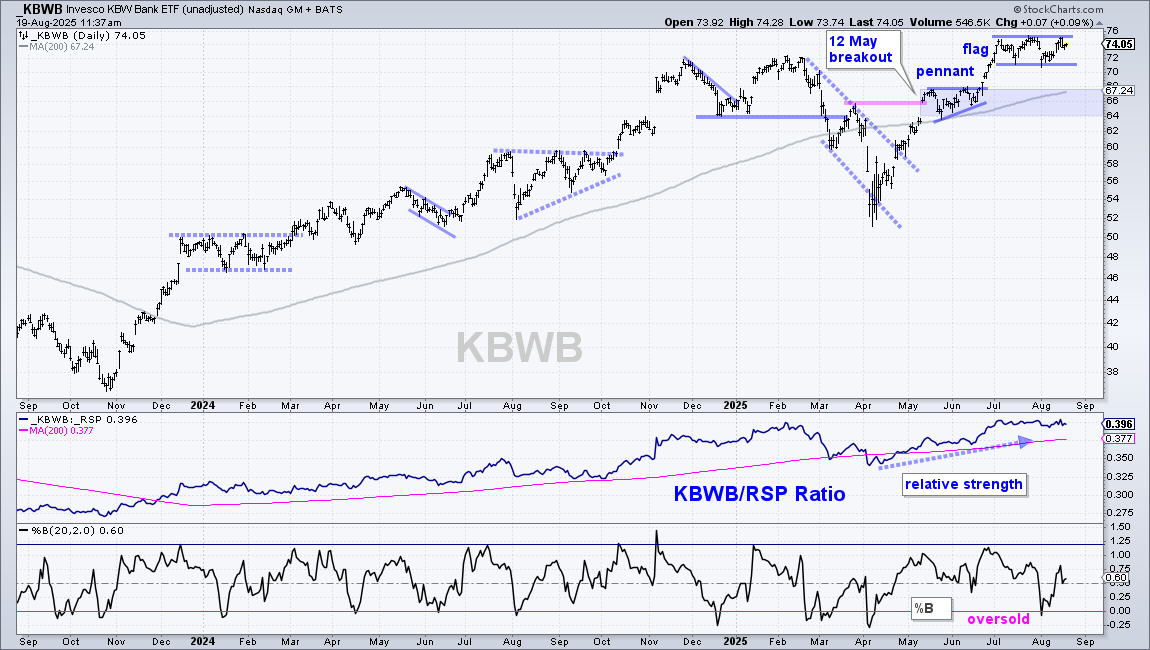
The next chart shows the KBW Bank ETF (KBWB), which is geared towards large-caps. Its top holdings include Goldman Sachs (GS), Morgan Stanley (MS), JP Morgan (JPM), Bank of America (BAC), Wells Fargo (WFC) and Citigroup (C). As one might expect, KBWB is much stronger than KRE because it hit a new high in August (closing prices). Short-term, the ETF surged from 64 to 76 and then consolidated with a flag. This is a bullish continuation pattern and a breakout would keep the rally going. Long-term support is set in the 64-68 area.
GLD Gets Real Quiet
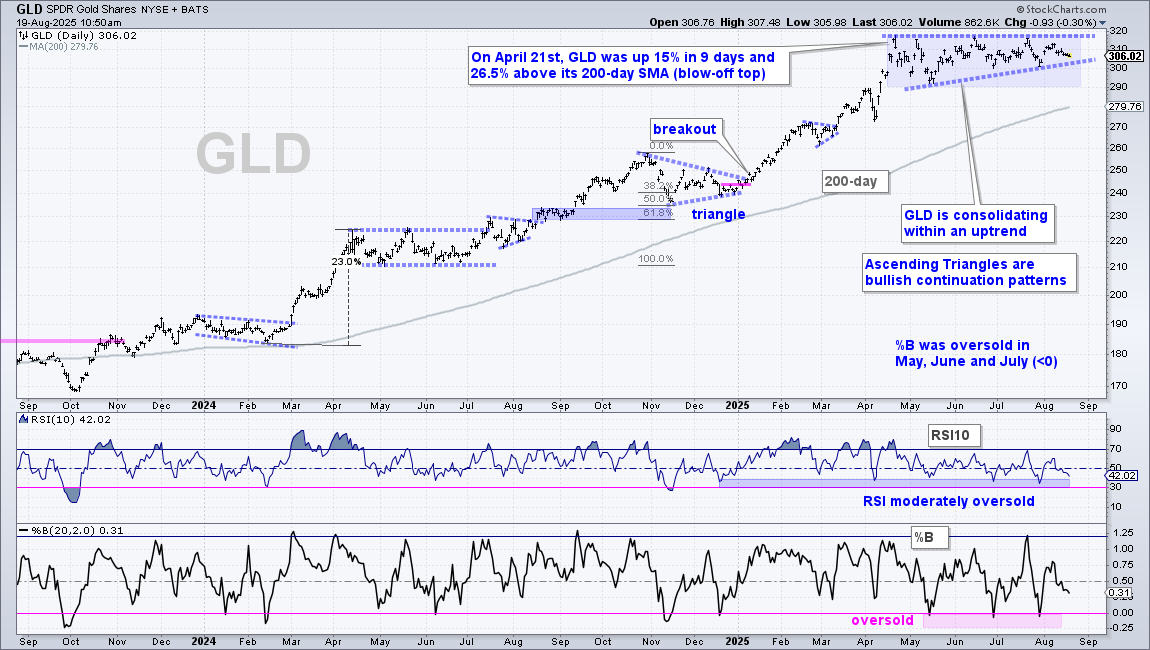
There is no change in the Gold SPDR (GLD), except the extremely narrow range the last six days (306.52 to 310.39). This could be the quiet before the storm (the next break). Chartists looking for a jump can watch for a breakout at 311. The long-term trend is up with a new high in April. Medium-term, the ETF moved into a trading range with an Ascending Triangle forming. This is a bullish continuation pattern that represents a rest within the uptrend. A breakout at 320 would be bullish. A break below 300 would negate the Ascending Triangle, but this would not be a bearish development because it would not affect the long-term uptrend. Instead, a deeper pullback would likely lead to the next oversold setup.
Send feedback to support(at)trendinvestorpro.com or use the contact form.