Small-caps came to life this week with big moves the last two days. These moves keep the uptrends alive for the S&P SmallCap 600 SPDR and S&P MidCap 400 ETF. Both were oversold and at support just below these surges. We will also look at an oversold condition in the Zweig Breadth Thrust indicator on August 1st. Even though these moves are impressive, small-caps trade more erratic than large-caps. This means small-caps are more likely to make big moves – in both directions. It also means that subsequent trends are less smooth.
Small and Mid Cap ETFs Surge off Support Zones
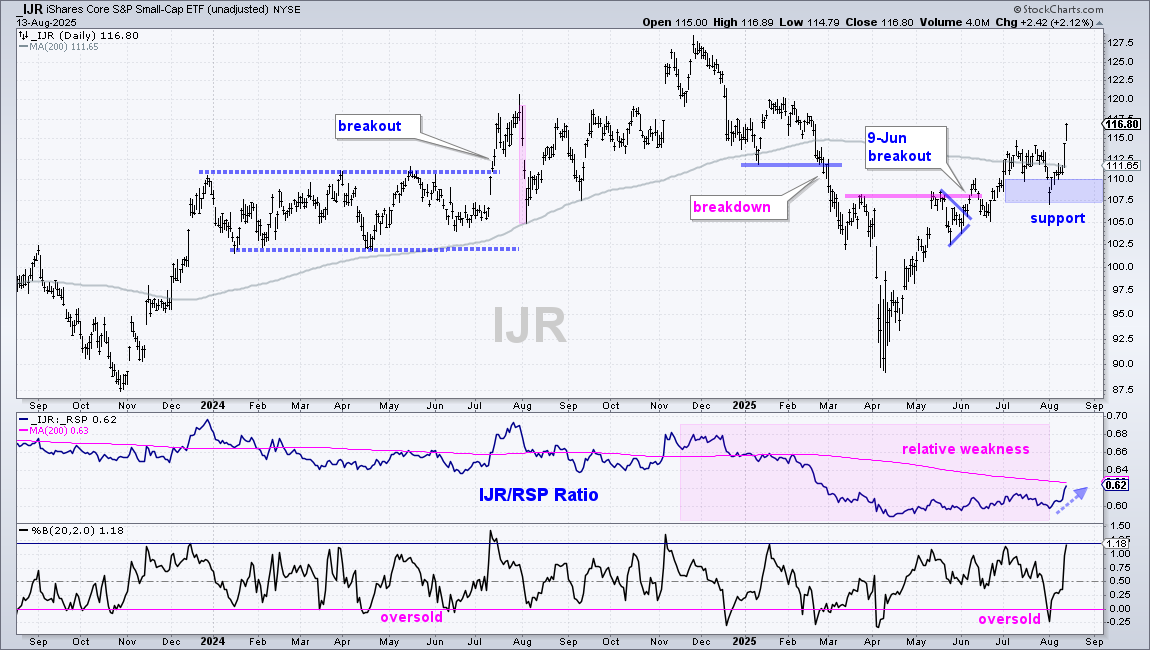
The chart below shows the S&P SmallCap 600 SPDR (IJR) surging 5.4% the last two days, which is the largest two day gain since April 9th. Overall, IJR triggered an uptrend signal with the break above the May high on June 9th (see chart). The ETF worked its way higher, but stalled from early July to early August, even as SPY and QQQ moved to new highs. Instead of breaking support at 107 and reversing the uptrend, IJR surged off this support zone and exceeded its July highs.
Admittedly, I was leaning bearish on Tuesday because IJR was underperforming long-term and over the prior five weeks. Despite the uptrend signal on June 9th, the ETF was struggling to hold above its 200-day SMA. What did I miss here? Hindsight is 20/20, but we can learn from past misses. Technically, IJR was in an uptrend since the June 9th breakout. On August 1st, it was oversold with %B below zero and trading in a support zone. Oversold, at support and in an uptrend. This is a classic recipe for a bounce. Sounds so easy in hindsight.
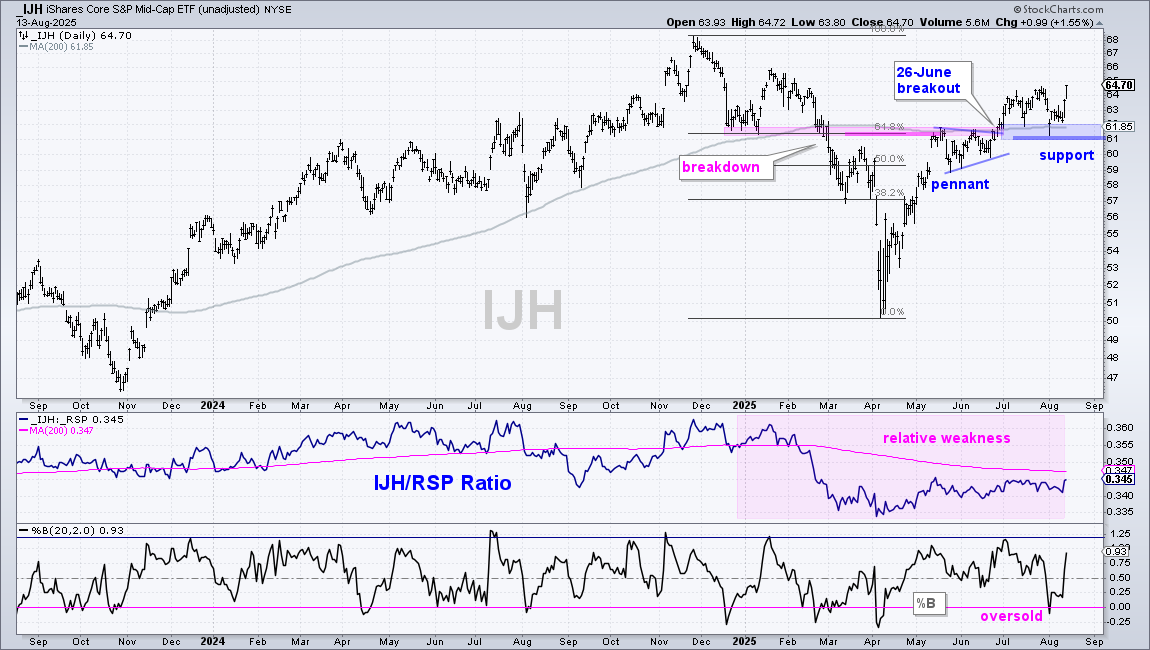
The next chart shows the S&P MidCap 400 ETF (IJH) with a trend-reversing breakout on June 26th. This is when IJH negated the late February breakdown (pink shading), broke resistance and exceeded the 200-day SMA. The ETF traded flat since this breakout, even as SPY and QQQ moved to new highs in August. IJH is now playing catch-up with a 3.87% surge in two days. This move keeps the uptrend alive and reinforces support in the 61-62 area (blue shading). IJH was also oversold (%B<0) and at support on August 1st.
S&P SmallCap 600 SPDR Triggers Uptrend Signal
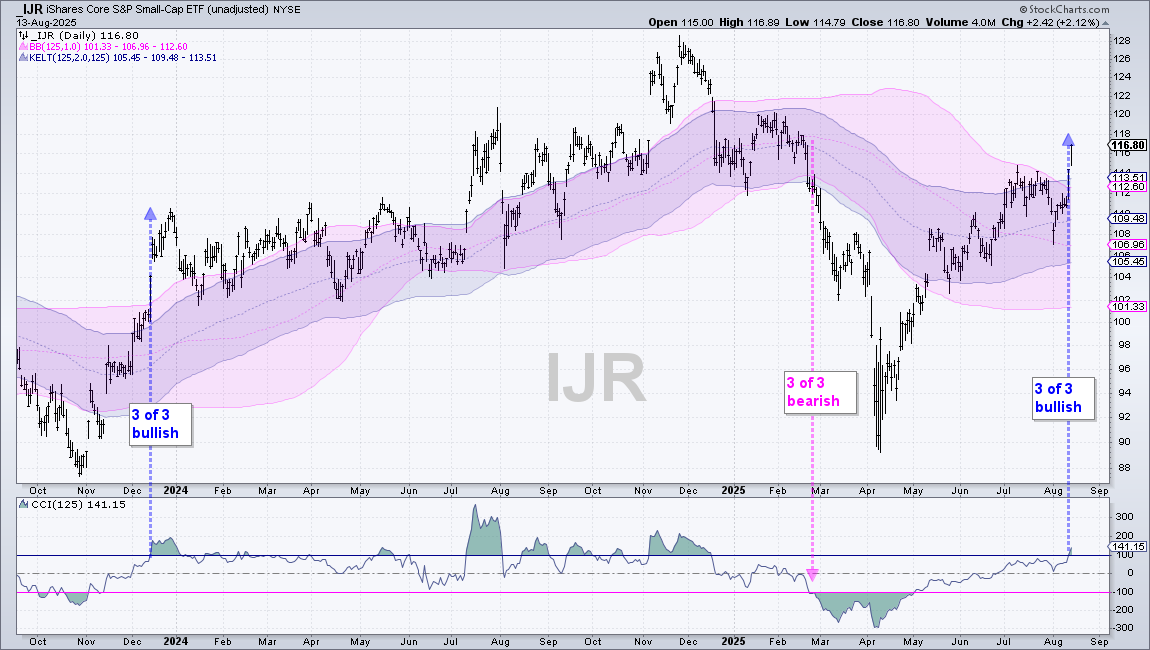
Chart analysis is discretionary in nature, which means it is subject to our judgements. 10 chartists can look at a chart and you will get 11 opinions. Signals based on rules and indicators are systematic. There is no judgement: there is a signal or there isn’t. The next chart shows IJR with the Trend Trio, which is three trend-following indicators for a systematic approach to signals. Bollinger Bands (125,1) triggers bullish/bearish with a break above/below the upper/lower band. The Keltner Channel (125,2) triggers bullish/bearish with a break above/below the upper/lower line. CCI(125) triggers bullish with a move above +100 and bearish with a move below -100. The Trend Trio is bullish when two or more trigger uptrend signals and bearish when two or more trigger downtrend signals.
The blue arrow-lines show uptrend signals in December 2023 and August 2025. There was a downtrend signal in late February 2025. Note that trend-following indicators lag, which is why signals trigger after a big move. Trend-following signals work when trends extend, and fail when prices whipsaw. The current signal means the price advance was significant enough to signal the start of an uptrend. Notice, however, that IJR triggered bullish in December 2023 and then traded flat for six months.
Oversold Readings Prior to This Week's Pop
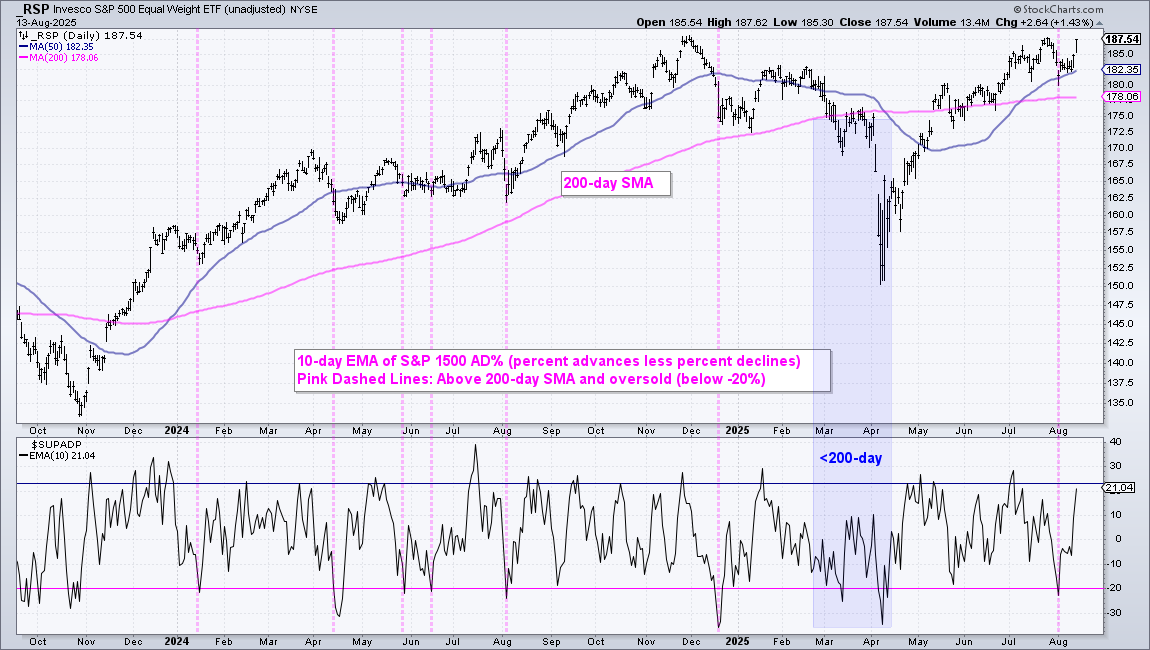
As noted above, hindsight is 20/20, but we can learn by going back and studying setups before the move. The next chart shows the S&P 500 EW ETF (RSP) with the Zweig Breadth Thrust indicator. While the ZBT is famous for its thrust signals, it can also be used to identify short-term oversold conditions. The indicator window shows my version of the ZBT: the 10-day EMA of S&P 1500 AD Percent ($SUPADP). An oversold condition is present when the indicator dips below -20%.
Oversold conditions present traders with opportunities, but only when the bigger trend is up. The top window shows RSP with the 200-day SMA (pink line). RSP was above its 200-day from mid November 2023 to early March 2025. During this time, there were six oversold setups (pink dashed line). The blue shading shows when RSP was below the 200-day SMA, and oversold setups were ignored. Flash forward to August and there was an oversold setup on August 1st. As long as RSP remains above its 200-day SMA, I will keep an eye on this indicator for oversold conditions.
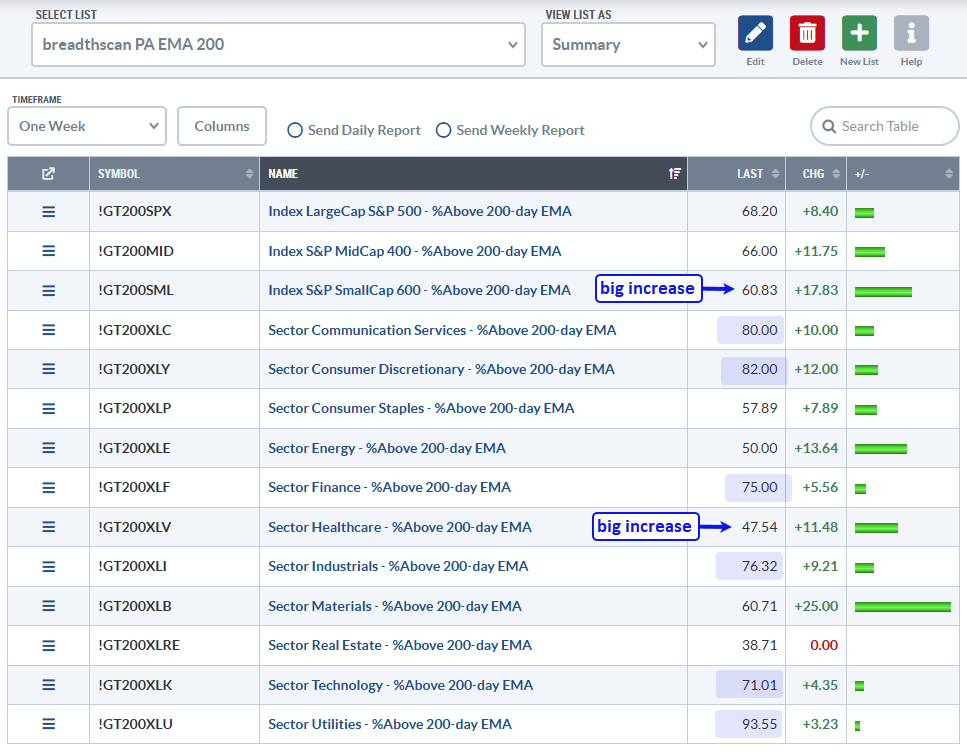
The table below show the percentage of stocks above the 200-day EMA for three major indexes and the eleven sectors. The LAST column shows the current value for the indicator and the CHG column shows the 5-day point change. SML %Above 200-day EMA (!GT200SML) increased the most of the three indexes (+17.83). This shows broadening participation within the S&P SmallCap 600, which is bullish. Among the sectors, I also noticed a big change in Healthcare, which increased 11.48.
The blue shading highlights the sectors with the highest percentage of stocks above their 200-day EMAs. Communication Services, Consumer Discretionary, Finance, Industrials, Technology and Utilities are leading.
IWM Catches up with SPY (relative performance)
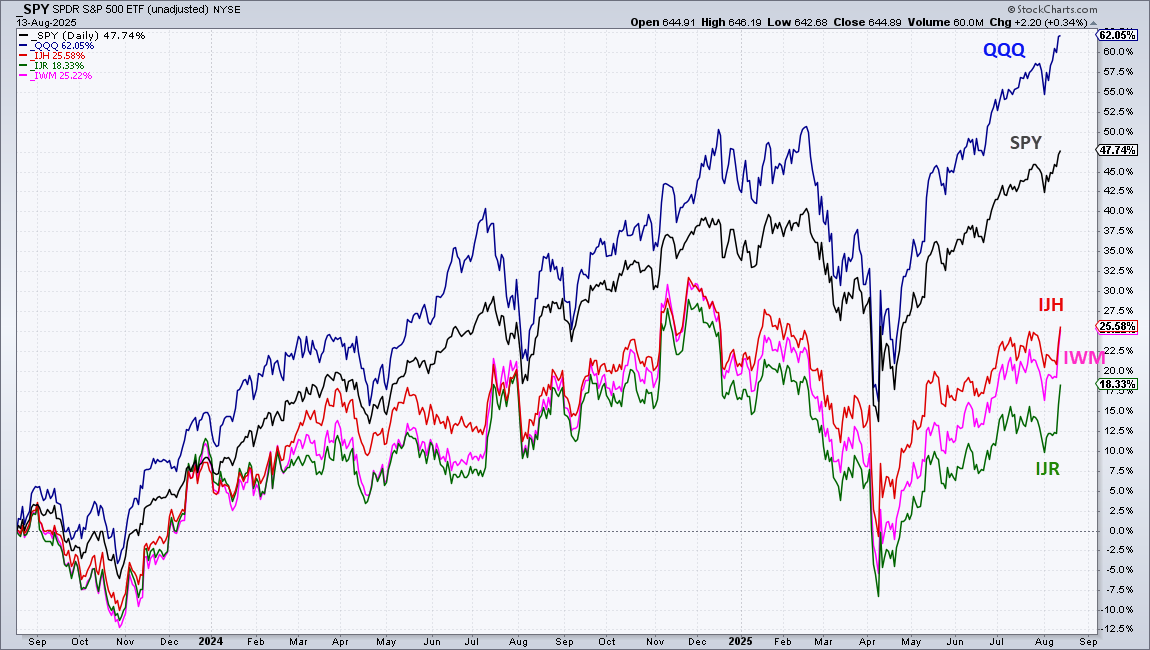
The chart below shows performance for SPY, QQQ, IJH, IJR and IWM over the last two years. QQQ is the runaway leader with SPY a distant second. The S&P MidCap 400 ETF (IJH) and Russell 2000 ETF (IWM) are tied for 4th and 5th place with ~25% gains. The S&P SmallCap 600 SPDR (IJR) is bringing up the rear with an 18.33% gain.
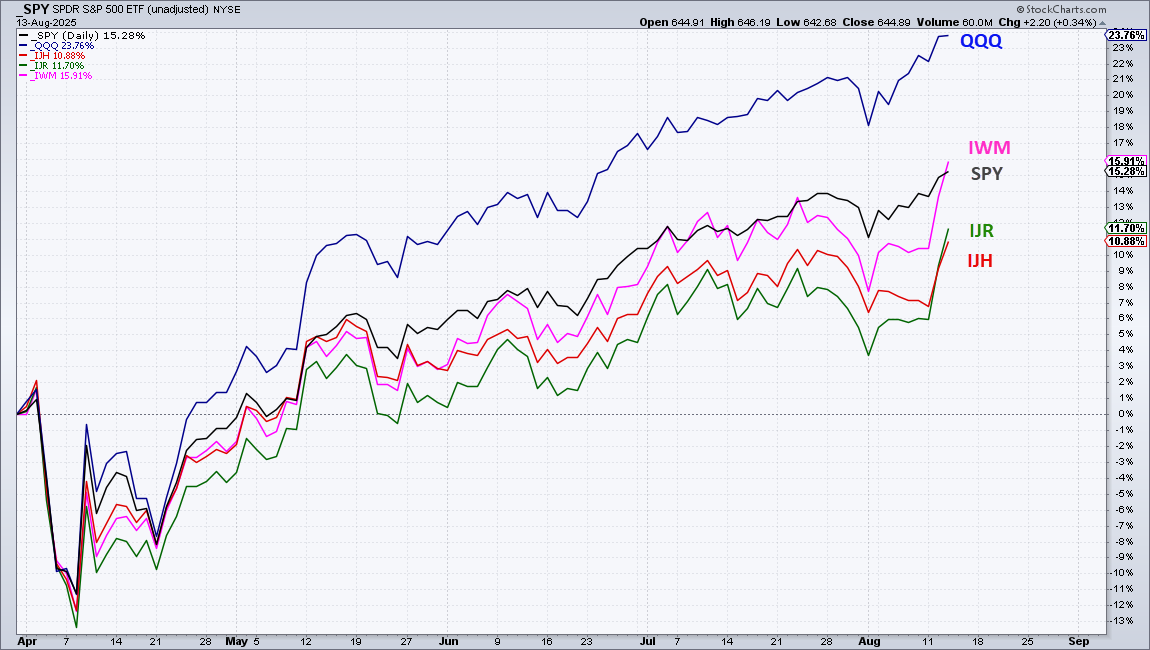
The next chart shows performance for these ETF since April 1st. First place is no surprise (QQQ), but IWM moved into second place with a big surge the last two days. IWM is up 15.94% and SPY is up 15.28%. IJR and IJH are bringing up the rear. In general, I prefer IJR for trading and analysis, but these performance metrics may warrant a rethink.
Small-caps are More Erratic than Large-caps
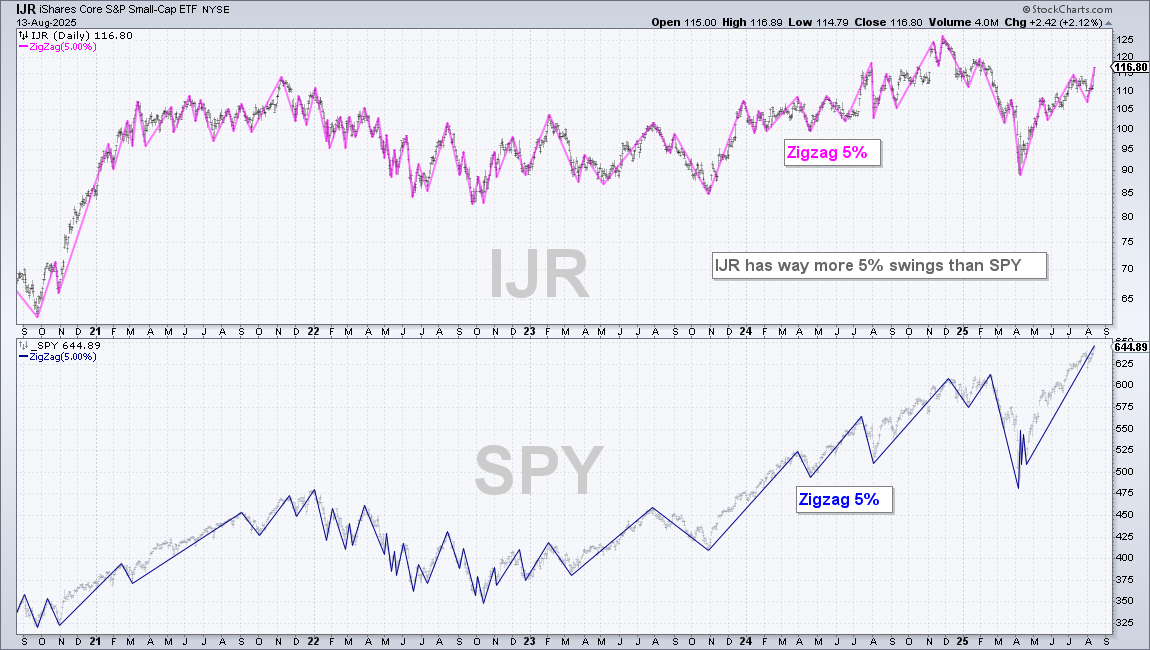
So small-caps are coming to life with big price moves, improving breadth and strong relative performance (IWM). What now? Keep in mind that small-caps are more erratic and less “trendy” than large-caps. The chart below shows IJR with the 5% Zigzag (pink) and SPY with the 5% Zigzag (blue). This indicator changes direction when there is a move that exceeds 5%. Moves less than 5% are ignored. A visual inspection shows IJR with many more 5% swings than SPY. This means IJR and IWM are more likely to experience 5% pullbacks than SPY. From a trading perspective, this means it would be prudent not to chase this move. Instead, take advantage of this erratic price action and wait for a pullback or short-term oversold condition.
Send feedback to support(at)trendinvestorpro.com or use the contact form.