Nutanix Forms Bullish Pattern above Rising 200-day
The post highlights four stocks that are in long-term uptrends and breaking out after pullbacks. First, we focus on a short-term breakout within a bigger bullish pattern. Second, we look at a flag breakout in an auto stock. Third, we feature a telecom with a wedge breakout and challenge to the rising 200-day SMA. And finally, we analyze a leading cloud stock with a bullish wedge above the rising 200-day SMA.
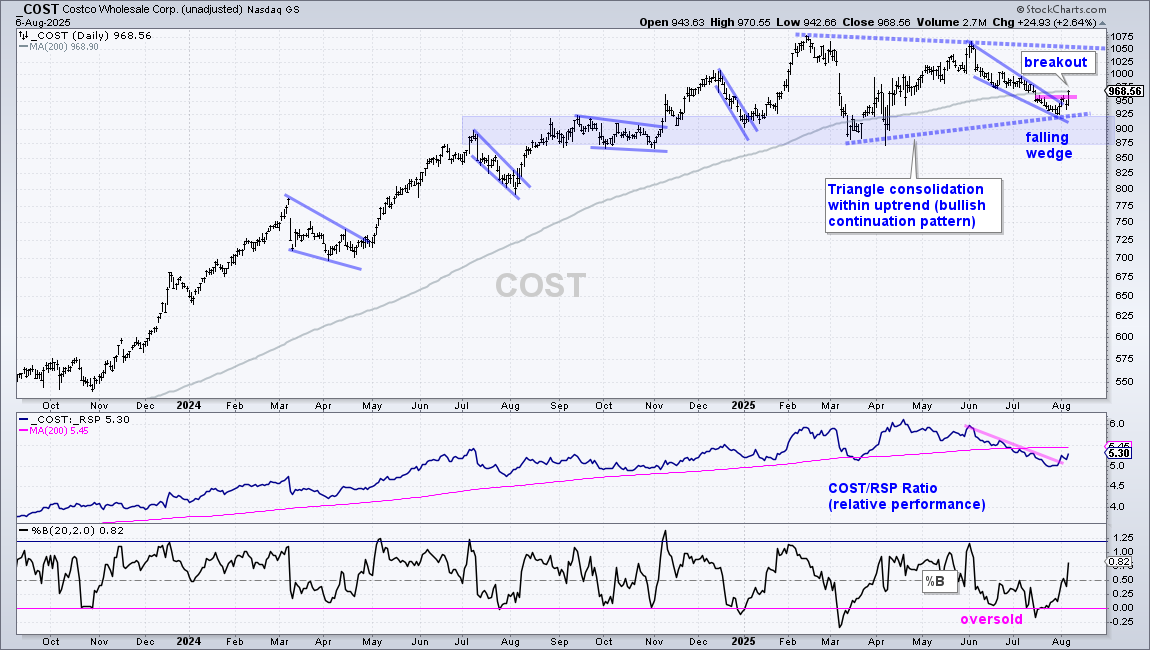
Costco Turns up within Bigger Bullish Pattern
Costco (COST) lagged the market from April to July, but recently turned up and a large bullish pattern is taking shape. Long-term, COST hit a new high in February and then consolidated with a triangle. This is a long-term bullish continuation pattern and a breakout at 1060 would signal a continuation higher. Short-term, the swing within the pattern was down from early June to late July. This downswing reversed as COST broke out of a falling wedge. The upturn within this pattern is the first sign that COST will make a run for triangle resistance. A close below 900 would negate this wedge breakout.
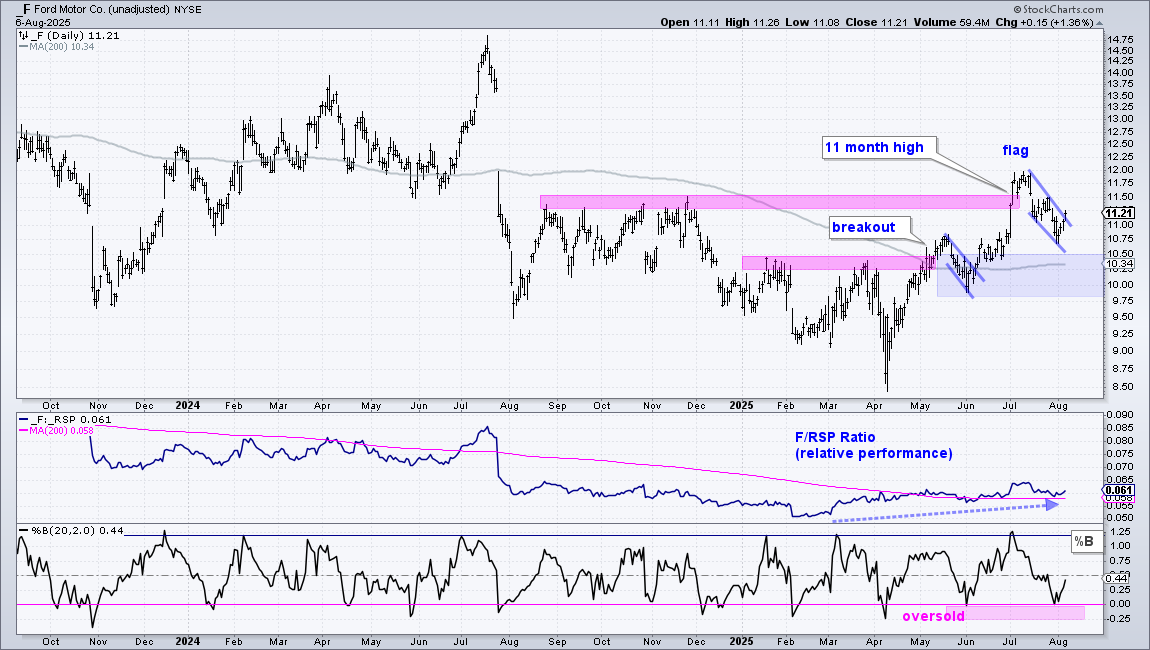
Ford Holds above 200-day and Breaks Flag Line
The chart below shows Ford (F) breaking out in April with a strong move that extended to 12 in early July. This surge exceeded the August-November 2024 highs to record an 11 month high. Ford was overbought after a five week surge from 10 to 12 and worked off this condition with a falling flag. Flags are short-term continuation patterns that take their bias from the prior move, which was up. Ford broke the flag line with a bounce the last three days. This is the first clue that the bigger uptrend is resuming. Long-term support is set in the 9.8-10.50 area (blue shading). The middle window shows the price-relative turning up in March and working its way higher the last 5 months. The F/RSP ratio is above the 200-day SMA and this means the stock shows relative strength.
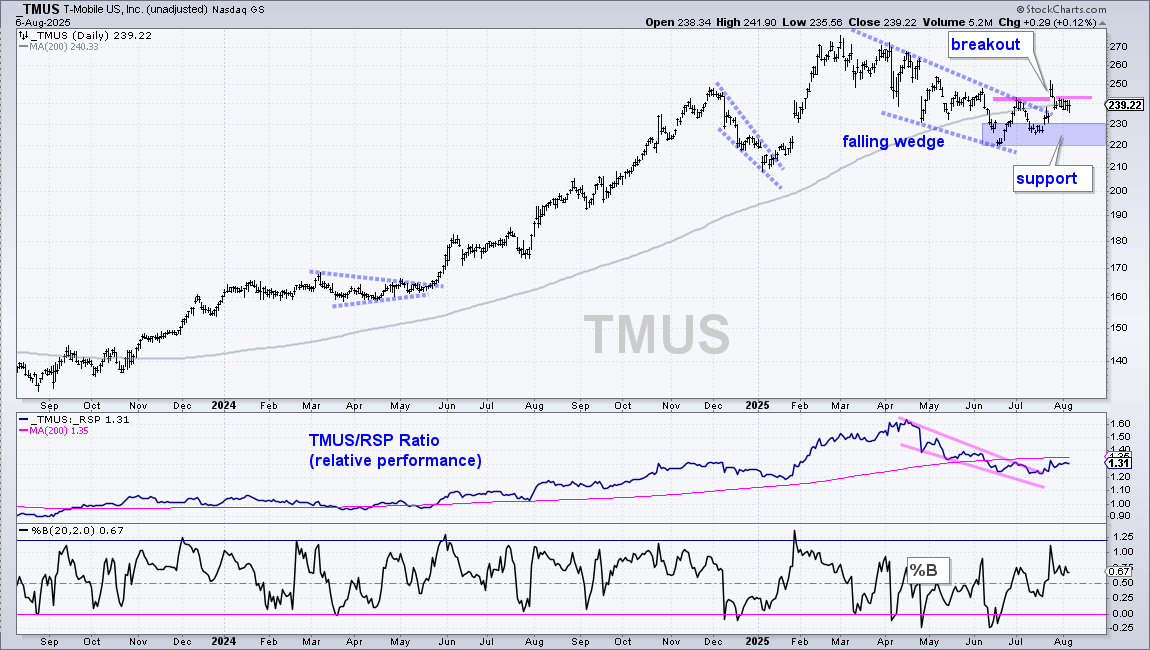
T-Mobile Breaks Wedge Line and 200-day
The next chart shows T-Mobile (TMUS) leading the market with a new high into February, and then correcting into July with a falling wedge. Overall, I view this falling wedge as a correction within the bigger uptrend. As such, the recent gap and breakout are bullish, signaling a continuation higher. TMUS broke out with a surge to 250 on July 24th and then fell back to the 200-day around 240. A tight range formed the last six trading days and a short-term breakout at 243 would bullish. Support is set in the 220-230 area.
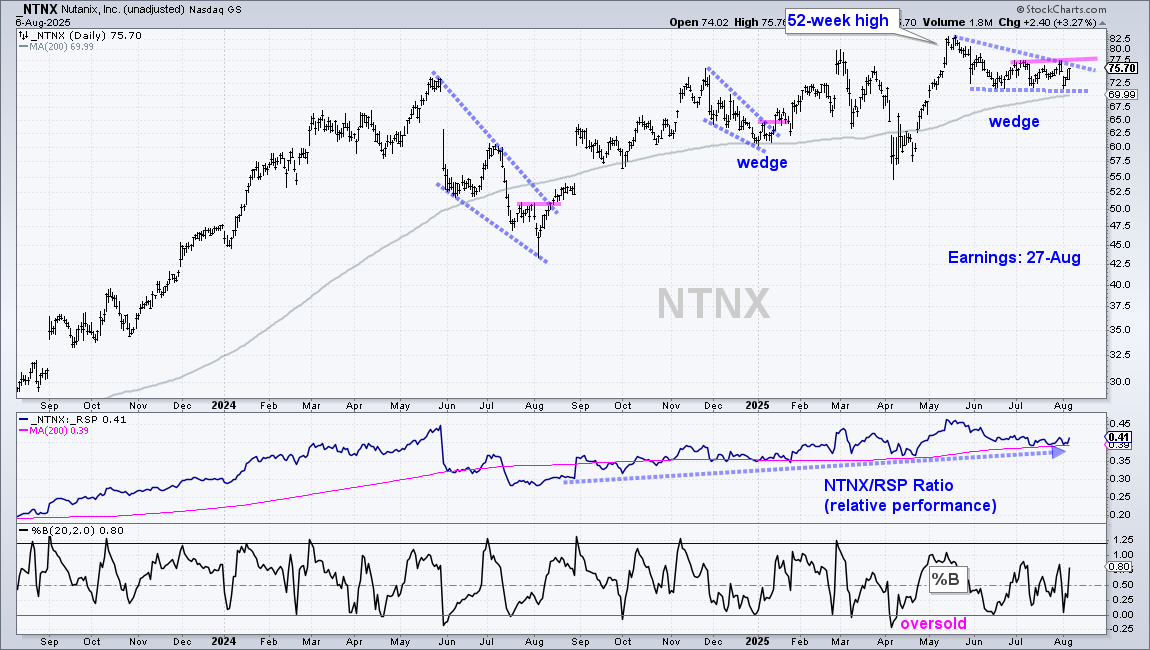
Nutanix Forms Bullish Pattern above Rising 200-day
The next chart shows Nutanix (NTNX), which provide cloud services and software. Note that NTNX reports earnings on August 27th. Long-term, the stock is in a leading uptrend with a new high in May and the price-relative above the rising 200-day SMA (middle window). Short-term, NTNX surged from 57.5 to 82.5 in April-May and became overbought. The stock worked off these overbought conditions with a wedge consolidation above the rising 200-day SMA. I view this wedge as a corrective pattern after the April-May surge. As such, a breakout at 78 would be bullish and signal a continuation higher. Should NTNX break out, I would set re-evaluation support at 72.
Send feedback to support(at)trendinvestorpro.com or use the contact form.