Systematic Strategies and Next Level Technical Analysis
Correction Underway – Three Indicators Show Increasing Weakness from Within
Arthur Hill, CMT
Archive
Use CRTL+P to Print
Headlines
A Correction is Underway
SPY and QQQ Near Highs
Mid and Small Caps ETFs Battle 200-day SMAs
%Above 50-day SMA Did Not Bounce
More New Lows than New Highs on Monday
S&P 500 Percent with Golden Cross Turns Down
Put/Call Signal remains Bearish
Seasonal Tendency Weak Into October
Correction Underway
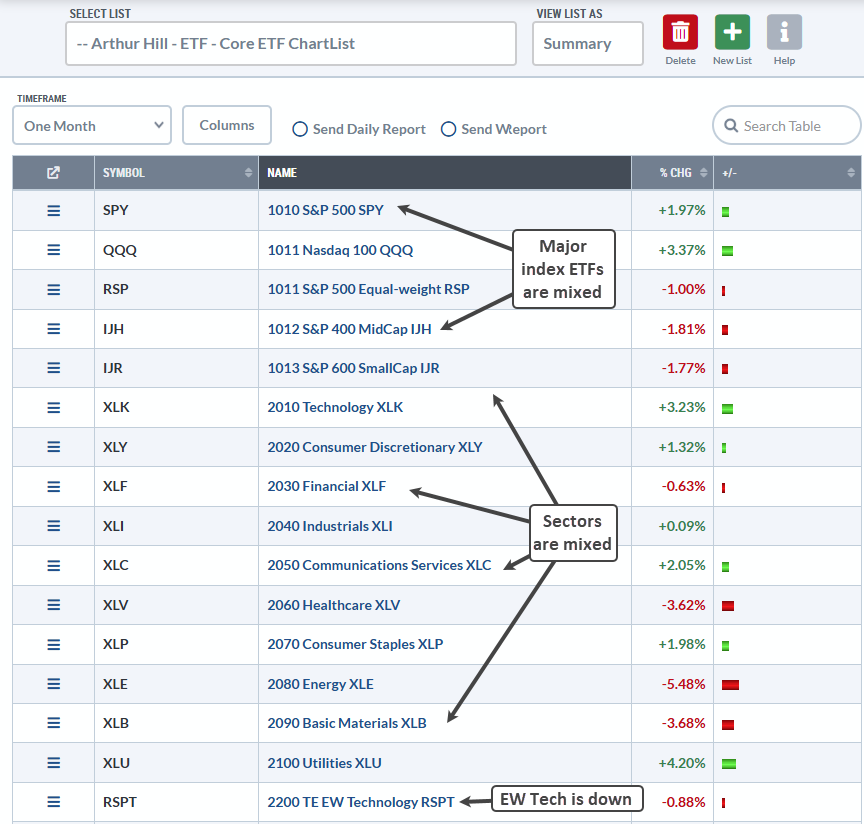
A correction is underway because equity ETFs are mixed over the past month (21 trading days). SPY and QQQ are up, but Small-caps (IJR) and Mid-caps (IJH) are down. Six of the eleven sectors are up, which means five are down. Even within the tech sector, we are seeing mixed performance because the Technology SPDR is up 3.23% and the EW Technology ETF is down. The table below shows one-month performance for the major index ETFs and sectors. It’s a mix of red and green.
Today’s report will focus on some broad market indicators that argue for a correction. The advance into the July highs was narrow with selective leadership. We are now starting to see evidence of weakness under the surface. Even though SPY and QQQ hit new highs over the last two trading days, the percentage of stocks above their 50-day SMAs did not budge, new lows expanded and more stocks experienced a death cross. This is the recipe for a correction.
Corrections come in all different shapes and sizes. We could see a sideways trading range, a sharp decline back to the 200-day SMA or a zigzag lower (falling wedge). Trading is as much about waiting as it is about acting. The odds currently favor a correction and this makes it prudent to wait for a better setup to emerge. Should SPY and QQQ correct, most stocks and equity ETFs will also come under pressure.
SPY and QQQ Targets
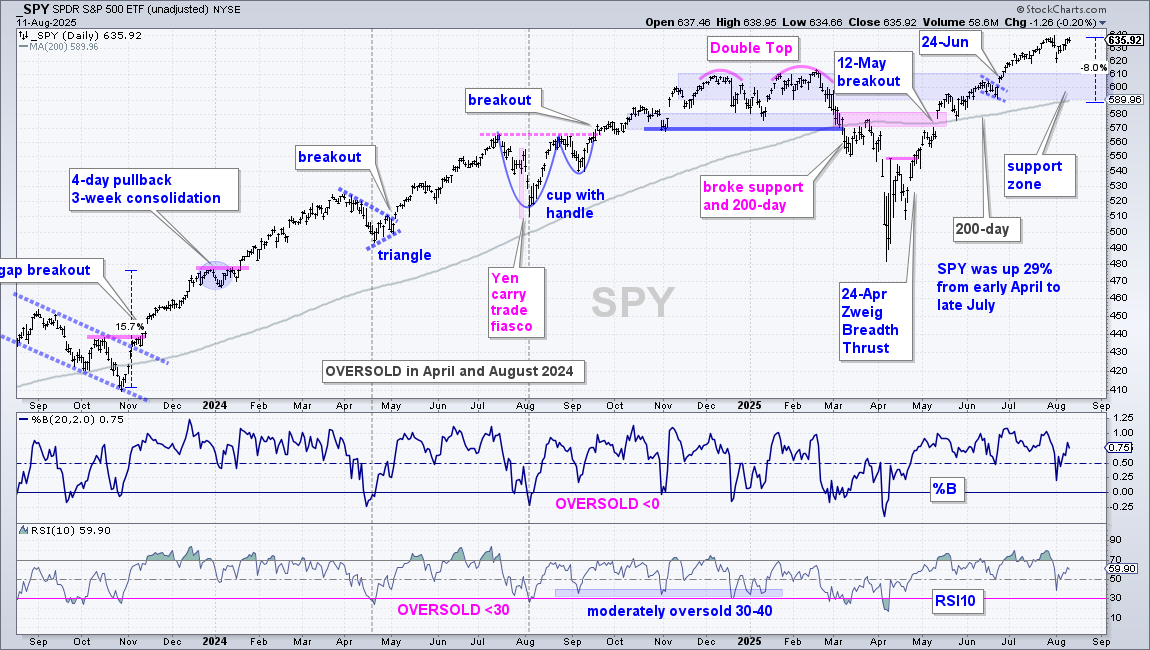
SPY and QQQ remain in leading uptrends. SPY hit a new high in late July and remains well above the rising 200-day SMA. At the very least, I do not see a tradable setup on this chart. SPY is simply in an uptrend. SPY advanced 29% from early April to late July and became overbought. However, SPY was overbought in mid May and continued higher into July. Thus, overbought conditions do not guarantee a correction. Should SPY correct, my downside target is in the 590-610 area. Here we have the rising 200-day SMA around 590 and broken resistance, which turns into support (blue shading).
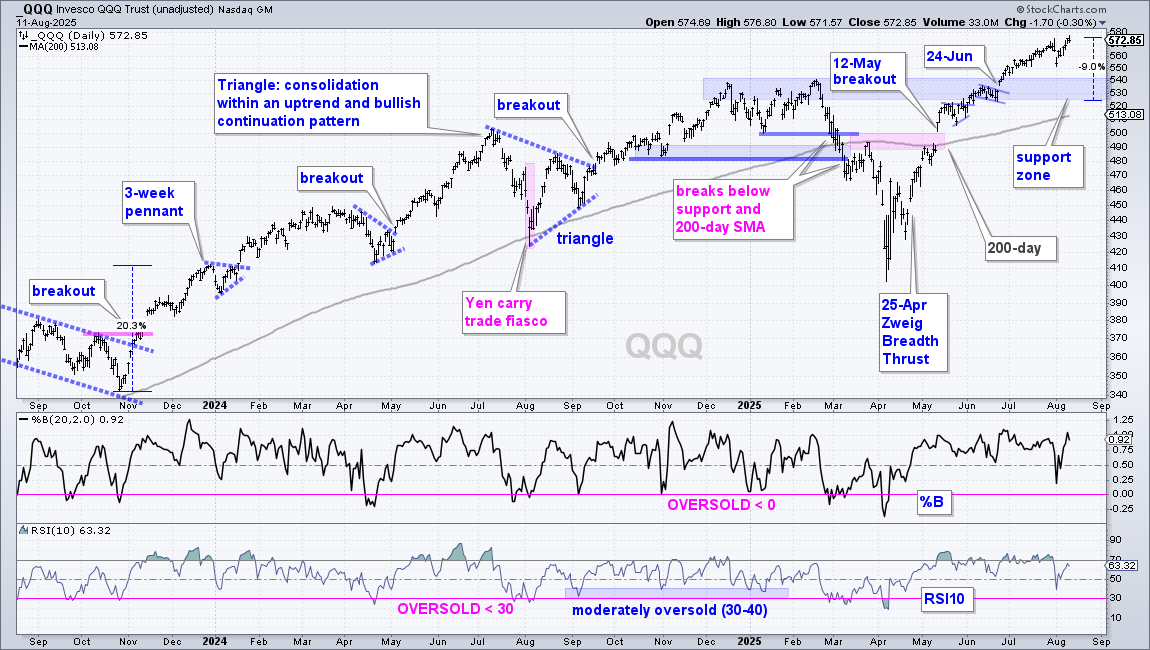
The next chart shows QQQ with a correction target in the 525-540 area. This represents a 5-9 percent pullback from the August high. The blue shading marks support from broken resistance and the June flag. The 200-day SMA is currently at 513 and will rise towards the 520 area in the coming weeks.
Mid and Small Caps ETFs Battle 200-day SMAs
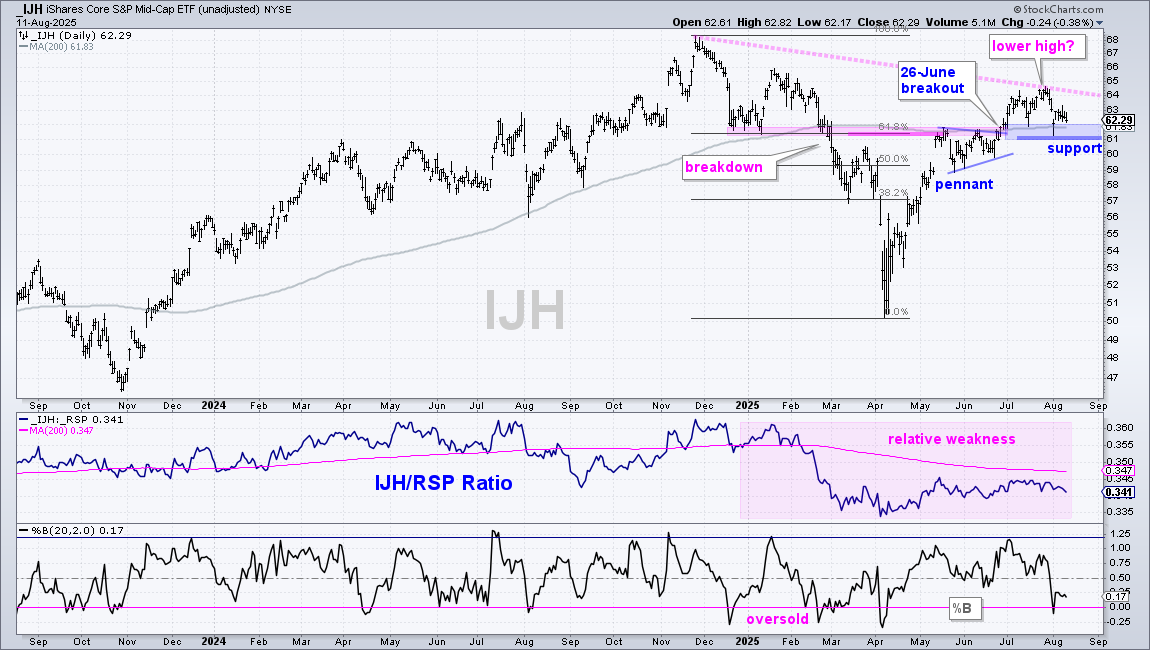
SPY and QQQ are well above their rising 200-day SMAs, but the S&P MidCap 400 ETF (IJH) and S&P SmallCap 600 SPDR (IJR) are still battling this key moving average. They are also trading well below their November lows and underperforming their large-cap brethren. They are both in upswings since April, but would form lower highs should they break support and reverse these upswings. The chart below shows IJH breaking its 200-day SMA in late June and holding this breakout with a consolidation the last five weeks. Support is set in the 61-62 area (blue shading). The breakout remains bullish because it has yet to be negated. A break below 61 would negate the late June breakout and reverse the upswing.
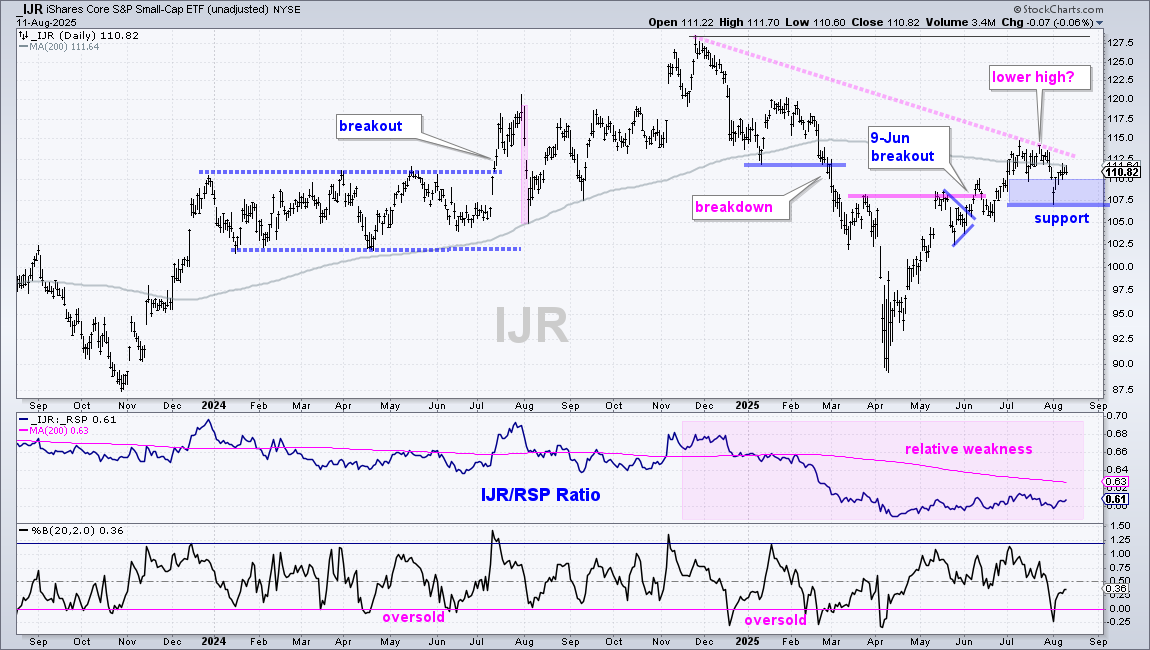
The next chart shows IJR battling its 200-day SMA since early July, which is when it first crossed. Support is set at 107. A break here would reverse the four month upswing.
More New Lows than New Highs on Monday
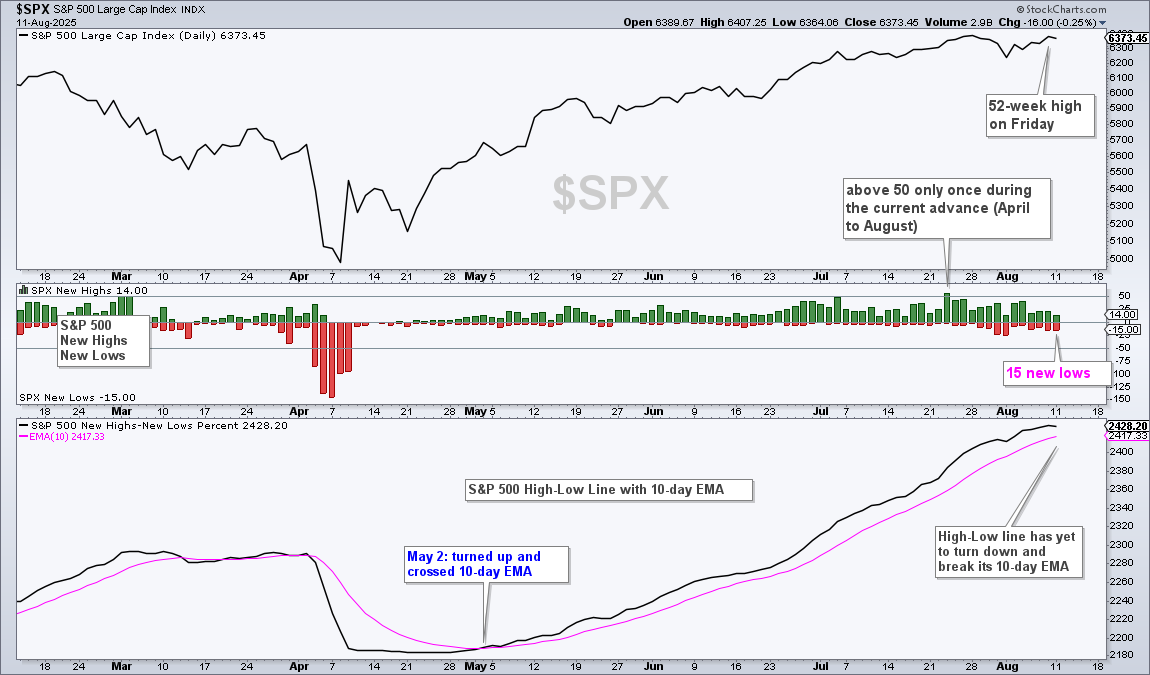
The next chart shows new highs/lows for the S&P 500 and the S&P 500 High-Low Line. There were 15 new lows on Monday and 14 new highs, which means new lows outnumbered new highs. Note that SPY recorded a 52-week high on Friday and fell .20% on Monday, which means it is .20% from a 52-week high. It is rare to see new lows outpace new highs when SPY is so close to a 52-week high. As the red histogram bars show, we new lows started expanding late July and this shows increasing weakness within the S&P 500.
The bottom window shows the High-Low Line, which is a cumulative measure of net new highs (new highs – new lows). This line turned up on May 2nd and remains above its 10-day EMA (uptrend). A downturn and cross below the 10-day EMA would show new lows outpacing new highs and this would be negative.
%Above 50-day SMA Did Not Bounce
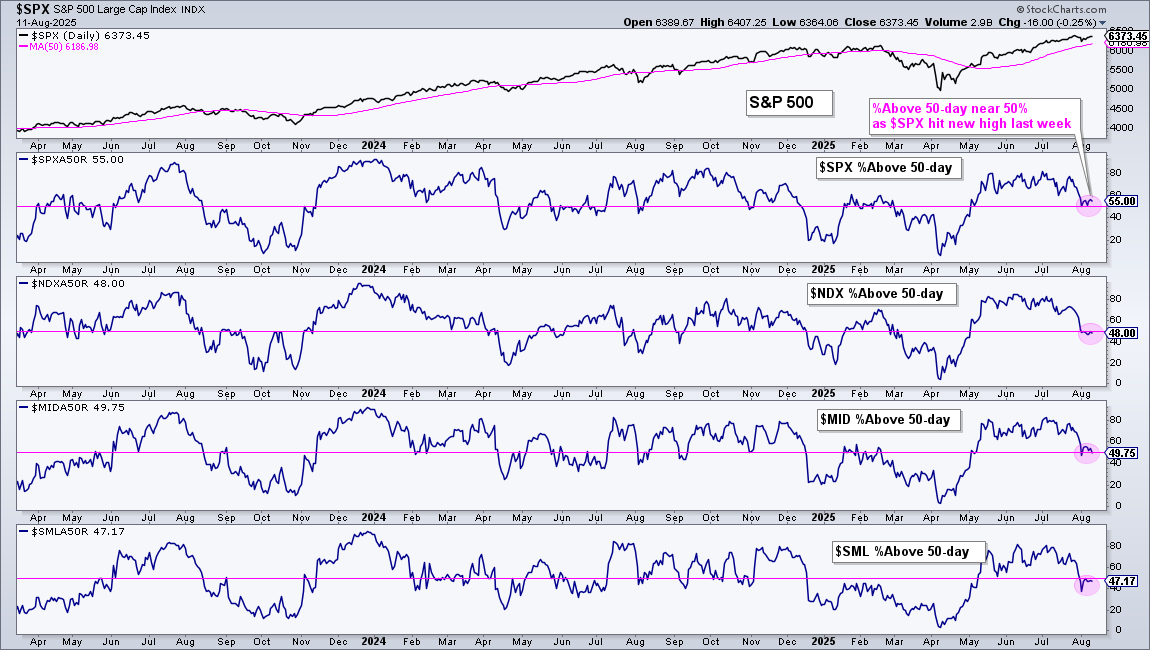
SPY and QQQ recovered from their August 1st declines and moved to new highs. However, the percentage of stocks above their 50-day SMAs did not recover and remains near 50% (pink circles). I ignore slight divergences, but the current lack of participation is hard to ignore when SPY and QQQ are back near new highs. The chart below shows the percentage of stocks above their 50-day SMAs for the S&P 500 (55%), Nasdaq 100 (48%), S&P MidCap 400 (50%) and S&P SmallCap 600 (47%). QQQ hit a new high and only 48% of its component stocks are above their 50-day SMAs (52% below).
S&P 500 Percent with Golden Cross Turns Down
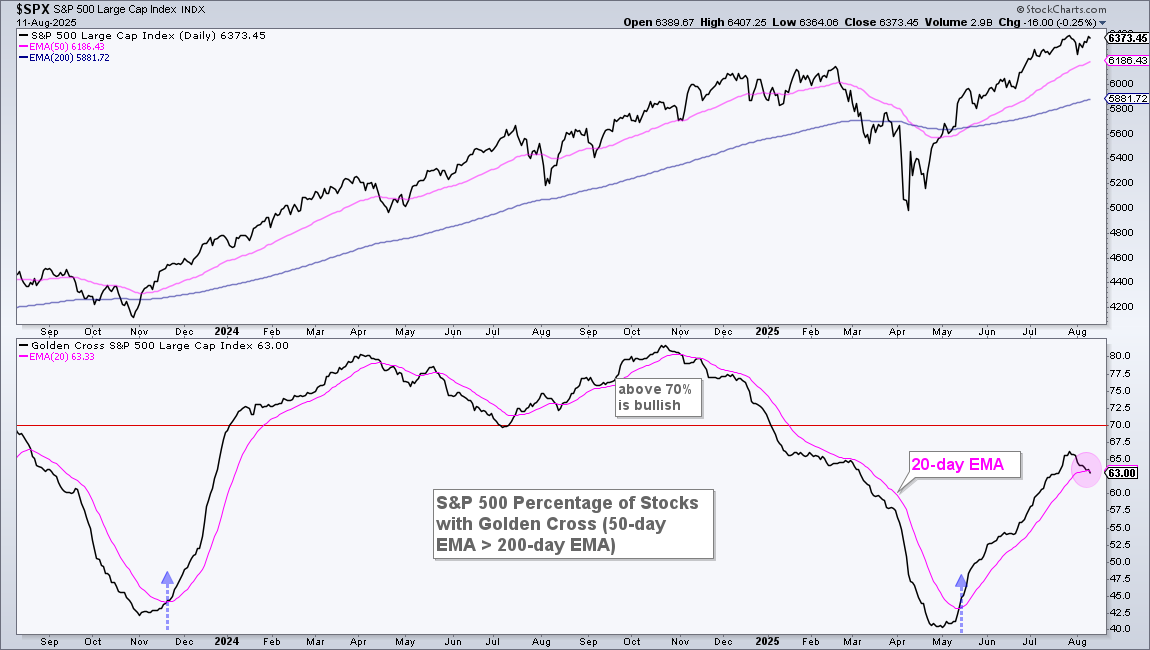
The next chart shows the Percentage of S&P 500 Stocks with a Golden Cross (50-day EMA above 200-day EMA). This indicator is firmly bullish when above 70% and favors the bulls when rising (above its 20-day EMA). Most recently, the indicator plunged to 40% in late April and turned up in mid May (blue arrow). This rise extended into July, but it then turned down the last two weeks and broke the 20-day EMA. Notice that the indicator did not come close to 70%. A downturn below 70% is bearish. This downturn means fewer stocks are holding their golden crosses, and more are triggering death crosses (50-day EMA < 200-day EMA).
Equity Put/Call Ratio Remains with Bearish Signal
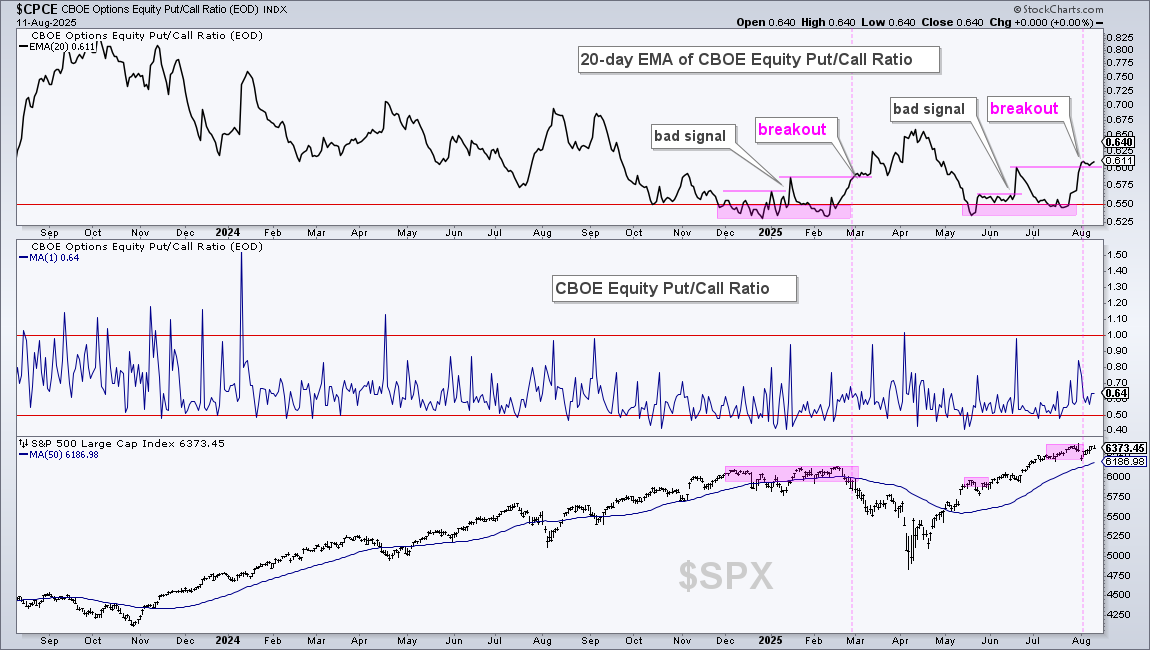
The CBOE Equity Put/Call Ratio ($CPCE) triggered a bearish signal as it became excessively bullish in July and then broke above the June high. This bearish signal sequence is also similar to what we saw in December-February. The $CPCE 20-day EMA dipped below .55 in May and turned up in June with a small breakout, which did not foreshadow a peak (bad signal). There was another dip below .55 in July and a bigger breakout this week.
About $CPCE: The CBOE Equity Put/Call Ratio ($CPCE) shows the ratio of put volume to call volume (put volume divided by call volume). I use a 20-day EMA to smooth the date. This ratio is 1 when put volume is equal to call volume. Readings above 1 show exceptionally strong put volume and bearishness. This is a contrarian indicator that can mark a low in SPY. Readings at .50 indicate that put volume is half that of call volume, or call volume is twice as high as put volume. This shows exceptionally strong call volume and bullishness. As a contrarian indicator, it can foreshadow a peak in SPY.
Seasonal Tendency is Weak Into October
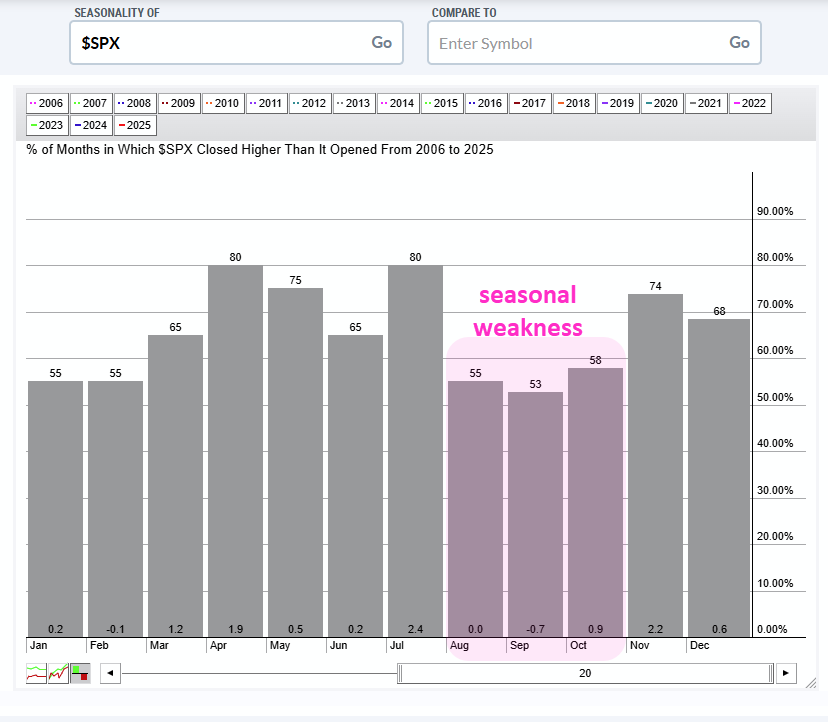
The next chart shows the seasonal tendencies over the last twenty years. Keep in mind that these are “tendencies” that do not work all the time and can be disrupted by event-driven markets. The three month stretch from August to October was the weakest (least strong) three month period for stocks. Even so, we can see that the S&P 500 was up 55% of the time in August, 53% of the time in September and 58% of the time in October. Call it a coin flip.
Send feedback to support(at)trendinvestorpro.com or use the contact form.