Volatility is on the rise the last three months with huge moves in AI related stocks, metals and crypto. Volatility is great when you are on the right side, but keep in mind that volatility goes both ways. Steep rises often give way to volatile consolidations or corrections. Volatility also skews the charts and makes it difficult to find high conviction setups. This, of course, depends on your trading style. My style is to find orderly corrections and pullbacks within stable uptrends. This is a big challenge right now.
ETFs with the Highest Monthly Standard Deviation
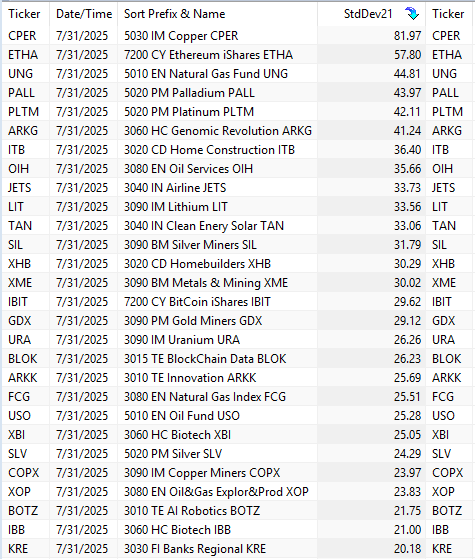
The table below shows the Core ETFs sorted by their 21-day Standard Deviation. Note that this is the annualized 21-day Standard Deviation of daily Log Price Changes. Copper surged to the top of the list this week (81.97%). In the top five, we also see Ethereum, Natural Gas, Palladium and Platinum ETF. For reference, SPY 6.54% is and QQQ is 7.07%.
Overall, 17 of the 30 ETFs in this list are related to commodities or crypto. This includes the Lithium Battery Tech, Silver Miners, Metals & Mining SPDR, Bitcoin, Blockchain, Oil and Oil & Gas Exploration & Production. As a group, there is more risk (volatility) in commodity and crypto related ETFs.
Copper Hit by Tariff News
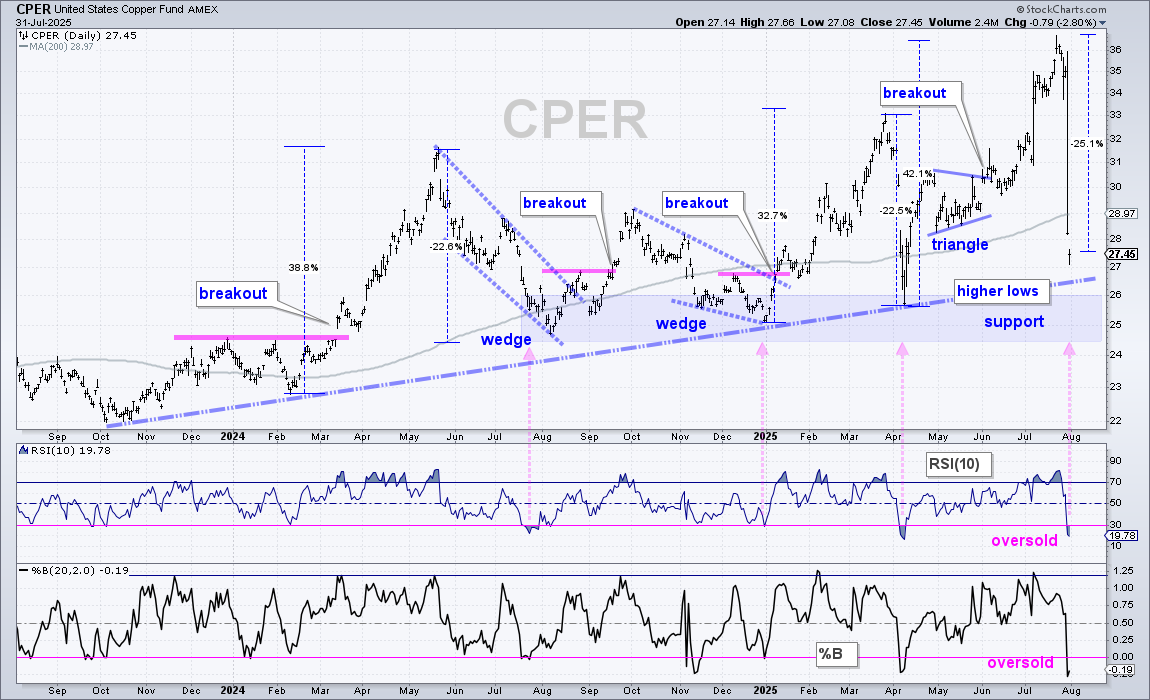
The Copper ETF (CPER) remains in an uptrend, but this also remains one volatile uptrend. Since February 2024, CPER shows three 30+ percent surges and three 20+ percent declines. Each surge forged a higher high and each plunge managed the hold above the prior low (higher lows). The current plunge broke the May lows, but remains above the trendline extending up from October 2023. There is also a lot of support in the 24.5-26 area because these zone held in summer 2024, December 2024 and April 2025 (blue shading). Technically, the uptrend would reverse with a close below the April low because this would forge a lower low. It is also worth noting that CPER is oversold for the fourth time since summer 2024 (pink arrow line). This week’s plunge was painful, but the volatile uptrend remains in force and the ETF is oversold.
DB Base Metals Battles Breakout Zone
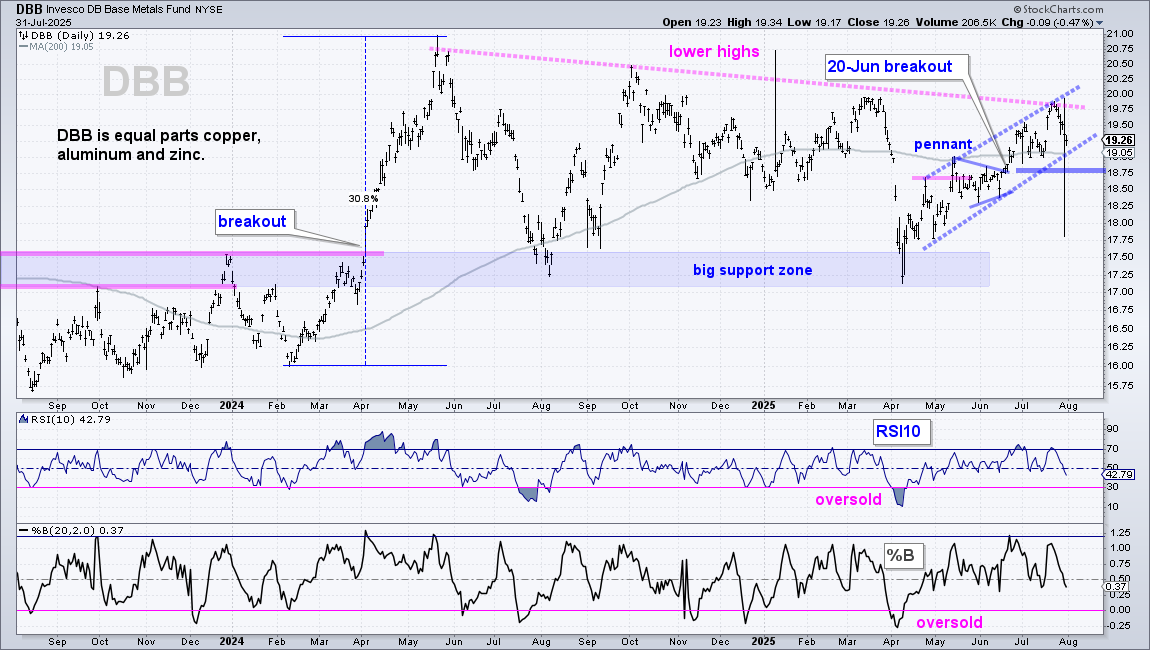
The DB Base Metals ETF (DBB) broke out on June 20th and followed through with further gains into July. Despite this follow through, DBB did not break the March high and remains in a trading range at best. At worst, DBB still sports lower highs since June. The blue dashed lines define the upswing since April and I am marking support at 18.75, a break of which would reverse this upswing.
Platinum and Palladium are Too Volatile
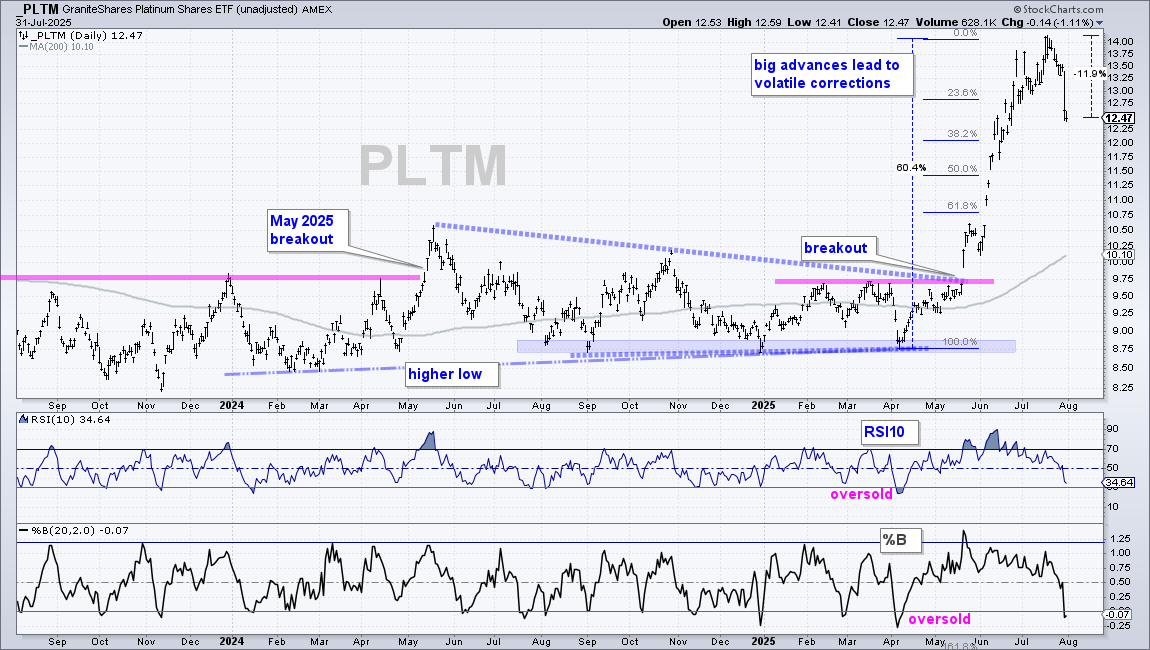
As chartists and traders, we must learn which charts merit further attention for trading setups and which do not. I usually skip charts with erratic price action, parabolic advances and above average volatility. The Platinum ETF (PLTM) looked tradable as the range narrowed into April and the May breakout was bullish. The ETF then surged 60% in three months (April to June). This is a parabolic advance that shows excessive volatility. PLTM fell around 12% from its high, but volatility remains high and this chart does not suit my style. The ETF is starting to become oversold as %B moves below zero, but the pullback is too sharp and price action it too erratic. I will skip PLTM for now.
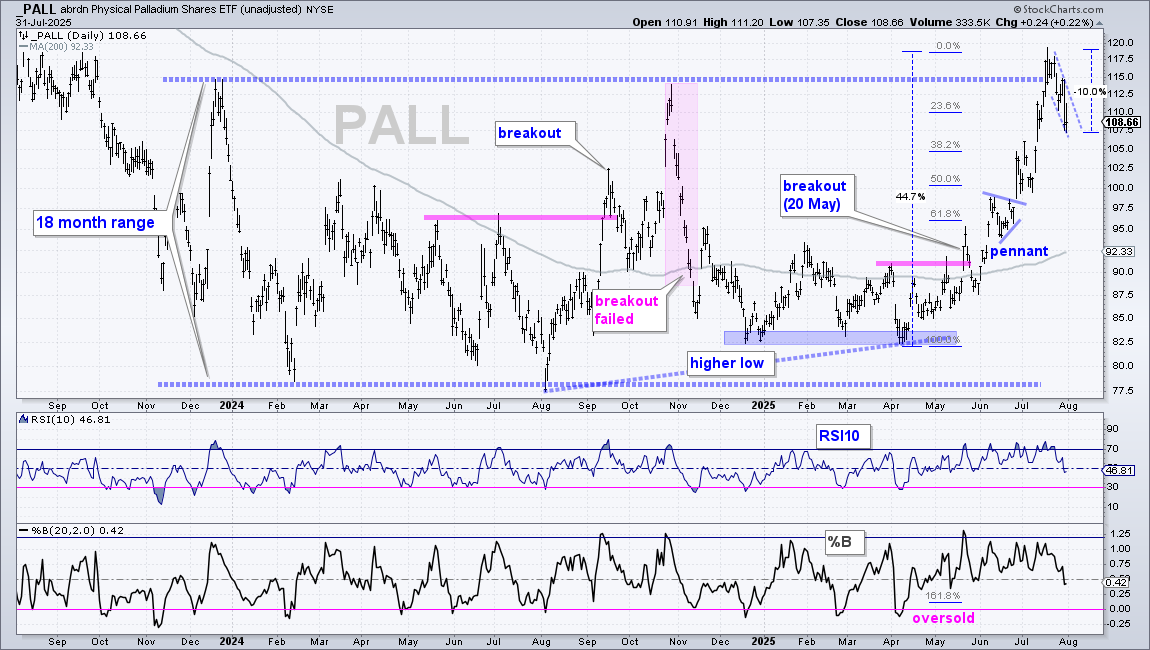
The Palladium ETF (PALL) is in the same category. The ETF surged 45% in three months and fell 10% the last two weeks. I cannot pick a support or tradable pattern with conviction because of the volatility. Support would be anywhere between the May breakout zone and July high. A pullback could retrace anywhere from 25 to 67 percent of the April-June advance. I will monitor the chart, but will not bring it too your attention until a high conviction setup emerges.
Bitcoin is Positively Correlated with QQQ
As noted in this report on Friday, the odds are increasing for a correction in the stock market. Small-caps and mid-caps could feel it the most because they are still underperforming large-caps. A broad market correction would also weight on most sector and industry groups.
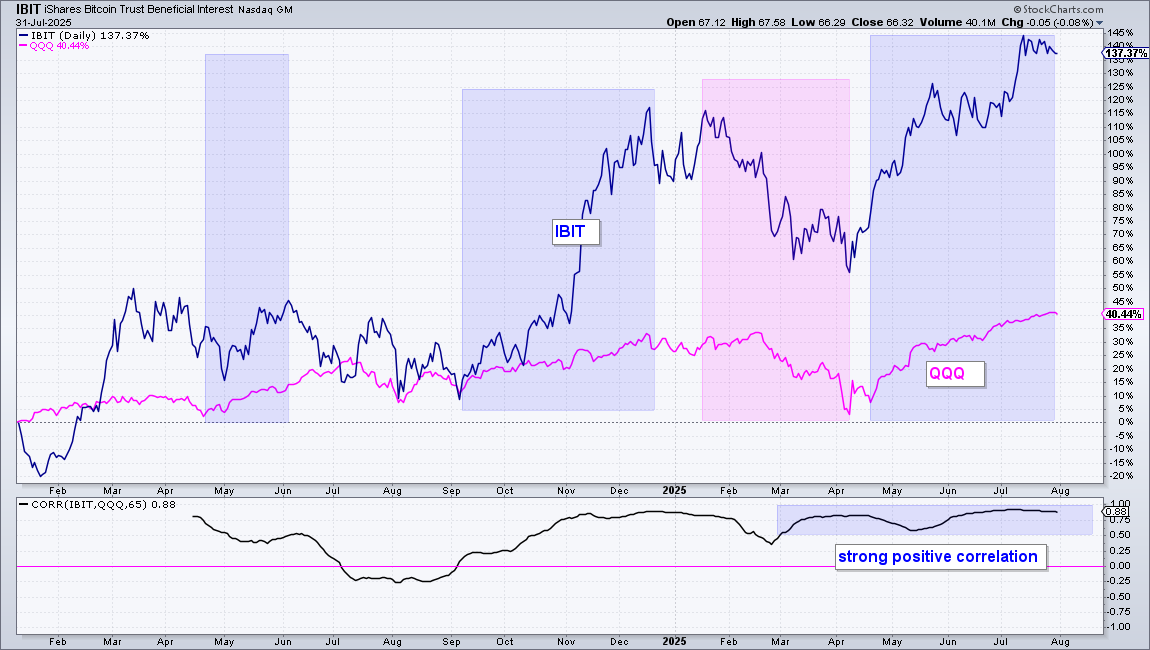
But what about equity alternatives, such as Bitcoin? For clues on Bitcoin, chartists can compare performance and use correlation analysis. The chart below shows the Price Performance for the Bitcoin ETF (IBIT) in blue and QQQ in pink. IBIT is the clear winner since January 2024 with a 137% gain. QQQ is up a meager 40% (LOL).
The indicator window quantifies this correlation using the Correlation Coefficient (65). This indicator was negative in July-August 2024, but positive since September 2024 and above .50 since March 2025. This shows strong positive correlation the last five months. IBIT and QQQ are risk-on assets that will likely rise and fall together.
IBIT Consolidates after New High
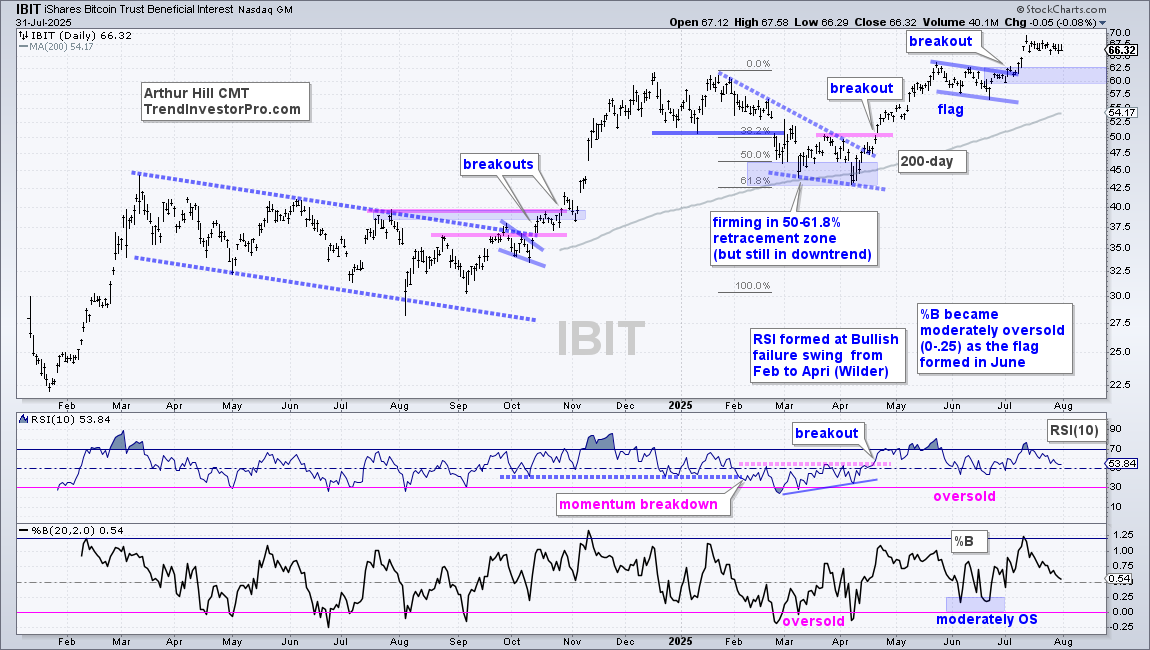
The Bitcoin ETF (IBIT) remains in a long-term uptrend with a new high in mid July and price well above the rising 200-day SMA. The ETF stalled the last few weeks with a high and tight pennant. I removed these lines because the pattern is too short and tight for my taste. The flag breakout around 60-62.5 turns into the first support zone to watch on a pullback. Below this level, the next support zone is near the rising 200-day SMA (54).
Send feedback to support(at)trendinvestorpro.com or use the contact form.