Report Headlines
- SPY Surges to a New High
- What is %B?
- QQQ Extends on Triangle Breakout
- IJR Tests Broken Resistance (plus MDY)
- Bank SPDR Holds Gap-Surge
- Cybersecurity ETF Falls back to 50-day SMA
- Robotics & AI ETF Holds Breakout
The next report will be posted on Friday morning, November 22nd.
I am going to mix it up today and post part of the Friday report. This report will cover the major index ETFs (SPY, QQQ, MDY and IJR). Financials are a key driver for small-caps and I will show a leading uptrend in the Bank SPDR (KBE). We will then cover the breakout in the Robotics & AI ETF (BOTZ) and the pullback in the Cybersecurity ETF (CIBR). I will post the rest of the commentary on Friday, along with a complete video.
You may also notice that I am using charts from StockCharts again. While Amibroker makes fine charts, they are not as versatile as StockCharts when it comes to ChartLists, annotations and layouts. I will continue to use Amibroker for the systematic strategies and custom indicator development. StockCharts will become my main charting platform for annotated charts. Each chart image is linked to a corresponding SharpChart.
The broad market environment remains bullish. I am not going to show the breadth and yield spread charts because nothing has changed here. There are links to these charts just below. More than 60% of S&P 500 and Nasdaq 100 stocks are above their 200 and 150-day SMAs. The BBB and Junk bond spreads fell sharply from early August to mid November and remain near their lows. Long-term breadth is net bullish and there are no signs of stress in the credit market. I will review the major index ETF charts next.
SPY Pulls Back after New High
There is no change with the SPY chart, except some normal volatility over the last three weeks. The cup-with-handle is the most recent medium-term pattern and SPY broke out with a move to new highs in mid September. There was a small throwback to the breakout zone (blue shading) at the end of November and then the post-election surge to 600. SPY then fell sharply last Thursday-Friday, but I view this as short-term noise within a long-term uptrend. First support is marked in the 560-570 area. A pullback to this level and a oversold condition would provide a short-term setup.
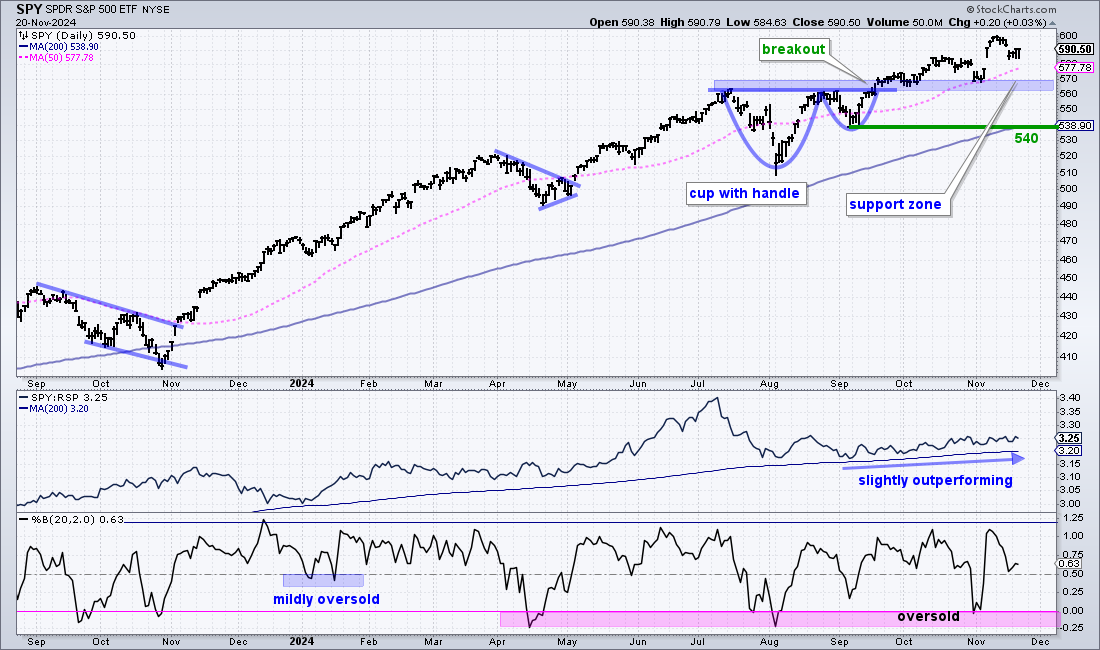
Long-term, I am using the September low and 200-day SMA to mark key support at 540. The first indicator window shows the SPY/RSP ratio holding above its 200-day SMA and rising since September. The bottom window shows %B, which becomes oversold with a dip below zero (pink shading). There were three oversold readings since mid April. Sometimes, we do not get a true oversold reading and have to settle for a mild oversold readings. This occurs when %B dips into the .25-.50 zone (see January 2024).
How to Use %B for OB and OS
%B tells us where price is relative to the Bollinger Bands (20,2). %B (20,2) is above 1 when the close is above the upper band, and below zero when the close is below the lower band. Mostly, I use %B to find oversold conditions within a long-term uptrends. For overbought conditions, I set the bar high by requiring a move above 1.20 (blue line). The middle window shows six dips below zero since September 2023 (pink shading). A dip below zero means SPY is oversold and traders should be on alert for a bounce.
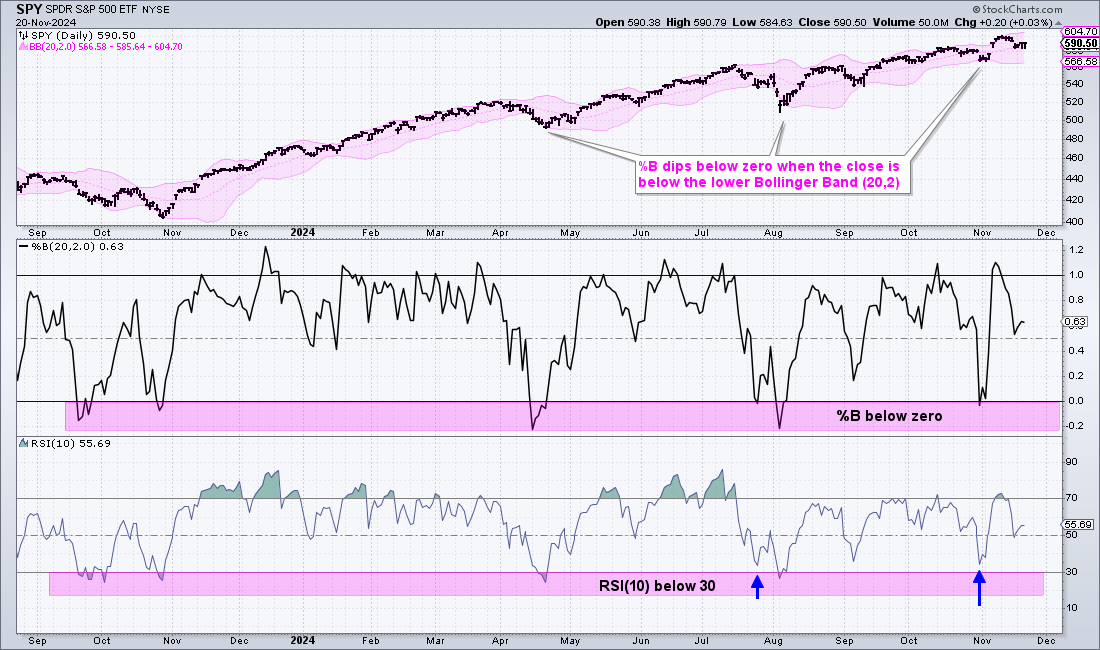
%B works similar to RSI(10), which is in the lower window. A %B dip below zero usually, but not always, coincides with an RSI dip below 30. RSI did not dip below 30 in late July and late October (blue arrows). I use RSI a lot, but %B is perhaps just as good and it is easier to read when using SharpCharts. This is because the %B scale adjusts to the range, while the RSI scale is fixed (0 to 100). RSI rarely dips below 10 or above 90 so the regions between 0-10 and 90-100 are wasted space.
QQQ Extends on Breakout with a Choppy November
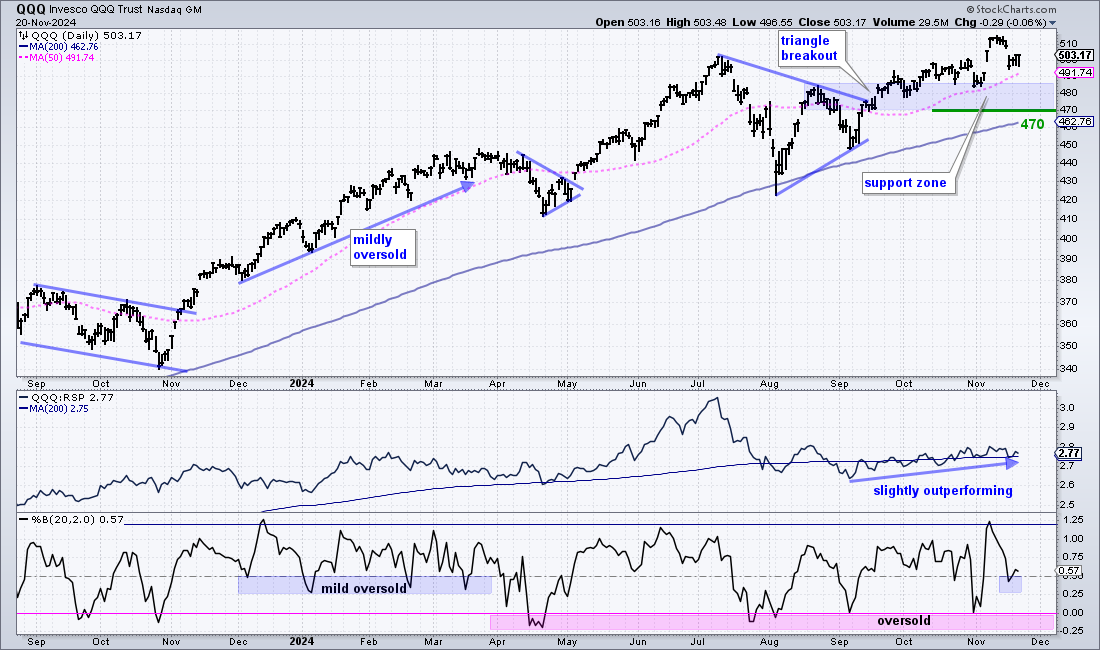
There is no change for QQQ, except the noise of the last few weeks. The long-term trend is up and the ETF formed a large triangle consolidation within this uptrend. QQQ broke out with a surge in mid September and then worked its way higher, hitting a new high in early November. Thus, the triangle breakout is the active pattern right now. The breakout zone and October lows combine to mark support in the 470-480 area. The indicator window shows QQQ slightly outperforming RSP since September. %B became mildly oversold with a dip below .50 this week, but I do not view this as a robust oversold setup. Instead, I would wait for a price dip into the support zone and a %B dip to the zero area.
IJR Tests Broken Resistance
There is a lot of chatter regarding small-caps and financials the last few weeks. These two go hand-in-hand because the financials sector is the largest (19.88%) in the S&P SmallCap 600 SPDR (IJR). Technology accounts for just 10.76%. Note that I prefer IJR over the Russell 2000 ETF (IWM) because IJR holds higher quality companies that must pass a fundamental screen. IWM is just a collection of the 2000 smallest stocks in the Russell 3000 index.
Funnimentals aside, the chart below shows IJR with a surge in November-December and a very choppy uptrend in 2024. The ETF held above the 200-day SMA the entire year and produced three triangle breakouts along the way. IJR returned to the triangle lows after the first two breakouts and held the mid September triangle breakout by establishing support in the 112-115 area. Most recently, the ETF broke out with a post-election surge and then returned to the breakout zone with a throwback to the 117-120 area. This area turns into the first support zone to watch for firming and a bounce.

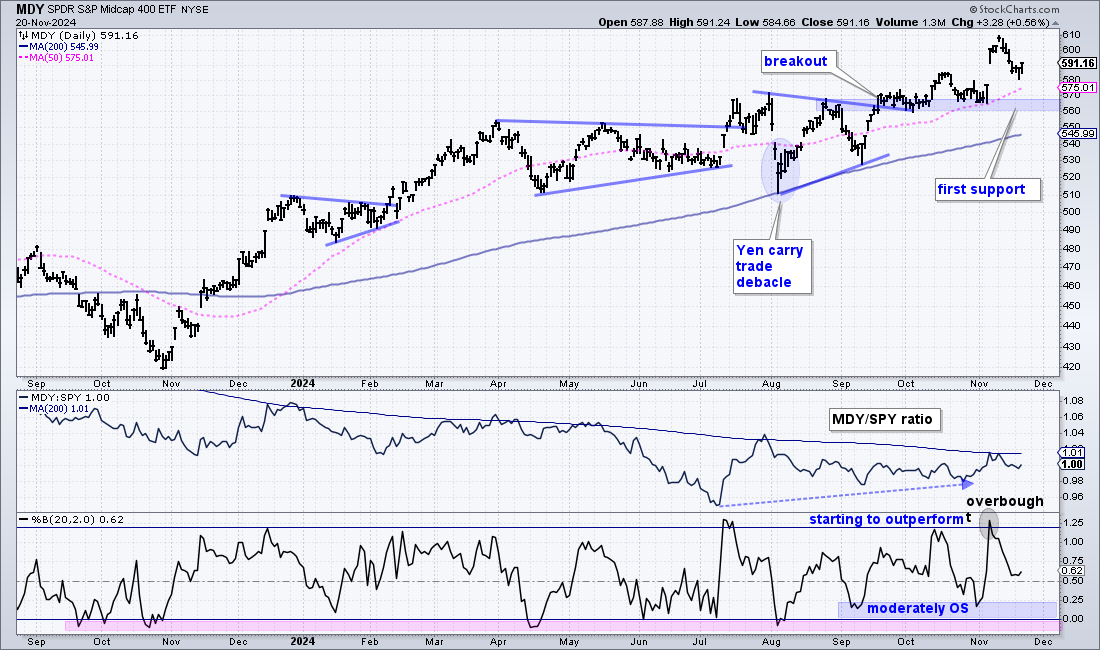
The next chart shows the S&P MidCap 400 SPDR (MDY) with a triangle breakout in mid September and the breakout zone turning into first support. After testing this zone in late October, MDY surged to new highs after the election. This surge is just an extension of the existing uptrend and mid September breakout. MDY became short-term overbought with post-election surge as %B exceeded 1.20. The subsequent pullback over the last seven days alleviated this overbought condition.
Bank SPDR Holds Gap-Surge
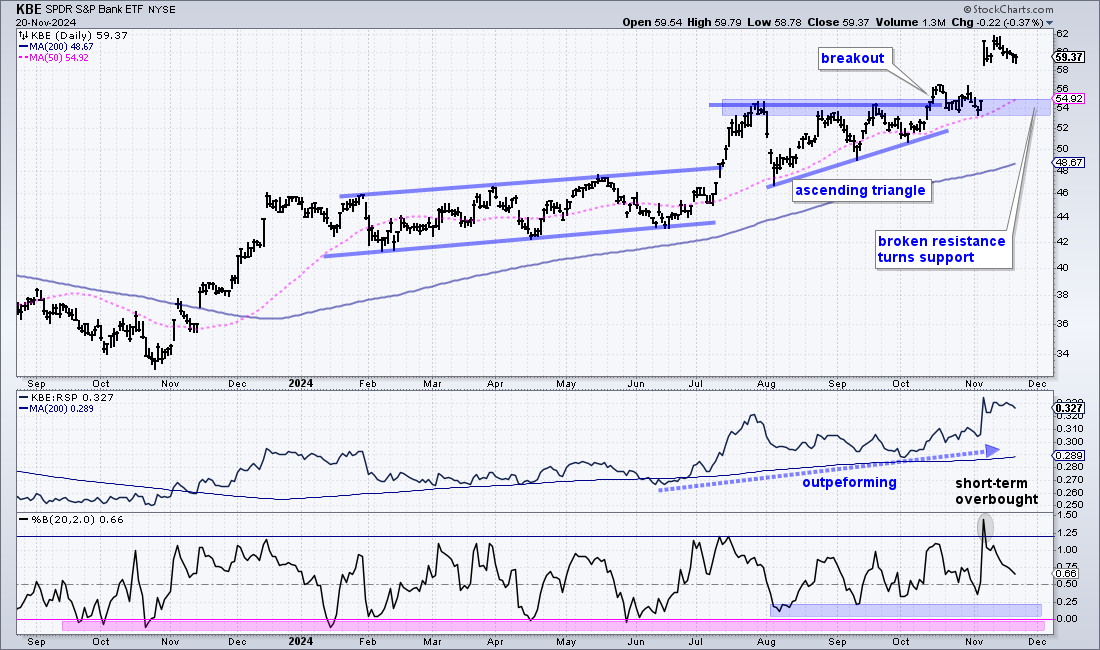
The Bank SPDR (KBE) is an equal-weight bank ETF with over 90 stocks, which makes it a great representative for the group. KBE surged with the market in November-December and then worked its way higher the first six months of 2024. After a surge in July, an Ascending Triangle formed and KBE broke out in mid October. The ETF stalled around the breakout zone and then surged 12% on November 6th. This surge shows strong buying pressure, but it pushed %B well above its overbought level (1.2). KBE has since worked off these overbought conditions with a consolidation since the 12% surge. I do not see a setup on this chart, but banks are strong and leading, and this is positive for small-caps.
Cybersecurity ETF Falls back to 50-day SMA
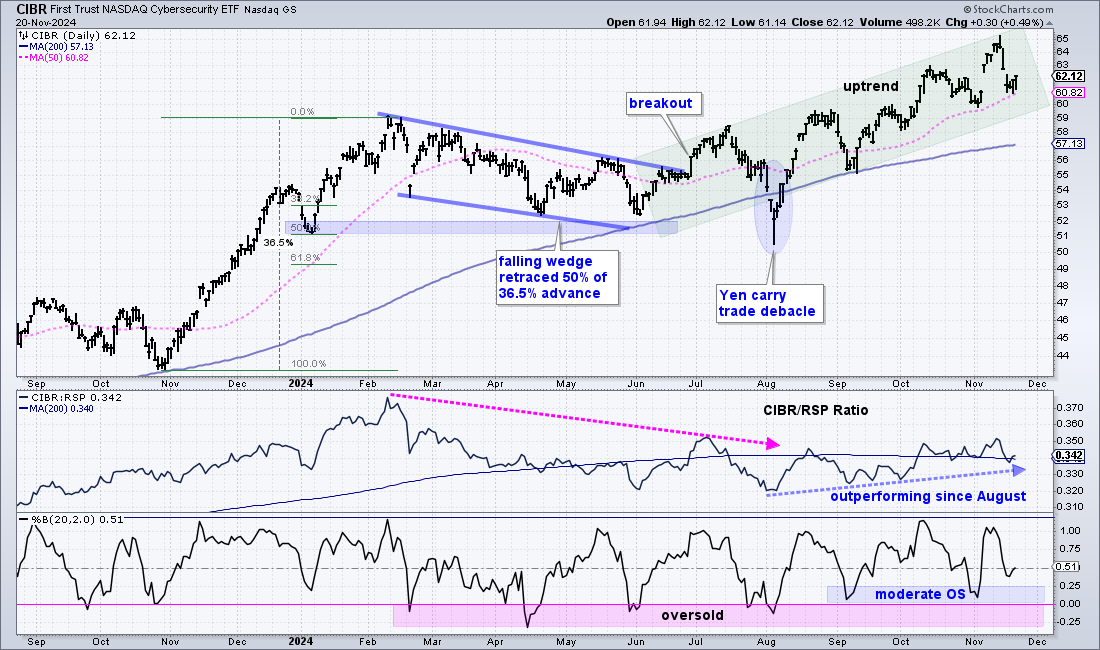
The Cybersecurity ETF (CIBR) remains in a steady uptrend and recently fell back to its 50-day SMA to become mildly oversold. As noted previously with RSI, there are shades of oversold with %B. The .25-50 zone is mildly oversold, the 0-.25 area is moderately oversold and below 0 is oversold. Sometimes we do not get clear oversold readings in strong uptrends. This is when we must settle for mild and moderately oversold conditions. Personally, I prefer at least a moderately oversold condition.
The chart below shows CIBR working its way higher since the late June breakout. Note that I am ignoring the early August plunge, which was brought on by the Yen carry trade debacle. CIBR became fully oversold in late July and early August as %B dipped below 30 (pink shading). Since then it has only become moderately oversold with two dips into the 0-.25 area (blue shading). This week it became mildly oversold with a dip into the .25-.50 area. The price chart, CIBR also fell back to the 50-day SMA and lower end of the gap zone. This is an area to watch for a bounce and resumption of the bigger uptrend.
Robotics & Artificial Intelligence ETF Holds Breakout
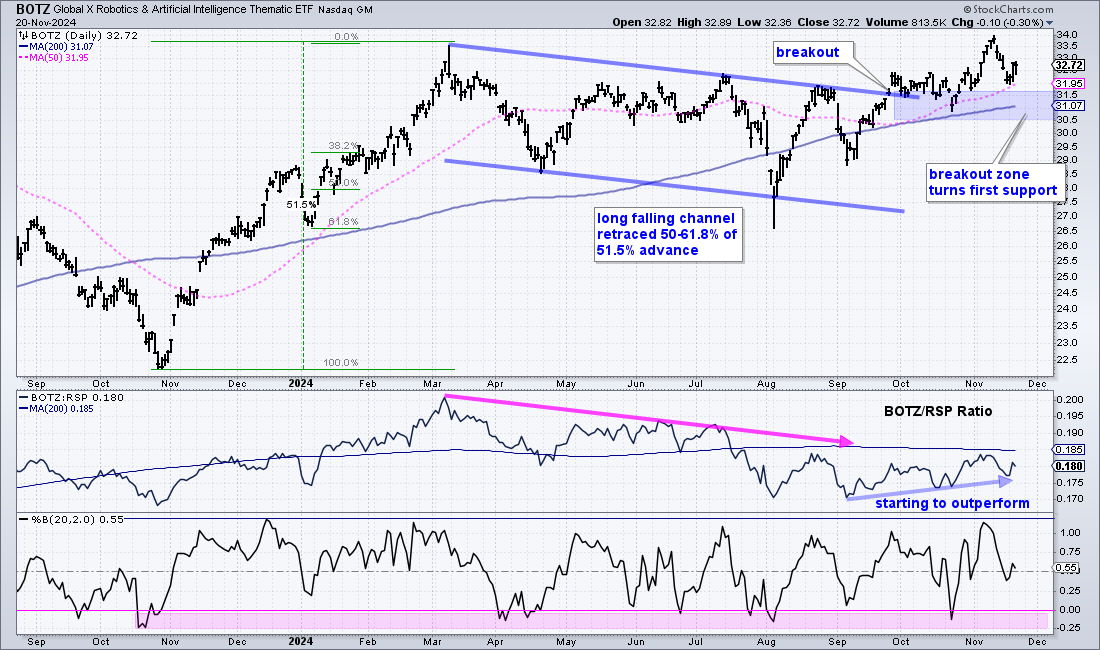
The Robotics & Artificial Intelligence ETF (BOTZ) remains on the radar because it is still trading in the vicinity of its breakout. Long-term, BOTZ advanced around 51.5% and the retraced 50-61.8% with a long falling channel (6-7 months). The channel certainly overstayed its welcome, but still looks like a normal correction after the 51.5% advance. Both the pattern and the retracement amount are normal for corrections after big advances. More important, BOTZ broke out in late September and the breakout zone turned into a support zone (blue shading). BOTZ is holding the breakout and I view it as bullish. A close below 30 would argue for a re-evaluation.