The usual disclaimers apply for the strategies and the analysis on TrendInvestorPro. Past performance does not guarantee future performance. You and you alone are responsible for your investment and trading decisions. Do your own due diligence.
Performance Metrics for RO-Investor-SPX (last close: 31-Dec-24)
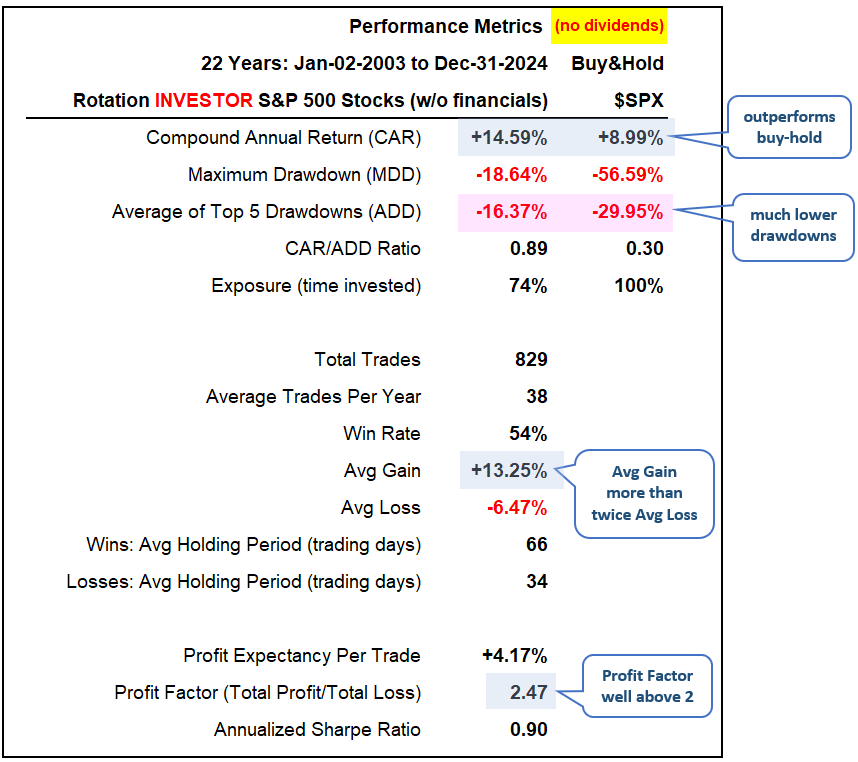
The table below shows performance metrics for the S&P 500 Rotation Investor Strategy (RO-Investor-SPX) and $SPX buy-and-hold. The strategy outperformed buy-and-hold with a significantly higher Compound Annual Return (CAR): +14.59% vs +8.99% (blue shading). Just as important, the strategy’s Maximum Drawdown (-18.64%) was a third that of buy-and-hold (-56.59%) and the Average Drawdown was around -16.5% (pink shading). Clearly, risk (drawdown) is being appropriately rewarded (return).
The strategy had a long-term Win Rate of 54%, which means 46% of the trades resulted in losses. The average gain (+13.25%) was more than twice the size of the average loss (-6.47%). This Win Rate and strong Gain/Loss ratio combined to produce a Profit Factor of 2.47, which means the strategy earned $2.47 profit for every $1 loss.
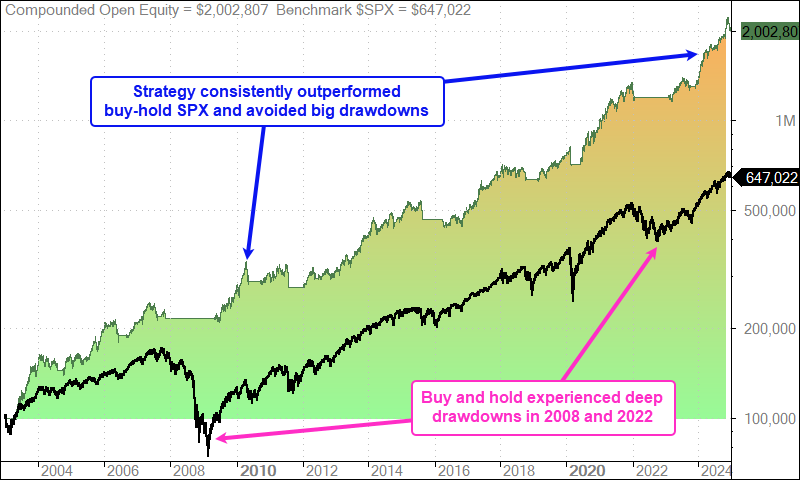
The chart below shows the equity curves for the strategy (green line) and for S&P 500 buy-and-hold (black line). The equity curve for the strategy surged in 2024 and finished the year above the $2,000,000 mark. Overall, the strategy outperformed by almost tripling ending equity for $SPX buy-and-hold. Also note that $SPX buy-and-hold experienced large drawdowns in 2008 (-56%), 2020 (-34%) and 2022 (-25%). Notice how $SPX buy-and-hold (black line) went below the starting capital as it dipped below $100,000 in 2008. The strategy mitigated drawdowns and preserved capital by using the SPX Breadth Model to time the market and avoid the bear markets.
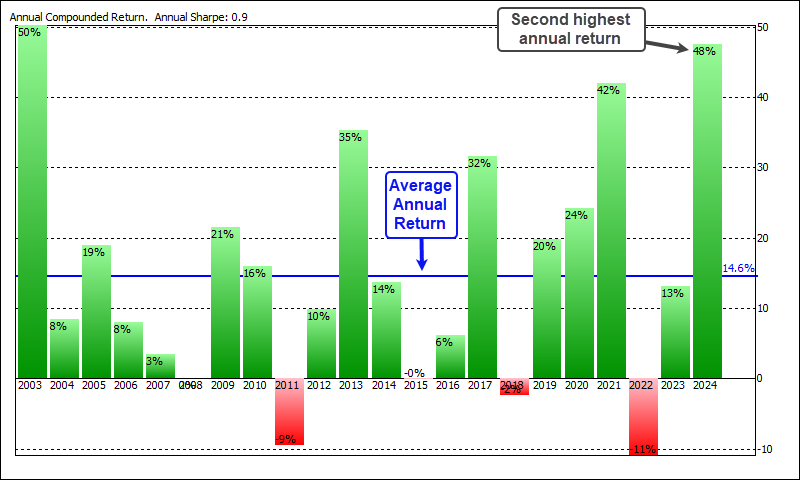
The next image shows the annual returns for the strategy. 2024 was the second best year since 2003 and the fifth year with 30+ percent gains. Over the last 22 years, there were 3 losing years, 17 winning years and two flat years (2008 and 2015). The strategy was in cash throughout 2008 because the SPX Breadth Model was bearish and the strategy was down .10% in 2015. Note that these returns do not include dividends or interest earned on cash. The average return over the entire period was +14.6% per year (blue line) and the Annual Sharpe Ratio was .90, which means risk is commensurate with reward.
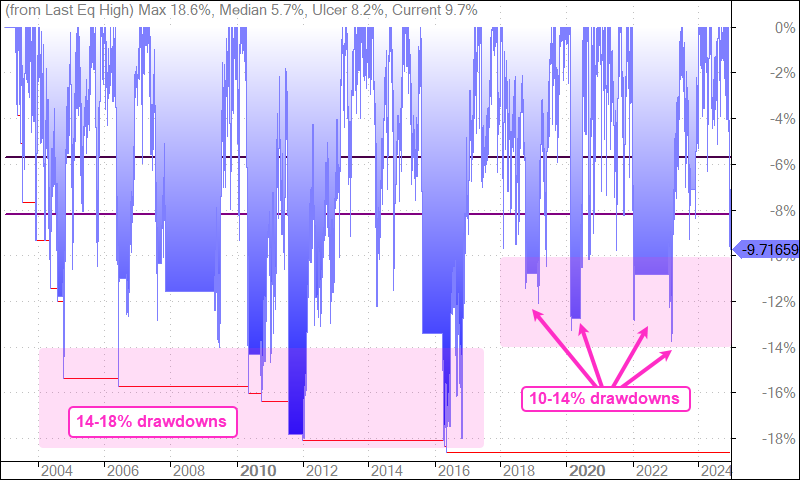
The next image shows the drawdowns over the entire period (blue line). Drawdown is the percentage decline from an equity high. Even though the equity curve and annual returns look good, there will be drawdowns and doubts along the way. The last double-digit drawdown was in 2022 (-13%) and the strategy ended 2024 with a 9.71% drawdown. We have not seen a drawdown greater than 14% since 2016, but that does not necessarily signal the end of big drawdowns.
Rotation Investor for S&P 500 Stocks (RO-Investor-SPX) went live on November 11th, 2024. These performance metrics reflect backtest results for continuous trading since 2003, including hypothetical trades before November 11th. The strategy produced solid gains from November 1st to November 10th, edged higher from November 11th to 30th and then took a hit in December. Since going live, RO-Investor-SPX gained 1.3% from November 11th to 30th, and took a hard hit in December (-10.6%) as the market swooned.
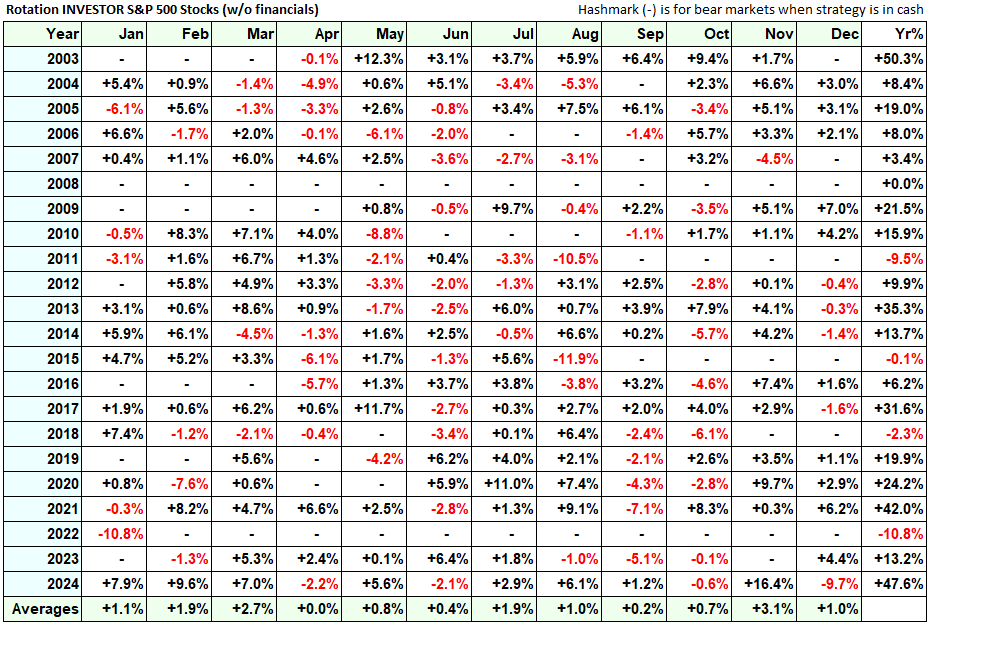
The next image shows the monthly return breakdown for the strategy. Hashmarks (-) show when the strategy was in cash because the SPX Breadth Model was bearish. 2022 was a down year because it started with a 10% loss in January. The strategy remained in cash the rest of the year because the SPX Breadth Model was bearish. The strategy finished 2024 with a monster gain (+47.6%) that was tempered by a sizable loss in December.
Testing Criteria
– Performance metrics are based on backtesting with historical constituents.
– Buy and sell signals are based on closing prices at the end of the week.
– Entries and exits are based on opening prices at the beginning of the week.
– Each buy/sell includes a .10% charge to account for slippage and commission.
– Each entry position is sized to be 1/10th of the portfolio
– The strategy holds a maximum of eight positions.
– Returns do NOT include dividends or interest earned from cash.
The usual disclaimers apply for the strategies and the analysis on TrendInvestorPro. Past performance does not guarantee future performance. You and you alone are responsible for your investment and trading decisions. Do your own due diligence.
We use cookies to understand how you use our site and to improve your experience. By continuing to use our site, you accept our use of cookiesOkPrivacy Policy

")