%Above SMA Indicators Reflect a Selective Bull Market
%Above 50-day SMA has Yet to Become Oversold
SPY Remains in Pullback Mode
QQQ Pulls Back with More Volatility
Small-caps Are Leading Lower (IWM)
S&P MidCap 400 SPDR Reverses Upswing (MDY)
Regional Bank and Retail ETFs Reverse Upswings (KRE)
Sector Declines Show Broad Participation
XLK Falls Sharply after Support Break
Healthcare SPDR Bounces off Breakout Zone (XLV)
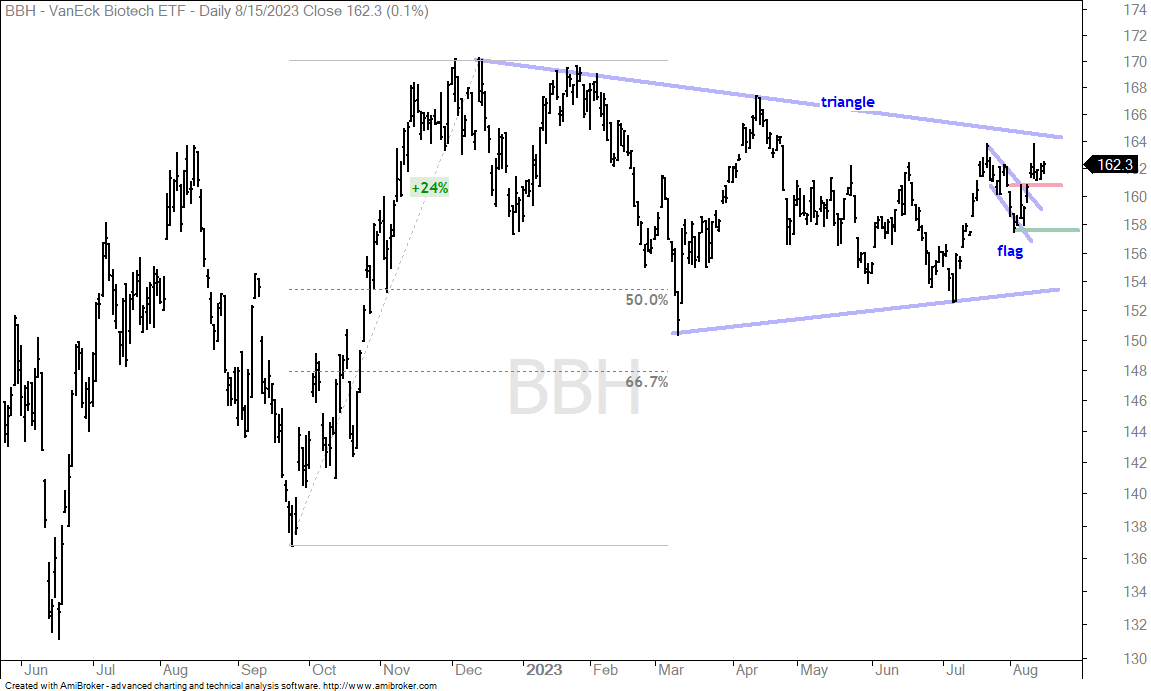
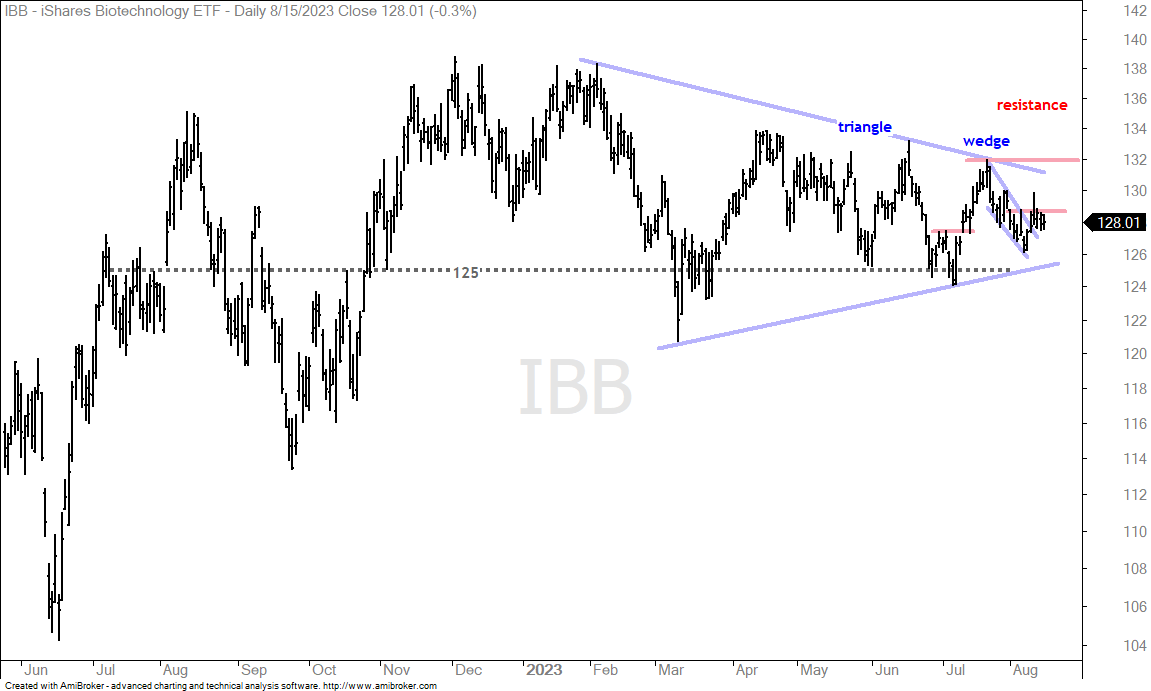
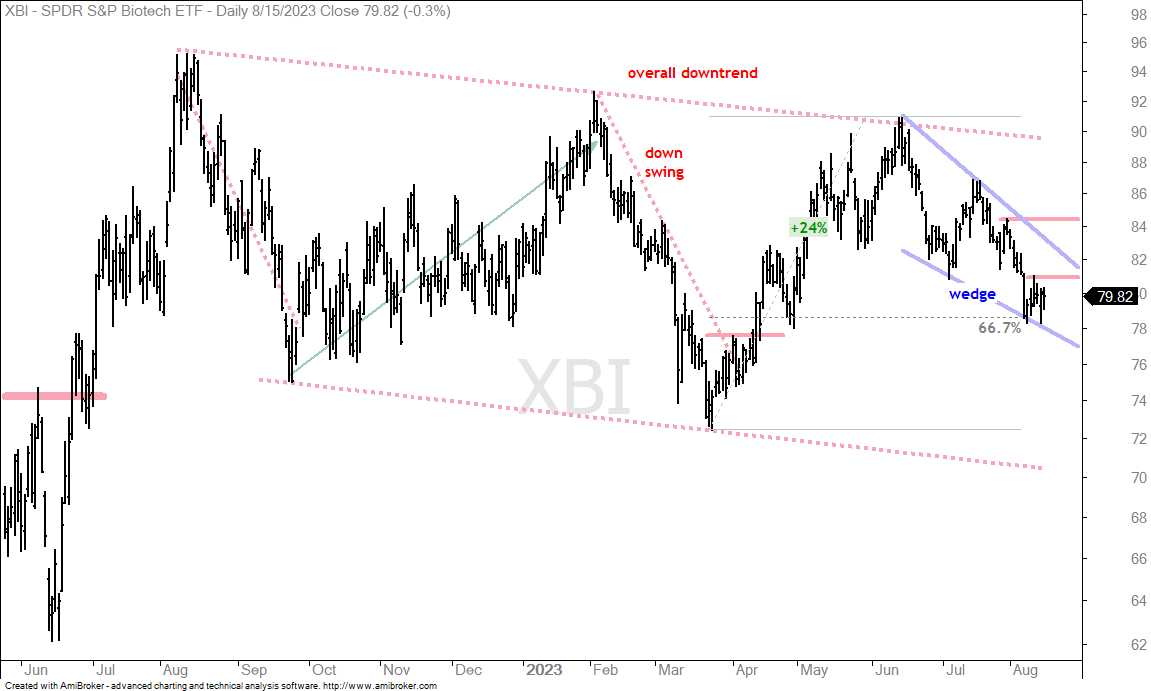
Biotechs Show Some Life (BBH, IBB, XBI)
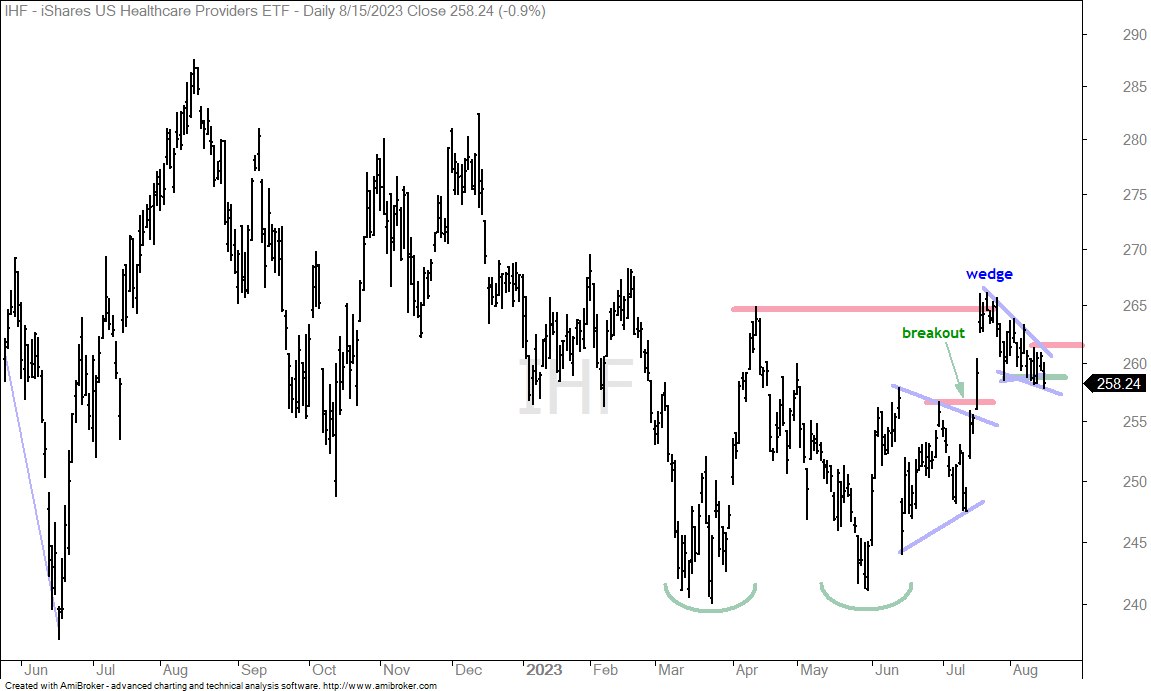
Healthcare Providers ETF Corrects with Small Wedge (IHF)
Medical Devices ETF Tests Support (IHI)
Home Construction ETF Holds Strong (ITB)
Copper Miners ETF Fails at Resistance (COPX)
20+ Yr Treasury Bond ETF Sinks (TLT)
Stocks are in pullback mode right now. We never know which pullback will extend far enough to result in a larger downtrend. Currently, the declines in SPY,QQQ and others look like pullbacks after big advances from May to July. There is, however, concern with recent reversals in retail (XRT) and banking (KRE). I would also note that the high-beta names are leading the way lower here in August. These include the Video Game eSports ETF (GAMR) -9%, the ARK Industrial Revolution ETF (ARKG) -8.7%, the Small-cap Tech ETF (PSCT) -8.2% and the Semiconductor ETF (SOXX) -8%. The market is shunning risk and this is a negative overall. The Composite Breadth Model remains bullish and yield spreads narrow. The bull market is still in place, but a correction is underway and key breadth indicators have yet to become oversold.
The next report will be posted on Friday, August 18th.
Weight of Evidence Bullish
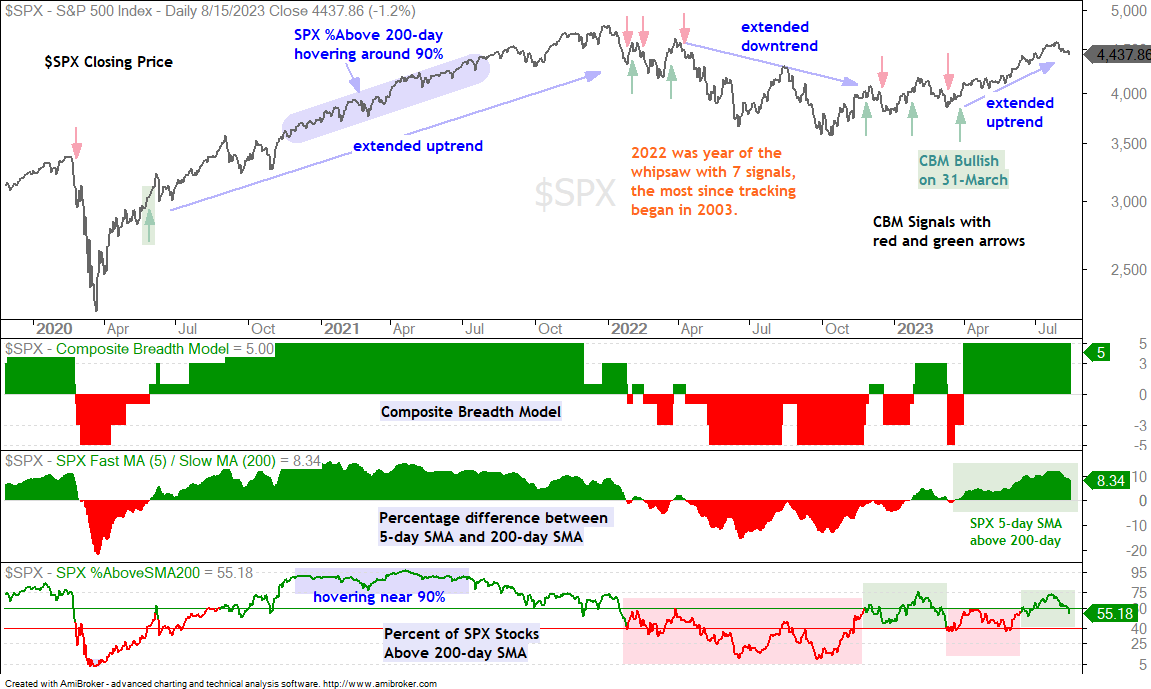
Overall, the weight of the evidence remains bullish for stocks. The Composite Breadth Model is positive (since March 31st), yield spreads show no stress and the 5-day SMA is above the 200-day SMA for $SPX.
%Above SMA Indicators Reflect a Selective Bull Market
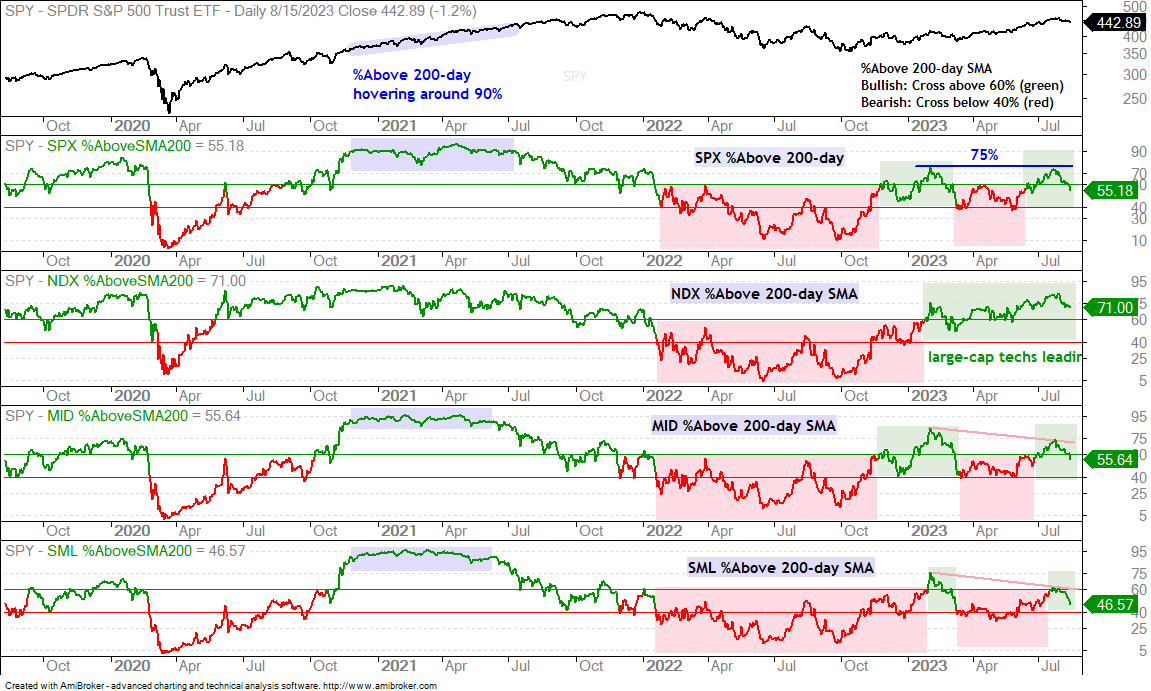
There are bull markets that lift all boats (broad) and there are bull markets that lift some boats (selective). The bull market from June 2020 to January 2022 had a period that lifted all boats. The chart below shows the percentage of stocks above the 200-day SMA for the S&P 500, Nasdaq 100, S&P MidCap 400 and S&P SmallCap 600. The blue shading shows when these indicators hovered near the 90% area (December 2020 to June 2021). This was a raging bull market that lifted all boats.
Note that the S&P 500 bottomed in March 2020 and 90% of S&P 500 stocks were above their 200-day SMAs within seven months (blue shading). More recently, the S&P 500 bottomed in October 2022 and the current advance is nine months old. SPX %Above 200-day peaked in the 75% area and never came close to 90%. This bull run is clearly more selective. The indicator is currently near 55% and this means 45% of S&P 500 stocks are below their 200-day SMAs. A split market. The red lines on SML and MID %Above 200-day SMA show the indicators peaking in early February 2023 and forming lower highs in July 2023. This means fewer stocks got back above their 200-day SMAs with the summer advance. Participation is narrowing.
%Above 50-day SMA has Yet to Become Oversold
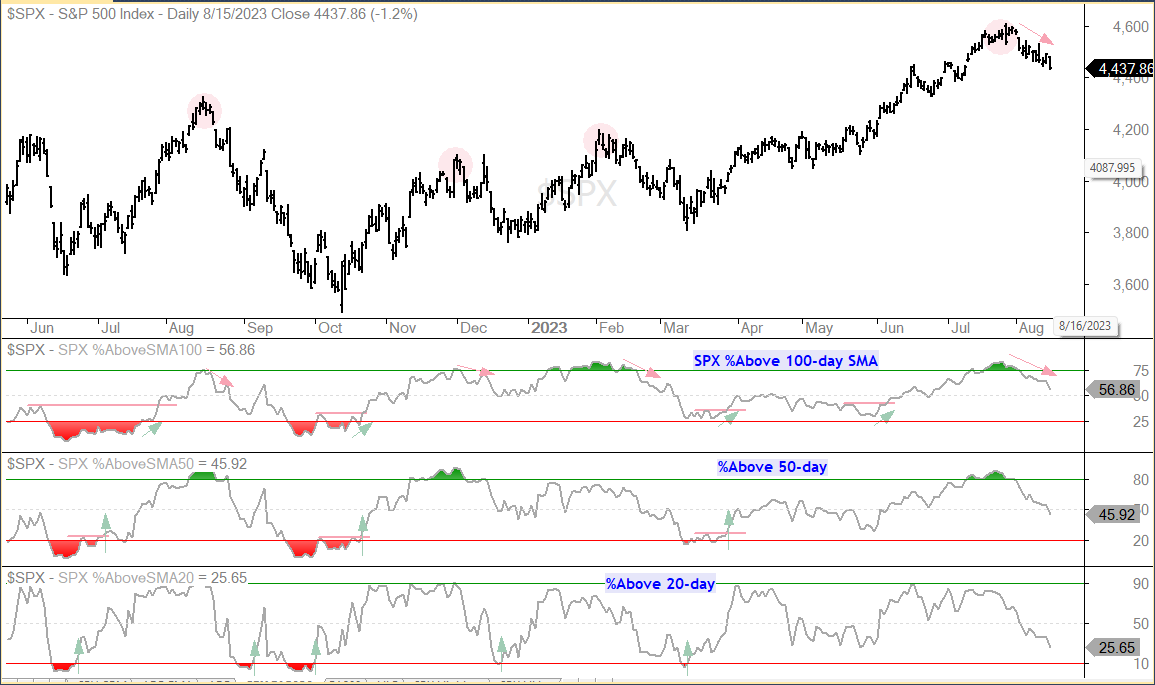
The next chart shows the SPX %Above SMA indicators with overbought and oversold levels. Overbought/Oversold are set at 75/25 for %Above 100-day, at 80/20 for %Above 50-day and at 90/10 for %Above 20-day. These levels are, of course, subjective. The first window shows SPX %Above 100-day with the green arrows marking upturns after pullbacks. I am basically watching for some sort of breakout after the indicator moves below 50%. A breakout is a move above a prior peak. The chart shows breakouts on 21-Jul-2022, 21-Oct-2022, 29-Mar-2023 and 7-Jun-2023. It is now time to let the pullback run its course and wait for a setup/breakout.
%Above 50-day and %Above 20-day are more sensitive and have a greater chance of reaching oversold levels. %Above 50-day shows these double dip breakouts. The indicator becomes oversold below 20%, moves above 20% and then back below 20% to form a peak. The subsequent break above this peak is the bullish signal (green arrows). %Above 20-day SMA becomes oversold below 10% and a move back above 10% signals an upturn. It is the most sensitive and the most prone to whipsaws. Personally, I would like to wait for %Above 50-day to dip below 20% before considering a setup.
SPY Remains in Pullback Mode
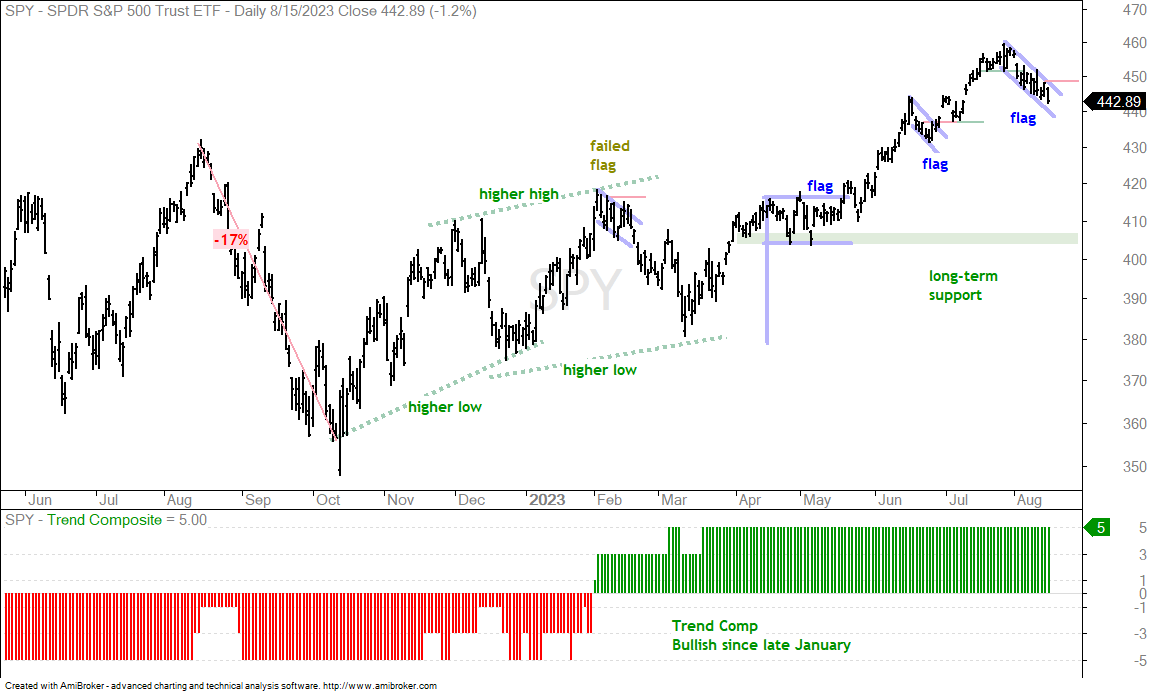
The price chart for SPY confirms what we are seeing with the %Above SMA indicators above. SPY is in pullback mode as it falls with a falling flag taking shape. Notice that this falling flag is rather orderly and narrow. With a decline on Tuesday, SPY hit a new low for the move, which began in on August 1st. Monday’s high now mark short-term resistance and a close above 448.11 would trigger a short-term breakout. Barring a breakout, the next signal to wait for is an oversold reading with the %Above SMA indicators.
QQQ Pulls Back with More Volatility
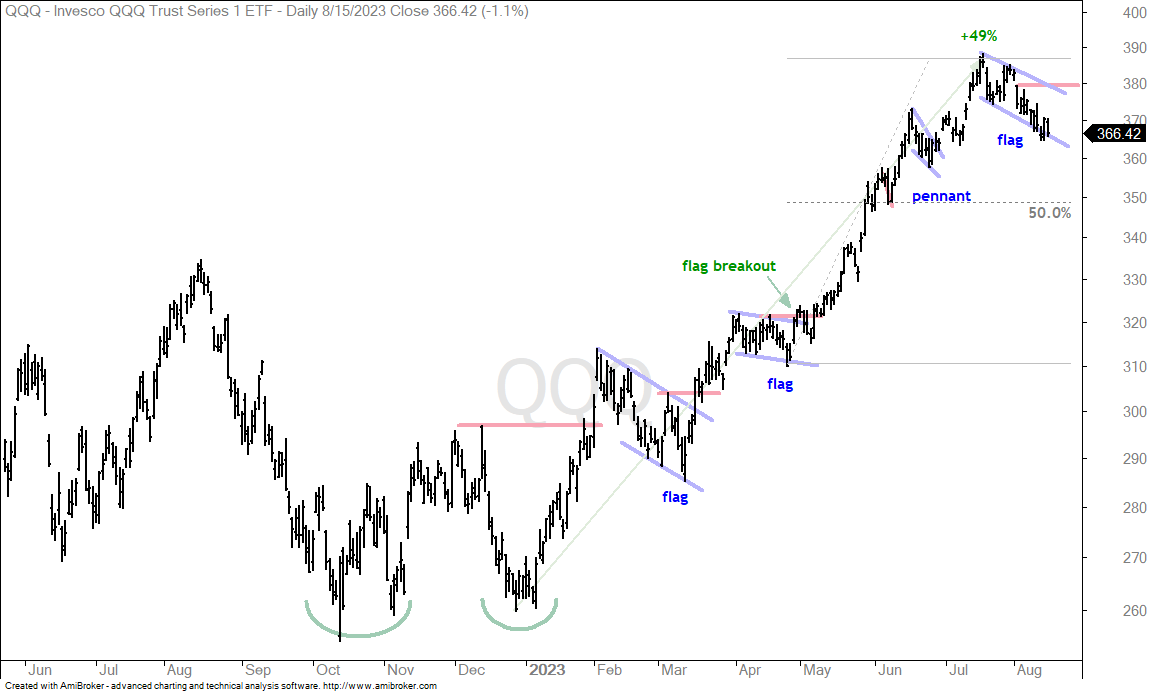
The next chart shows QQQ pulling back since July 19th, which means it started down almost two weeks before SPY. Whereas SPY has a nice tight falling flag, QQQ sports a more volatile decline with a sharp move lower the last two weeks. QQQ continues to lead lower and this is negative for the market because the former leader is now the laggard. Note that QQQ was up some 49% from late December to mid July, and up 24% from early May to mid July. The latter advance (24%) was pretty much straight up without a decent pullback. A 50% retracement of this advance would extend to the 350 area.
Small-caps Are Leading Lower (IWM)
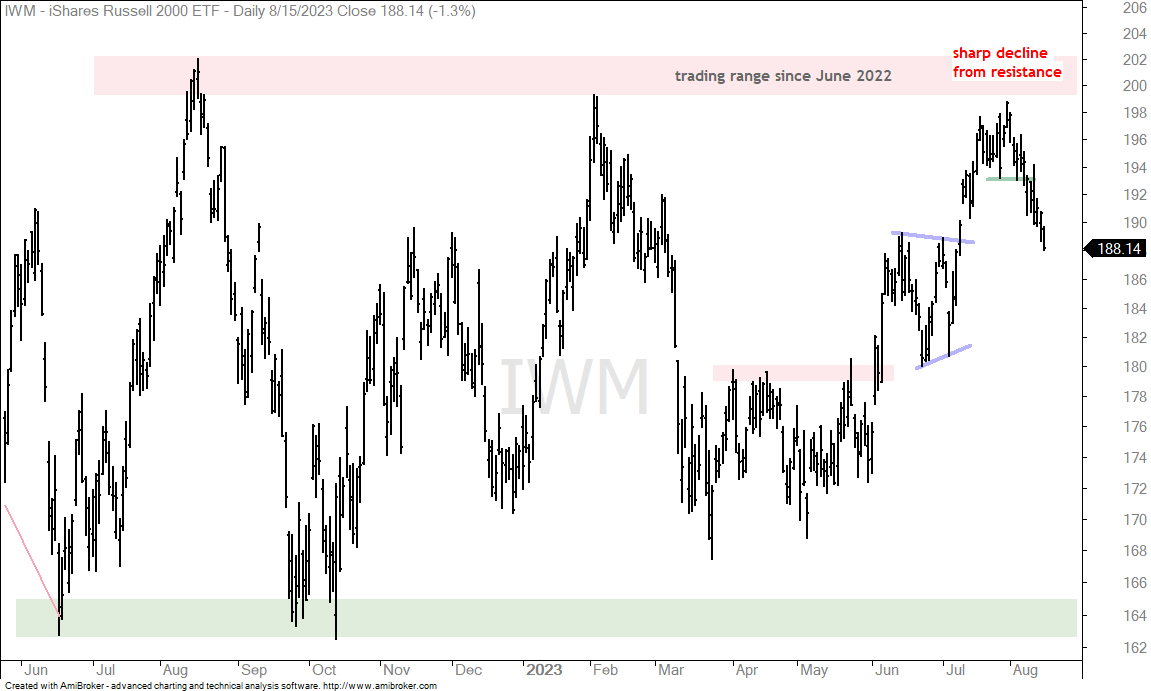
The Russell 2000 ETF (IWM) shows just how tough it’s been over the past year. IWM fell 33% from November 2021 to June 2022 and forged a 52-week low. The ETF then moved into a trading range with resistance in the 200-202 area and support in the 162-165 area. The swing within this range fell short of resistance and reversed with a sharp decline here in August. IWM broke short-term support and the swing is down. Here are some percentage declines over the last 11 days: IWM (-5.32%), QQQ (-4.50%), MDY (-3.60%) and SPY (-3.25%).
S&P MidCap 400 SPDR Reverses Upswing (MDY)
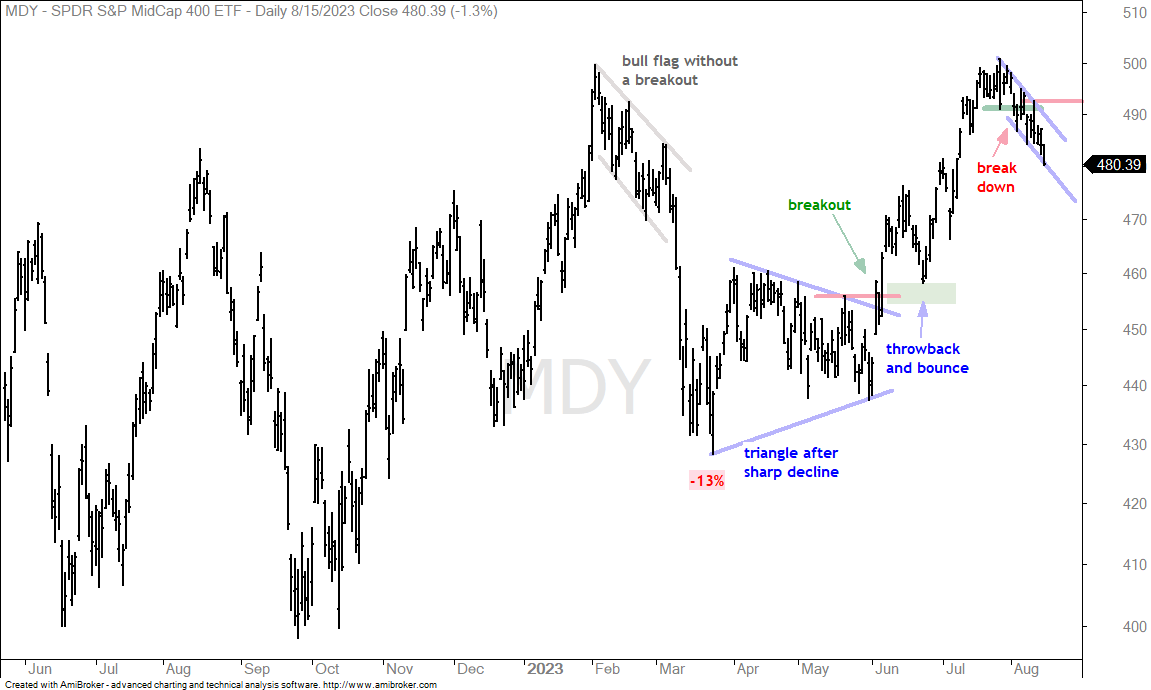
The next chart shows the S&P MidCap 400 SPDR (MDY) breaking short-term support with a sharp decline the last two weeks. Trends are not lasting very long these days and this means the swings matter. Notice that MDY hit a new high in February and then formed a nice falling flag. Instead of breaking out and continuing higher, the ETF plunged in March and required another two months to stabilize. Currently, MDY broke short-term support and the swing is down. Swings matter so be careful here.
Regional Bank and Retail ETFs Reverse Upswings (KRE)
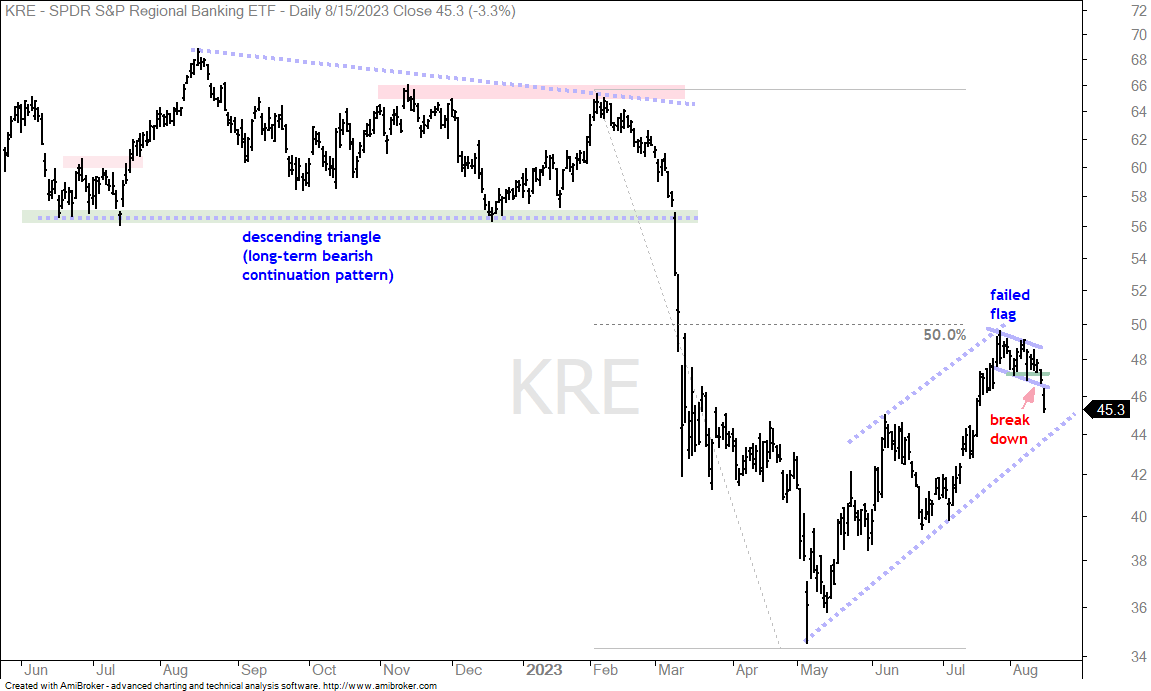
The Regional Bank ETF (KRE) was highlighted last week because it was holding up relatively well in early August. No more. KRE formed a small falling flag and this is a bullish continuation pattern. Instead of breaking out and continuing higher, the ETF broke support with a sharp decline the last two weeks. This calls for a redraw on the charts. Overall, KRE plunged to new lows in May and retraced 50% of this advance with a rising wedge/channel. This looks like a big counter-trend bounce. The failed flag and support break provide the first clues that the bigger downtrend is set to resume.
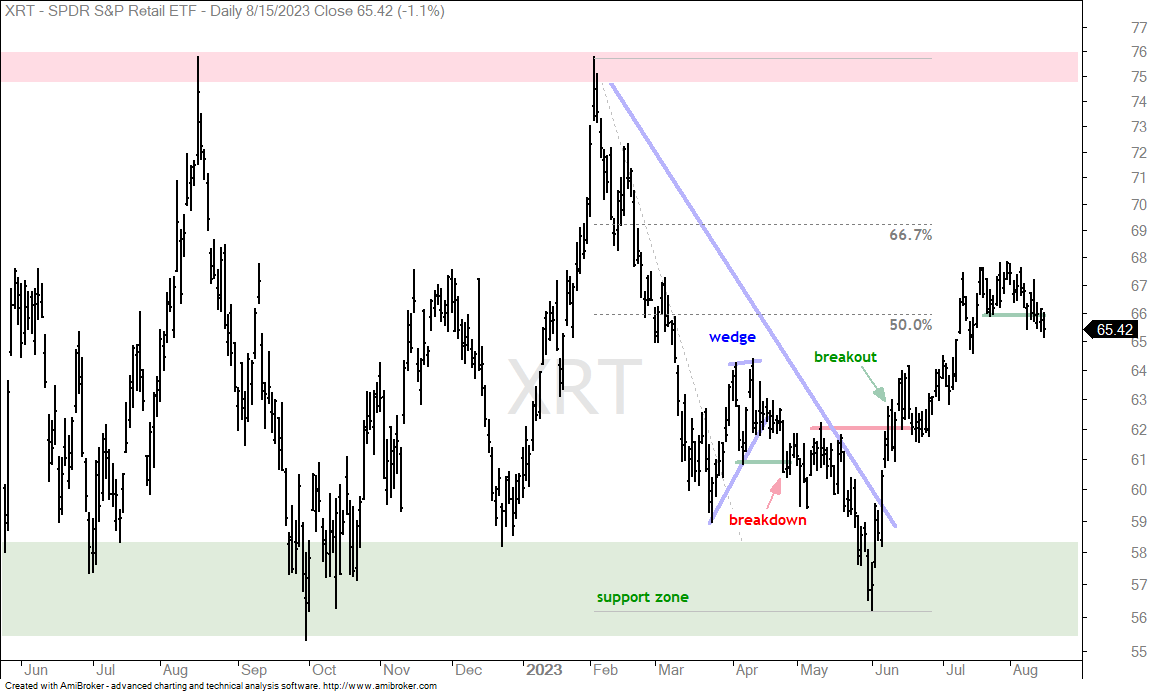
The next chart shows the Retail SPDR (XRT) looking a bit like the Russell 2000 ETF with a large trading range the last twelve months. XRT reversed the February-May downswing with a breakout in June. The summer advance, however, retraced 50-67% of the prior decline and XRT broke short-term support this past week. At the very least, the short-term swing is down. At worst, the bounce to the 67 area was just a counter-trend move and the short-term break down argues for a test of the big support zone (green shading).
Sector Declines Show Broad Participation
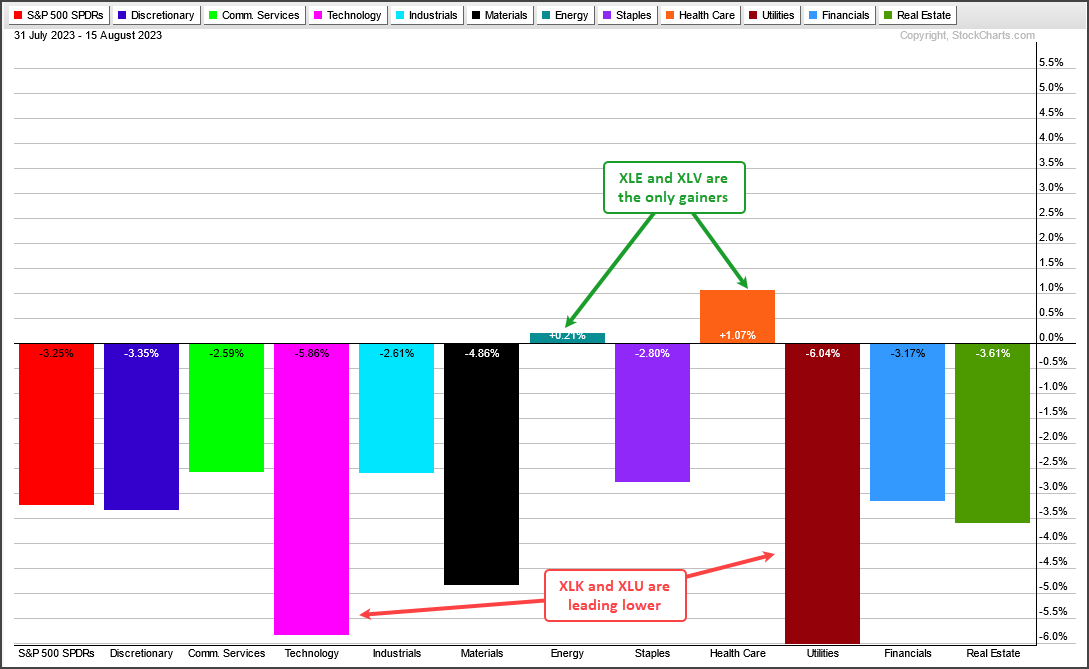
Nine of the eleven sectors are down in August with the Utilities SPDR (-6.04%) and the Technology SPDR (-5.86%) leading the way. So much for XLU being defensive. Perhaps high interest rates are taking a bite here. An upturn and breakout in TLT could be positive for XLU (note that TLT is covered later in this report). The sell off in August is broad and affecting most groups. The Energy SPDR (XLE) and the Healthcare SPDR (XLV) are the only sectors showing gains this month.
XLK Falls Sharply after Support Break
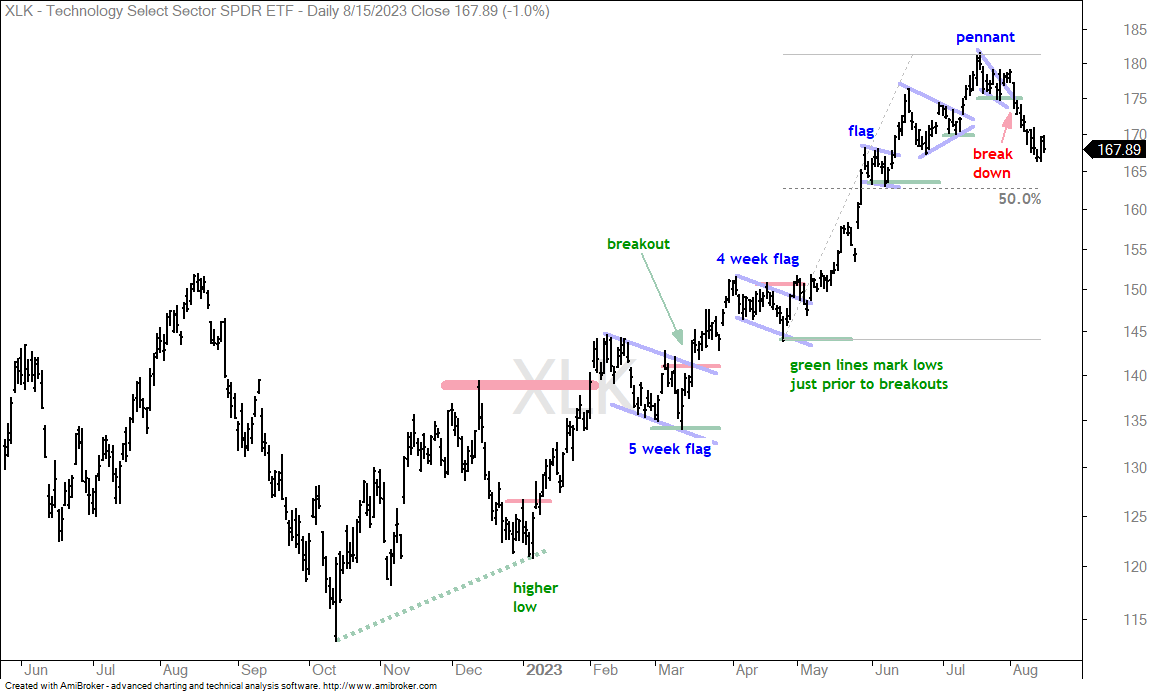
As long as QQQ and XLK are in pullback mode, I would expect the same from the tech-related ETFs (IGV, CIBR, FDN, IPAY, FINX, SOXX, SKYY). The tech sector is highly correlated and most techs will follow XLK. The earliest point to consider setups is when we start seeing oversold readings in SPX %Above 50-day SMA and NDX %Above 50-day SMA (<20%). Both are still above 40%. The chart below shows XLK with a pennant in July and a breakout that failed as the ETF broke short-term support (green line). This is the first time this year that a breakout failed to hold the low just prior to the breakout (green lines). The next support for XLK is in the 162-163 area (50% retracement and flag low).
Healthcare SPDR Bounces off Breakout Zone (XLV)
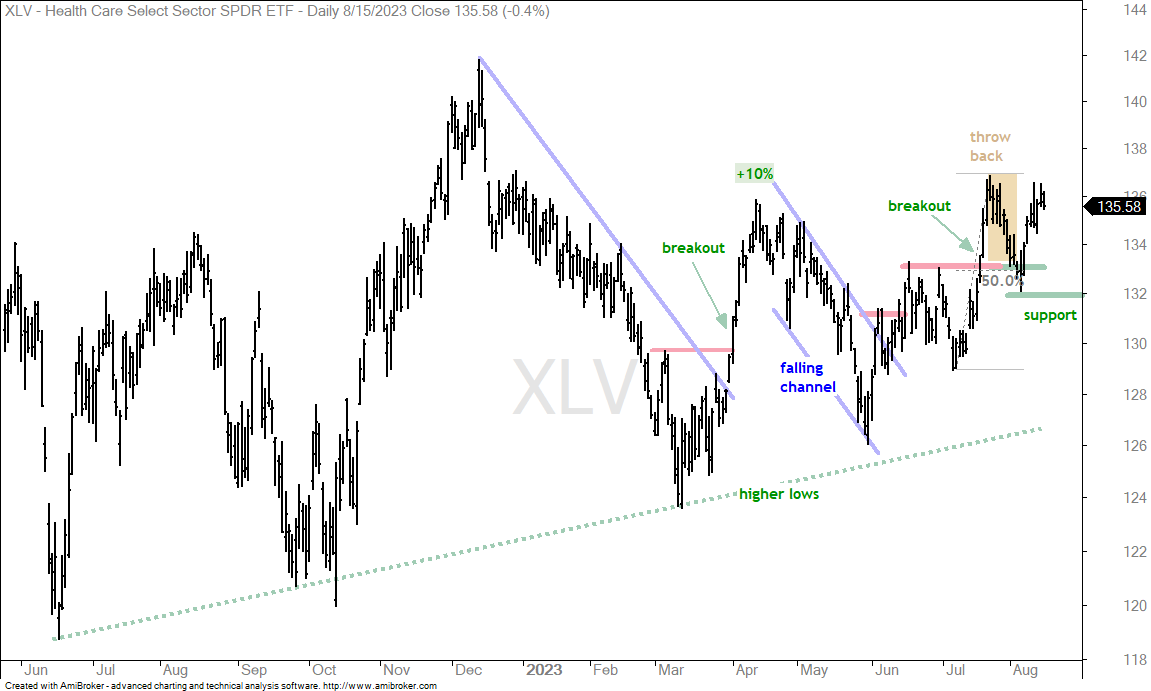
The next chart shows the Healthcare SPDR (XLV) breaking out with a surge in July, falling back to the breakout zone in early August and advancing the last seven days. There is a slight uptrend since June (green dashed line) and I will mark upswing support at 132.
Biotechs Show Some Life (BBH, IBB, XBI)
The next chart shows the Biotech ETF (BBH) with a 24% advance and a large triangle. This represents a consolidation after the advance or a bullish continuation pattern. There are swings within the pattern and I am seeing a flag breakout over the past week. Thus, the swing within the pattern is up. This increases the chances of a bigger triangle breakout and continuation higher. The flag lows mark first support.
The next chart shows IBB with a similar pattern. The ETF attempted a wedge breakout, but did not close above the red resistance line. A close above 129 would do the trick and the wedge low would then become support.
The next chart shows the Biotech SPDR (XBI) with a 24% advance and a larger falling wedge the last two months. The swing within the wedge is down with first resistance set at 81. A breakout here would reverse this downswing and increase the chances of a bigger breakout at 84.3.
Healthcare Providers ETF Corrects with Small Wedge (IHF)
The next chart shows the Healthcare Providers ETF (IHF) attempting a double bottom breakout, but failing to hold it and falling back. The decline looks like a small falling wedge (correction after surge). A breakout at 262 would be bullish.
Medical Devices ETF Tests Support (IHI)
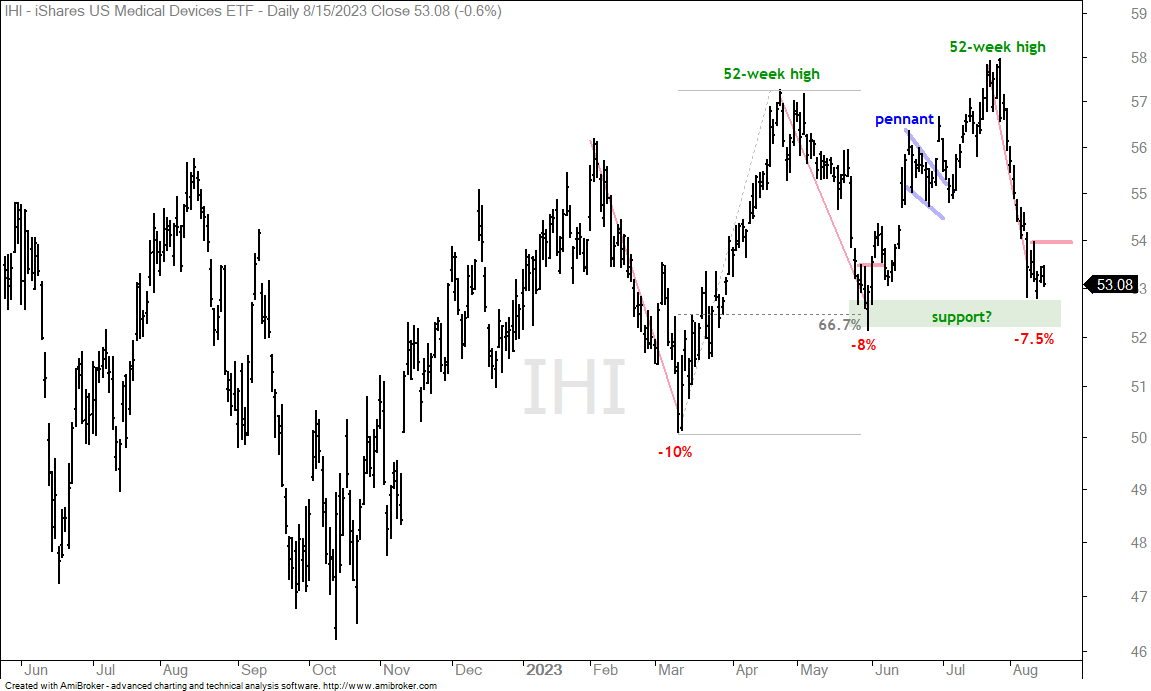
The next chart shows the Medical Devices ETF (IHI) falling sharply in August and testing support from the May lows. Overall, the chart still sports higher highs in May and August, as well as higher lows in March and June. IHI is oversold and at support, which is a setup for a bounce. The 10-Aug high marks resistance at 54 and a breakout here would reverse the downswing.
Home Construction ETF Holds Strong (ITB)
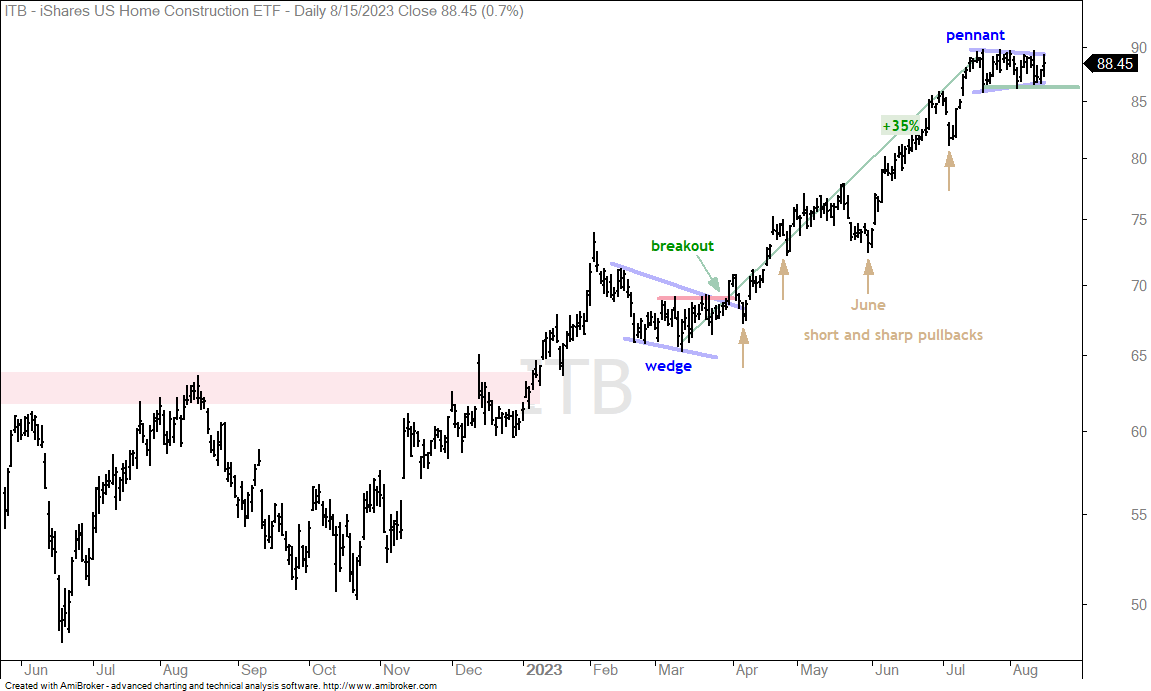
The 10-yr Treasury Yield is back above 10% and yet the Home Construction ETF (ITB) is holding up well here in August. ITB surged some 35% and then consolidated in August. This pennant represents a rest after the advance and a bullish continuation pattern. A breakout would be bullish. I will also be watching short-term support because a close below 86 would be short-term bearish. Given the broader market situation right now, I think the odds of a successful upside breakout are low.
Copper Miners ETF Fails at Resistance (COPX)
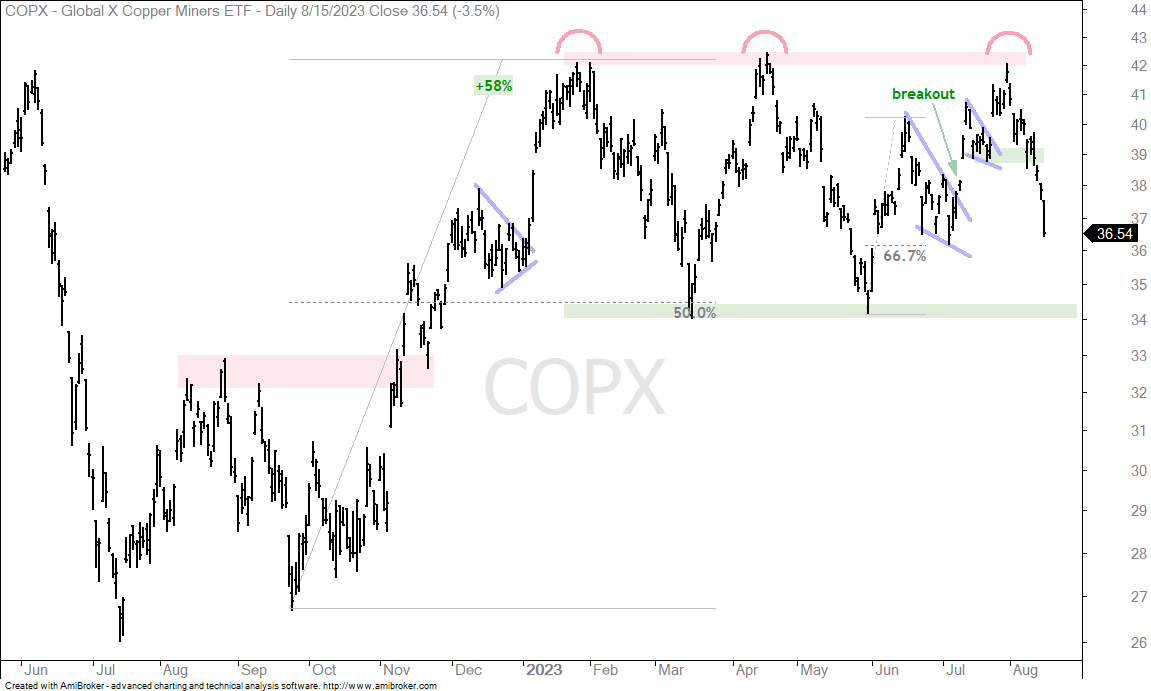
The Copper Miners ETF (COPX) was looking strong with the pennant breakout and resistance challenge in early August. This challenge failed miserably at the ETF broke support from the pennant lows. At best, the swing within the trading range is clearly down. At worst, COPX formed a triple top and a break below 34 would confirm this pattern. Weakness in COPX could also foreshadow weakening demand for copper and a slowing economy.
20+ Yr Treasury Bond ETF Sinks (TLT)
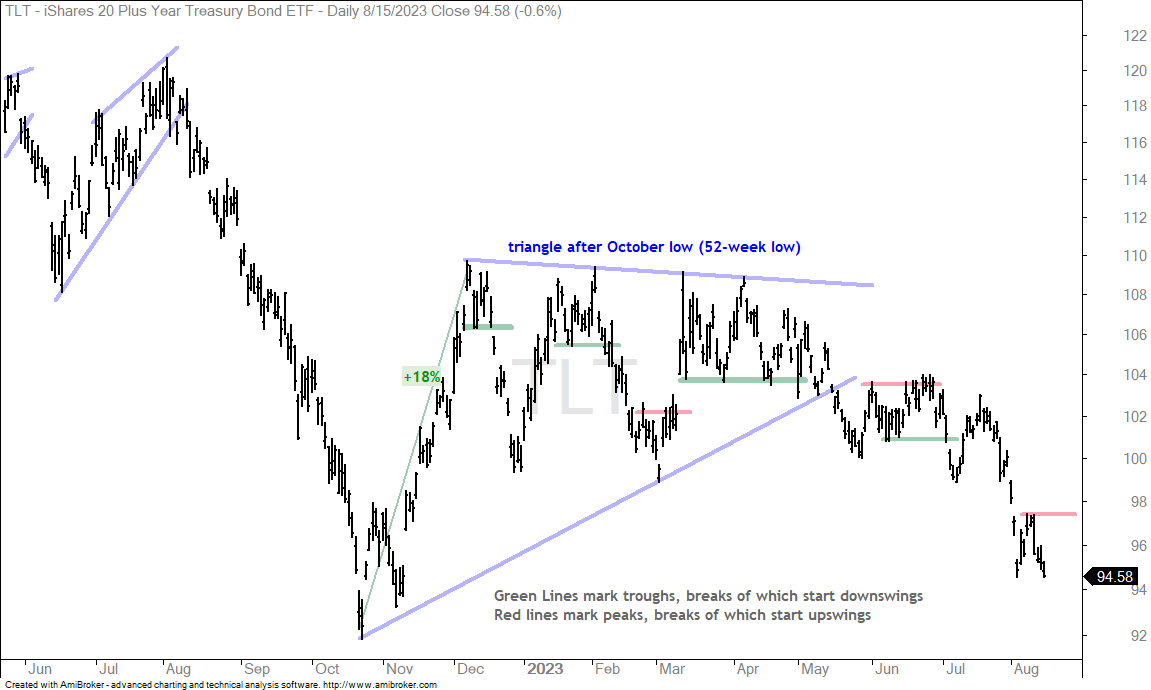
The 20+ Yr Treasury Bond ETF (TLT) surged some 18% into mid December and then moved lower the last nine months. It is one of the most unloved assets right now. The decline in TLT reflects a hawkish Fed and/or confidence in the economy. Overall, TLT fell to a 52-week low in October, formed a large triangle and broke triangle support in May. This signals a continuation of the long-term downtrend. Short-term, I am watching the resistance peaks (red lines) and support troughs (green lines). A break above the mid August high would reverse the current downswing and show money moving into safe-haven bonds. This could be negative for stocks because an upswing in bonds would suggest less confidence in the economy.