Note that I will be on vacation the first week of July (3 to 7). There will be no reports this week, but I will update the signal tables on July 4th, 6th, 7th and 8th. The exchanges are closed on Tuesday, July 4th.
Thursday, June 29th: SPX/NDX Rotation Strategy Table
July 3rd to July 7th: No reports.
Tuesday July 11th: Introduction to Mean-Reversion Strategies
Wednesday July 12th: Market/ETF Report and Video
Thursday July 13th: Diving Deeper into Mean-Reversion Strategies
The next step is to develop a mean-reversion strategy, which will be introduced later in July. I already have a working mean-reversion strategy, but I would like to further test and develop it. Strategy development takes time with lots of trial and error.
Video and Report Headlines
Weight of Evidence Bullish, but Market is Still Split
Yield Spreads and Balance Sheet Show No Stress
S&P 500 and Nasdaq 100 Stocks Dominate New High List
Most Uptrends are within the Nasdaq 100 (%Above 200-day SMA)
SPY Pulls Back after Sharp Advance
QQQ Pulls Back with Pennant
S&P MidCap 400 SPDR Bounces off Breakout Zone (MDY)
Small-cap Flags Fail to Confirm (IJR, IWO)
Technology SPDR Pulls Back (XLK)
Healthcare SPDR Battles Breakout Zone (XLV)
Regeneron Sinks the Biotech ETF (IBB)
Medical Devices ETF Consolidates after Surge (IHI)
Infrastructure ETF Consolidates after June Surge (IFRA)
Retail SPDR Battles Breakout Zone and Establishes Support (XRT)
Insurance ETF Forms Bull Flag (KIE)
Still Watching Flags in the Natural Gas ETF and XES (FCG)
Gold SPDR Extends Pullback (GLD)
Weight of Evidence Bullish, but Market is Still Split
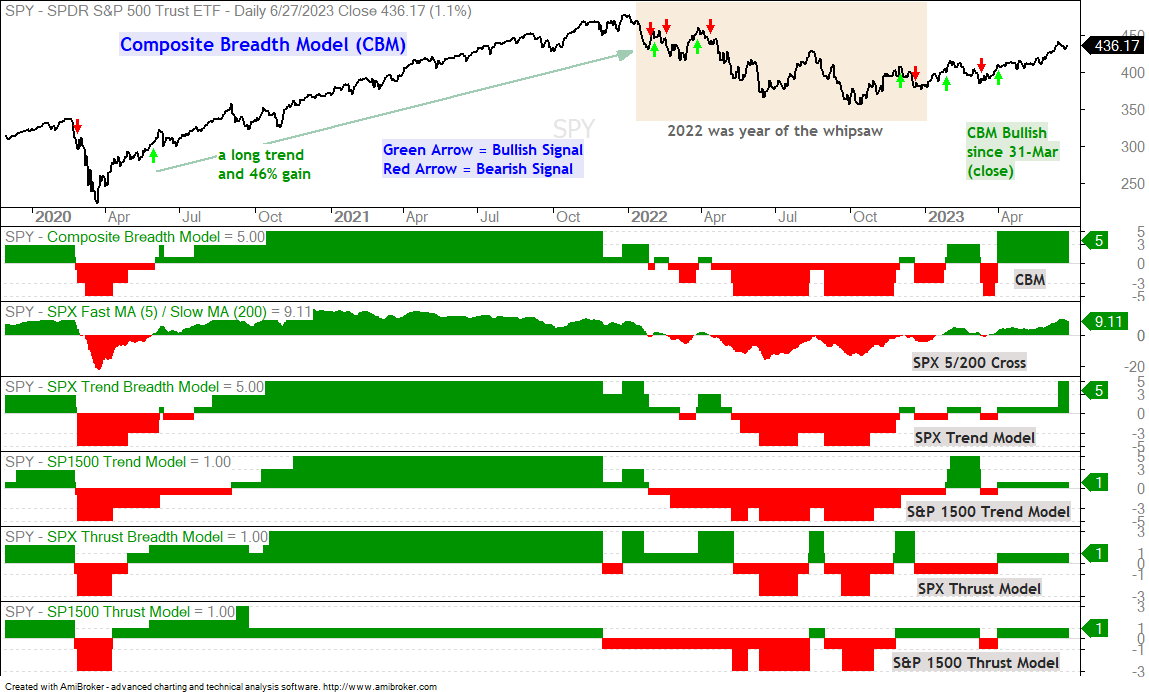
The weight of the evidence is bullish because the Composite Breadth Model is positive and the 5-day SMA for the S&P 500 is above the 200-day SMA.
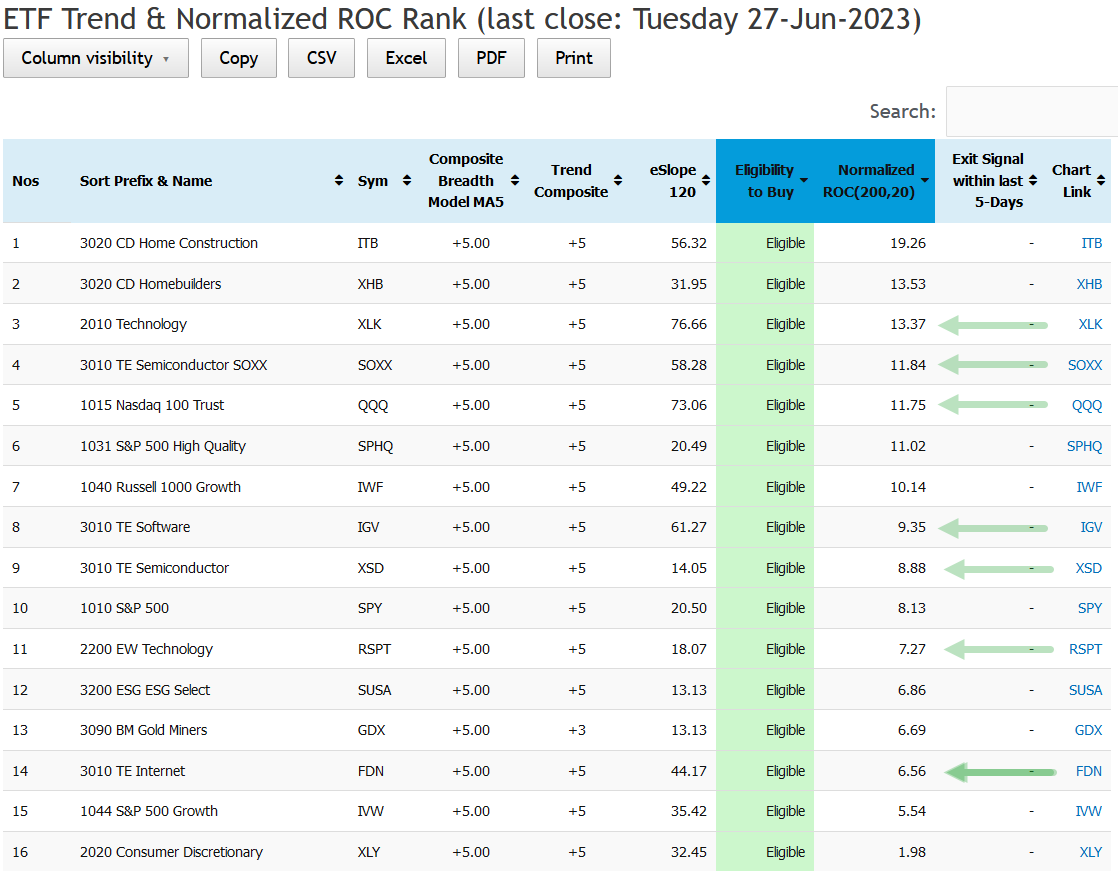
We are also seeing some risk-on with Nasdaq 100 stocks, technology and housing leading the market. The table below shows the top-ranked ETFs from the ETF Trend & Normalized ROC Rank table. We can see two housing ETFs (ITB, XHB) at the top and seven tech-related ETFs (green arrows).
Weakness in small-caps, however, counters this strength. Therefore, we still have a split market. There are sizable pockets of strength and sizable pockets of weakness. There are 74 stock-based ETFs in this table. 35 ETFs have a positive Trend Composite (uptrend) and 39 have a negative Trend Composite (downtrend). This is as split as it gets.
S&P 500 and Nasdaq 100 Stocks Dominate New High List
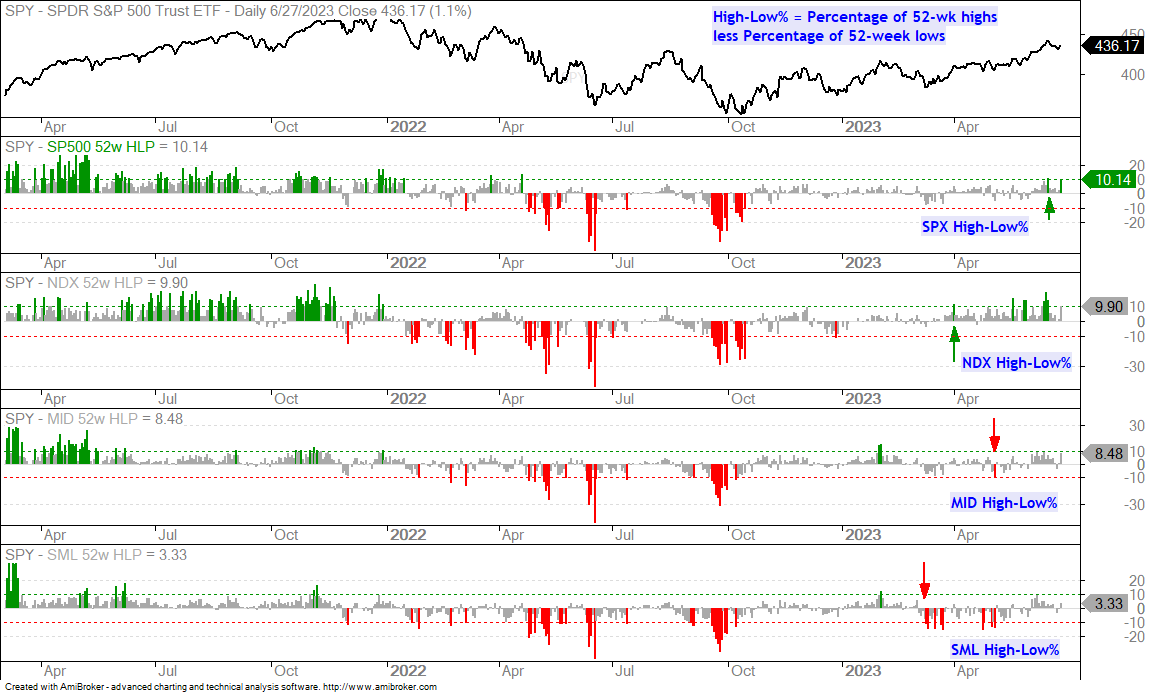
The chart below shows High-Low Percent for the S&P 500, Nasdaq 100, S&P MidCap 400 and S&P SmallCap 600. High-Low Percent is the percentage of 52-week highs less the percentage of 52-week lows in each index. The first indicator window shows SPX High-Low Percent exceeding +10% twice this month (green lines). This means more than 50 stocks within the S&P 500 hit new highs. This is decent leadership, but well below the 20+ percent levels seen in 2021. The second window shows NDX High-Low Percent exceeding +10 percent several times since late March and this is the strongest of the four groups. The lower windows show MID High-Low Percent and SML High-Low Percent failing to get above +10% the last few months. Mid-caps and small-caps are still struggling and lagging large-caps.
Most Uptrends are within NDX (%Above 200-day SMA)
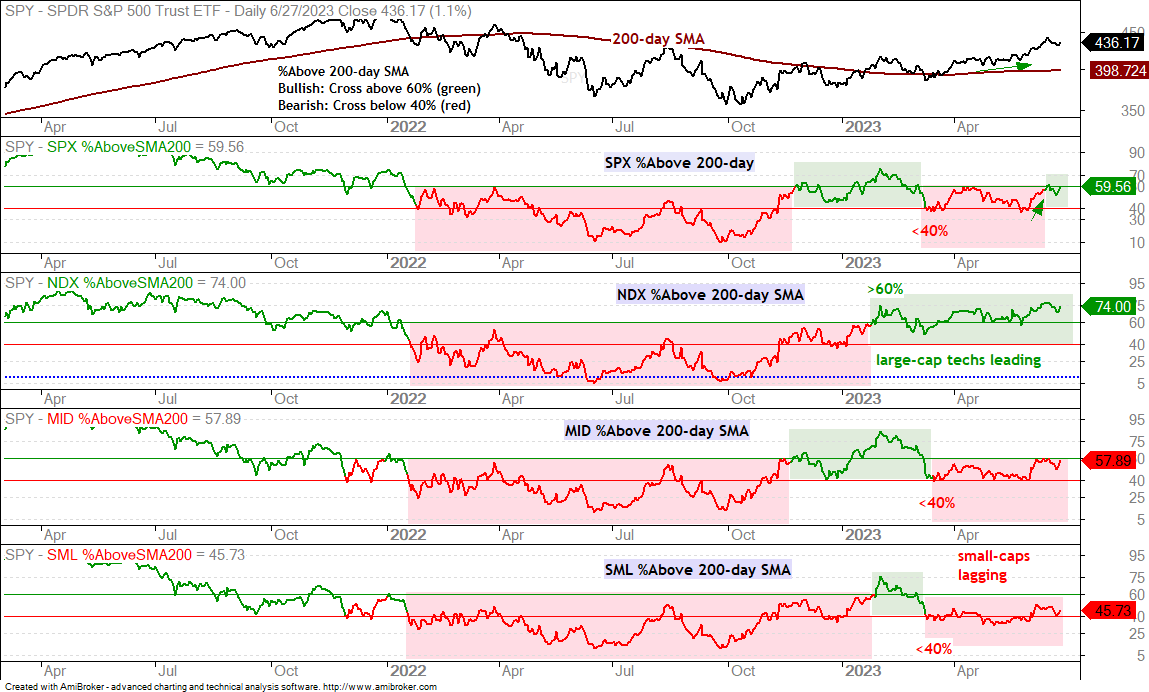
The next chart shows the percentage of stocks above the 200-day SMA for the same indexes. And the song remains the same. Nasdaq 100 stocks have been leading and continue to lead. 74% of NDX stocks are above their 200-day SMAs. S&P 500 stocks are a distant second at 59.56%. The indicator crossed above 60% two weeks ago as participation broadened within the S&P 500. This is a good sign and this indicator remains bullish until it crosses below 40%. Mid-caps are lagging because MID %Above 200-day did not get back above 60%. Small-caps are the weakest because SML %Above 200-day SMA did not get above 50%.
SPY Pulls Back after Sharp Advance
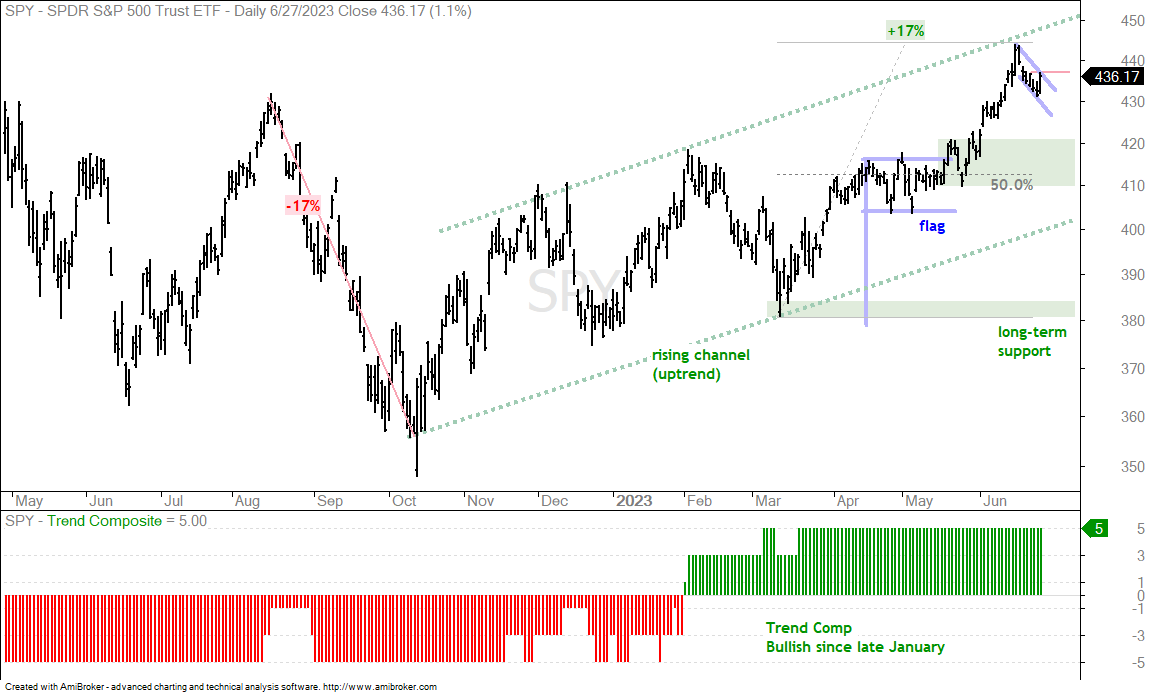
The long-term trend for the S&P 500 SPDR (SPY) is up with higher lows in December and March, and higher highs in February and June. Overall, a rising channel defines this uptrend (green dashed line). SPY became quite extended in mid June because it was up 17% since mid March and 10% since early May. SPY was also near the top of the rising channel.
SPY pulled back with a dip to the low 430s the prior six days and then bounced with a 1.1% gain on Tuesday. Short-term, a falling flag could be forming and a break above 437 would be bullish. Barring a breakout here, SPY is still extended after its big runs and could further correct. The flag breakout zone and 50% retracement mark the first support zone to watch in the 410-420 area.
QQQ Pulls Back with Pennant
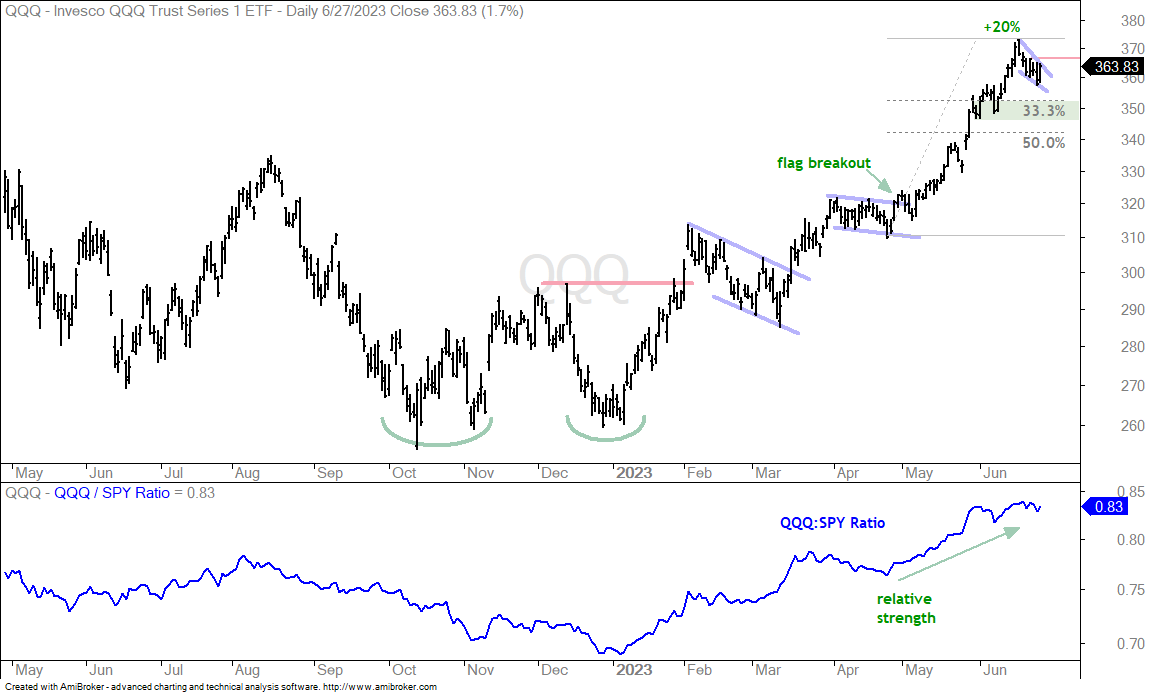
Note that semiconductor stocks are down sharply in pre-market trading after reports of new restrictions on exports to China. QQQ is down around a half percent. The chart below shows QQQ advancing around 20% from late April to mid June. This advance was unsustainable and QQQ was ripe for a pullback or consolidation. The ETF pulled back with a small pennant the last seven days and this is a short-term bullish continuation pattern. A break out at 367 would be short-term bullish. Barring a breakout, the pullback could extend further and the green shading marks the next support zone. I am using the early June lows and 33.3% retracement to mark support here. This is an area to watch for an oversold bounce.
S&P MidCap 400 SPDR Bounces off Breakout Zone (MDY)
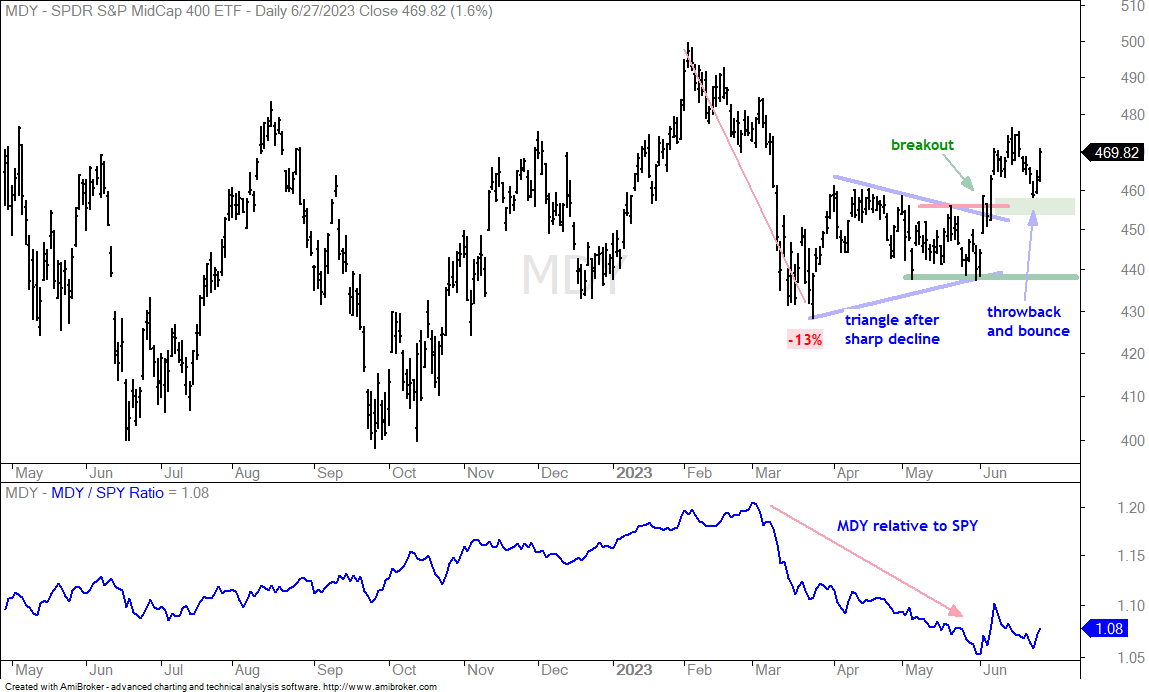
I highlighted the breakout in MDY last week and marked support at the breakout zone (green shading). This is a classic tenet of technical analysis: broken resistance turns into first support. MDY fell back to the breakout zone and this is known as a “throwback”. The throwback to the breakout zone provides a second chance to partake in the breakout. MDY bounced the last two days and this bounce reinforces support in this zone.
Small-cap Flags Fail to Confirm (IJR, IWO)
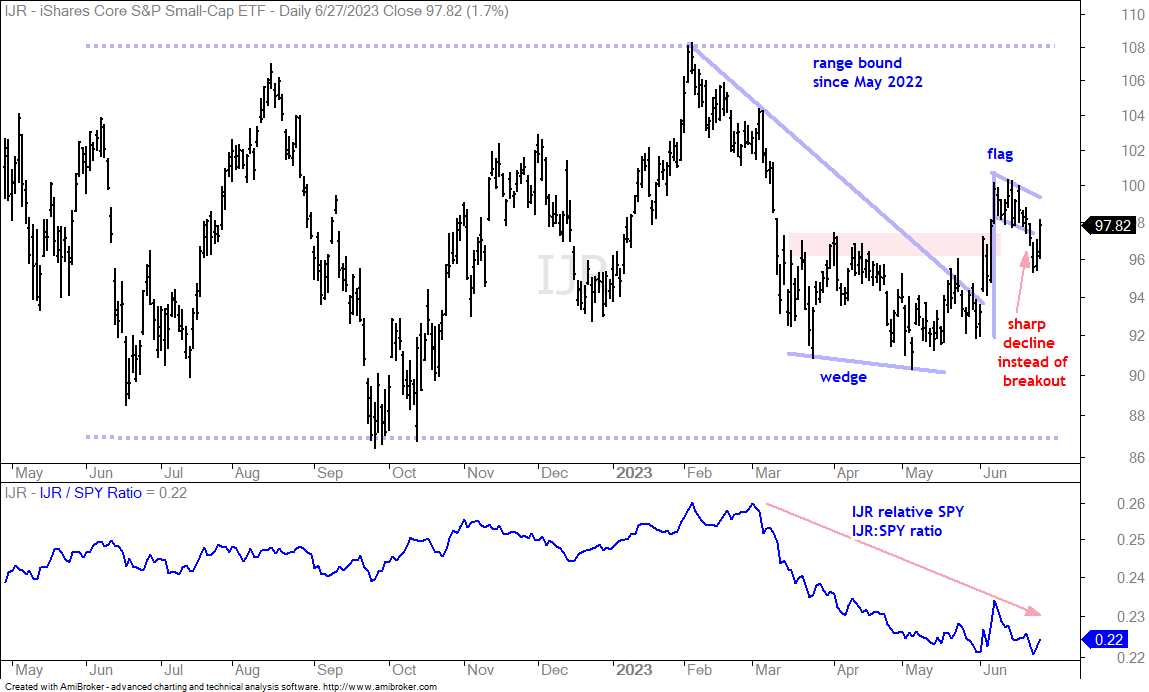
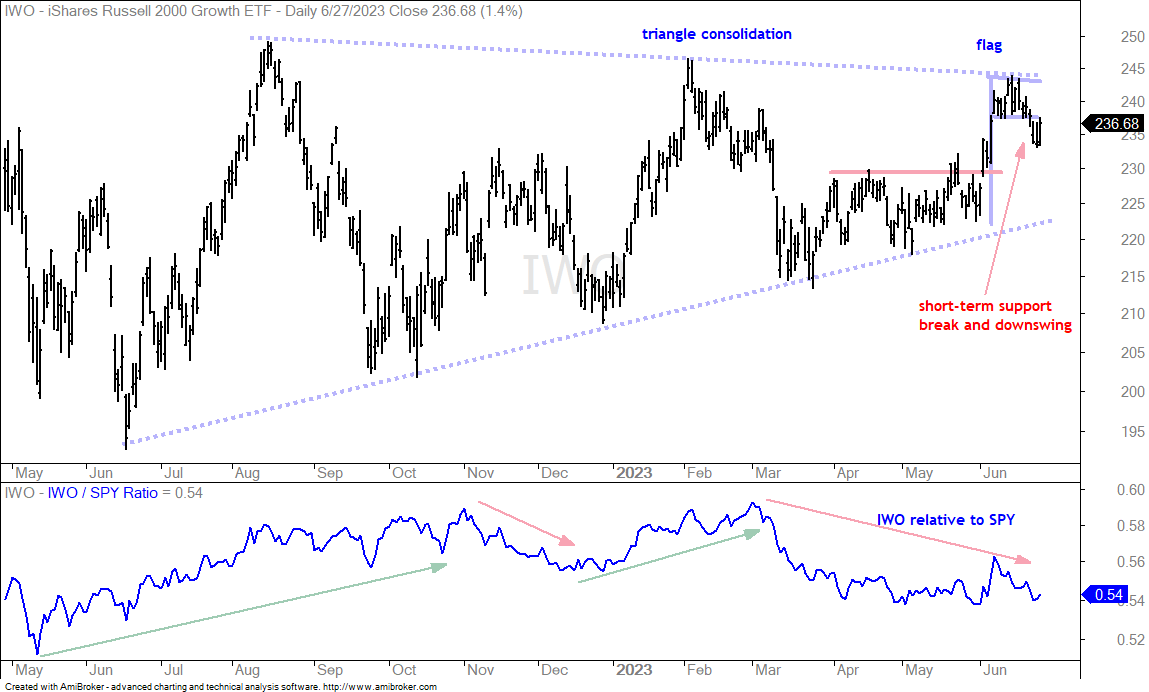
I noted a potential flag forming in the S&P SmallCap 600 SPDR (IJR) last week. The ETF surged in early June and then consolidated after this surge. A consolidation after a surge is typically a bullish continuation pattern. A breakout at 100 would have confirm this pattern and signal a continuation of the June surge. It did not happen. Instead, IJR plunged below the flag lows with a sharp decline last week. We saw a rebound on Monday-Tuesday, but the sharpness of last week’s decline shows vulnerability. Small-caps are underperforming overall and small-cap breadth remains weak.
The next chart shows the Russell 2000 Growth ETF (IWO) forming a flag, but failing to break out and confirm the flag. Instead, IWO broke flag support and reversed the upswing within the triangle. This also speaks to relative weakness in small-caps.
Technology SPDR Pulls Back (XLK)
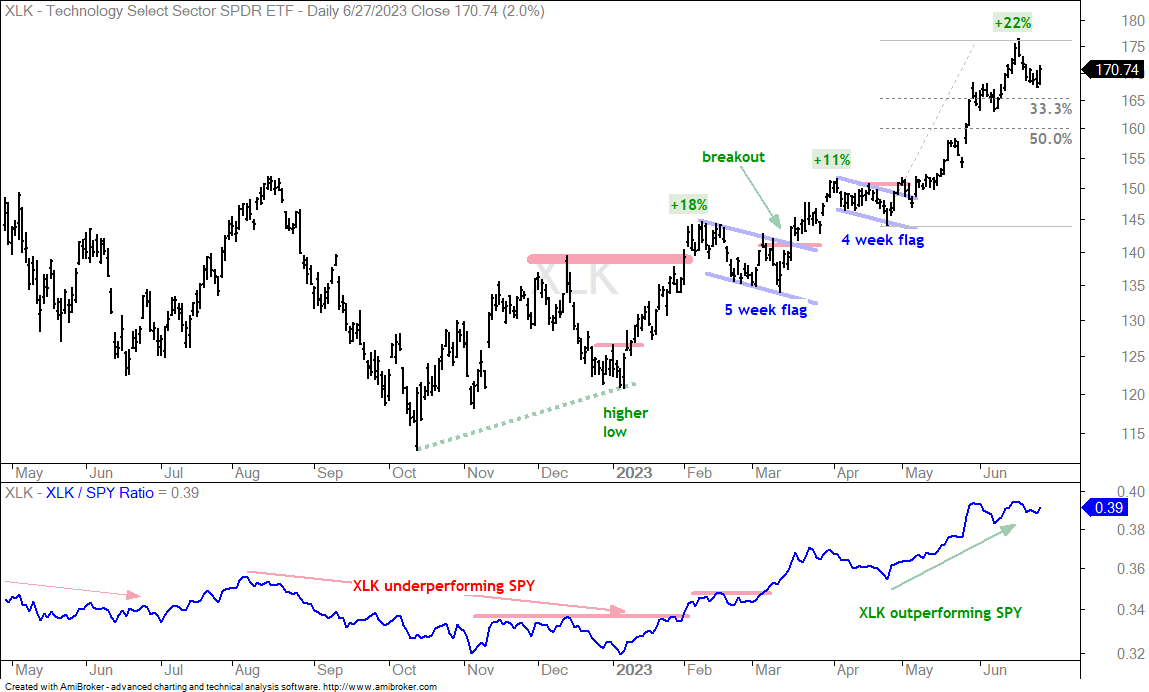
I will not cover the other tech-related ETFs because they are in the same condition as XLK. They are also highly correlated to QQQ and XLK. In other words, SOXX, IGV, CIBR and SKYY will move in the same direction as XLK. The chart below shows XLK surging some 22% and then pulling back into Monday. The ETF surged 2% yesterday and could be reversing the short-term pullback. 1-2 week patterns are too short-term for my trading style. I prefer 3-6 week pullbacks with an identifiable pattern or setup. Notice how XLK formed 3-5 week flags after the 18 and 11 percent advances. The only thing to do now is wait for a setup and identify a potential reversal zone. A 33-50 percent retracement of the April-June advance would extend to the 160-165 area and this is the first zone to watch.
Healthcare SPDR Battles Breakout Zone (XLV)
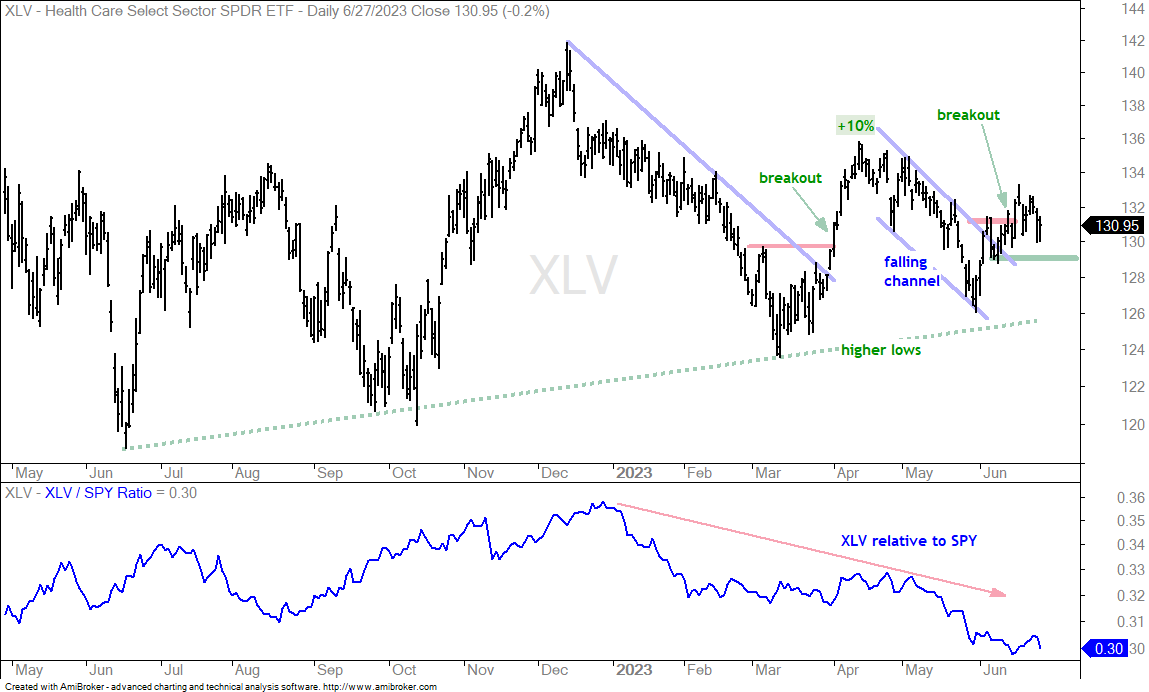
The Healthcare SPDR (XLV) formed a falling channel into early June and broke out with a surge two weeks ago. It continues to trade near the breakout zone as it battles to hold the breakout. Overall, XLV sports a series of higher lows the last 12 months and some sort of uptrend is working. The breakout is also holding for the most part and I remain bullish. I am setting my re-evaluation at 129 because a close below this level would negate the breakout.
Regeneron Sinks the Biotech ETF (IBB)
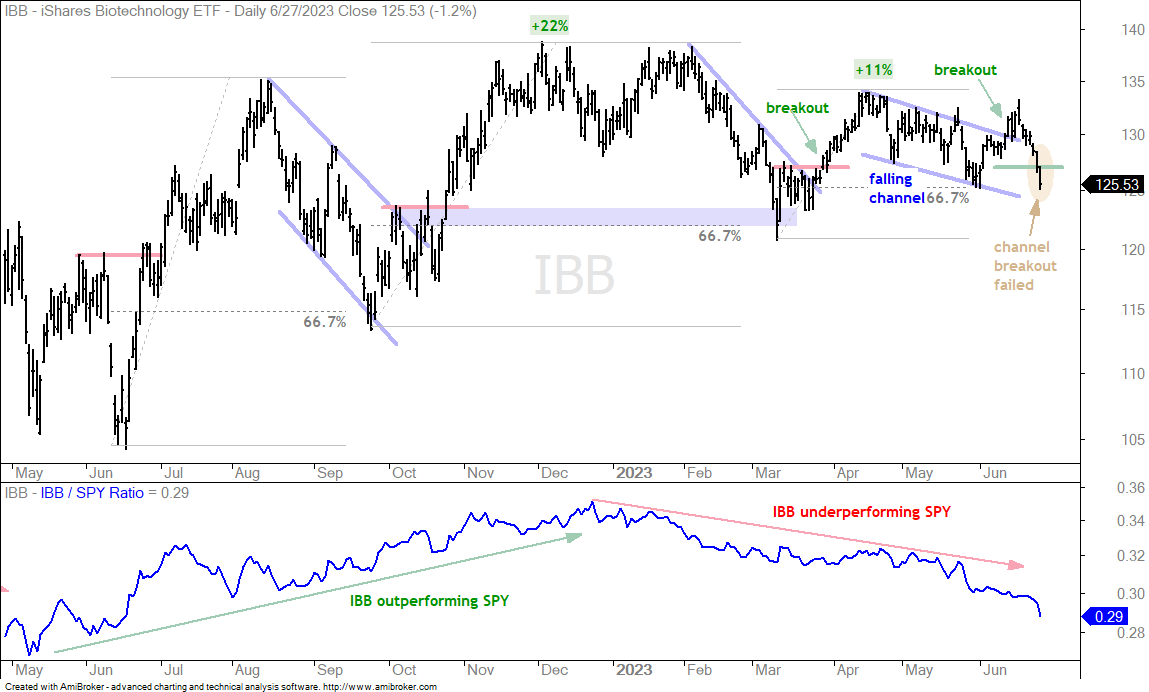
Biotechs are a big part of the Healthcare sector and the Biotech ETF (IBB) failed to hold its breakout. Regeneron (REGN) accounts for 7.25% of IBB and it fell over 8% on Tuesday. On the price chart, IBB broke out of a falling channel in mid June and closed below my re-evaluation level (127) on Tuesday. The channel breakout failed.
Medical Devices ETF Consolidates after Surge (IHI)
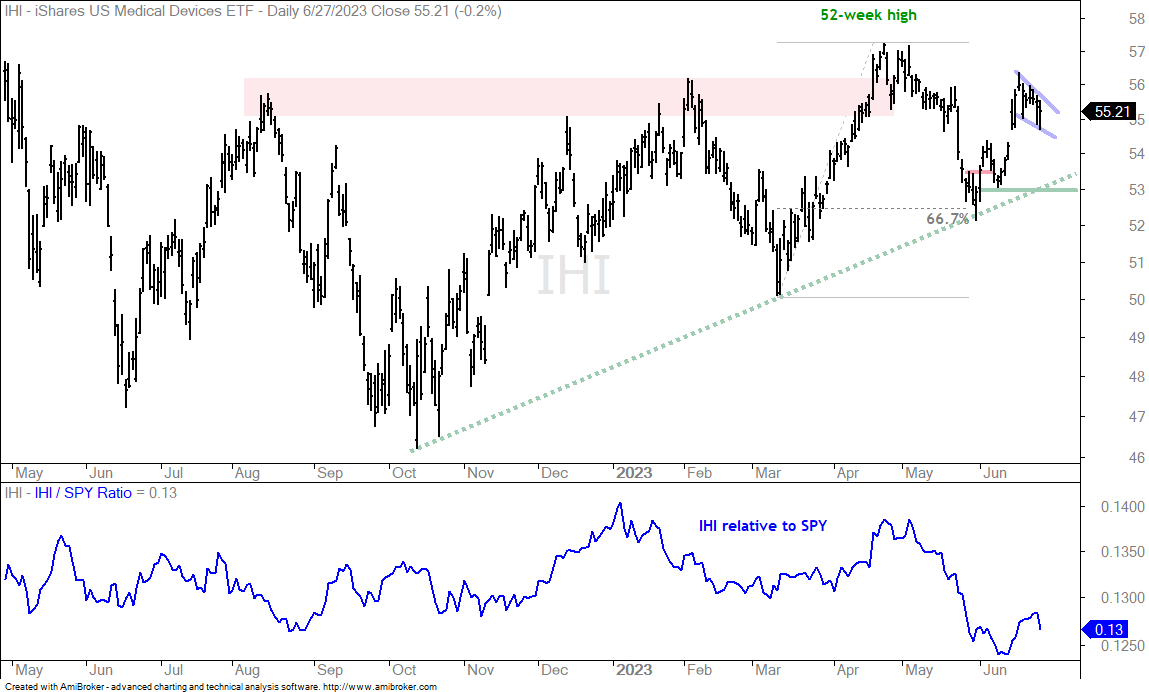
The Medical Devices ETF (IHI) is in a long-term uptrend and forming a short-term bullish continuation pattern. The ETF pulled back rather sharply in May, but ultimately formed a higher low as it reversed course with a breakout in early June. After a 6% surge off the May low, the ETF fell back the last week or so with a pennant. This is a short-term bullish continuation pattern and a breakout at 56 would be bullish.
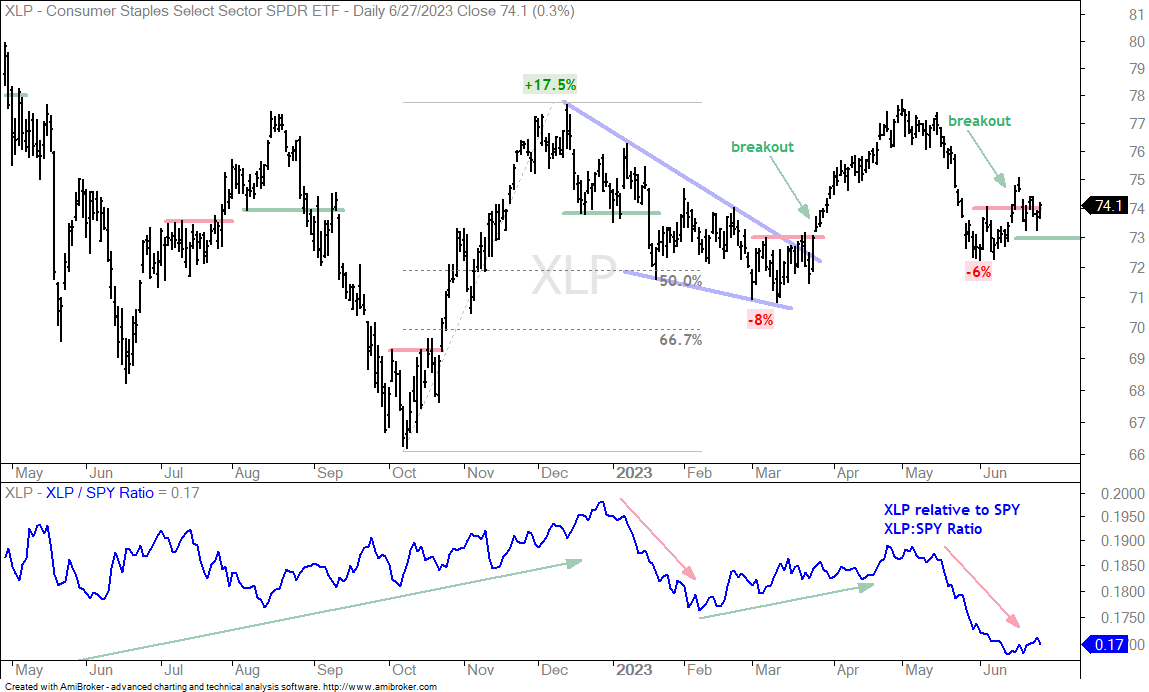
The Consumer Staples SPDR (XLP) is one of these ETFs that has been range bound for over a year. There are swings within this range and trading these swings is the only strategy right now. The swing was down with the May decline. XLP them firmed around 72.5 in late May and early June. The ETF broke short-term resistance with a surge in mid June and is battling to hold this breakout. I am setting the re-evaluation at 73 and will call it a failure should XLP close below this level.
Infrastructure ETF Consolidates after June Surge (IFRA)
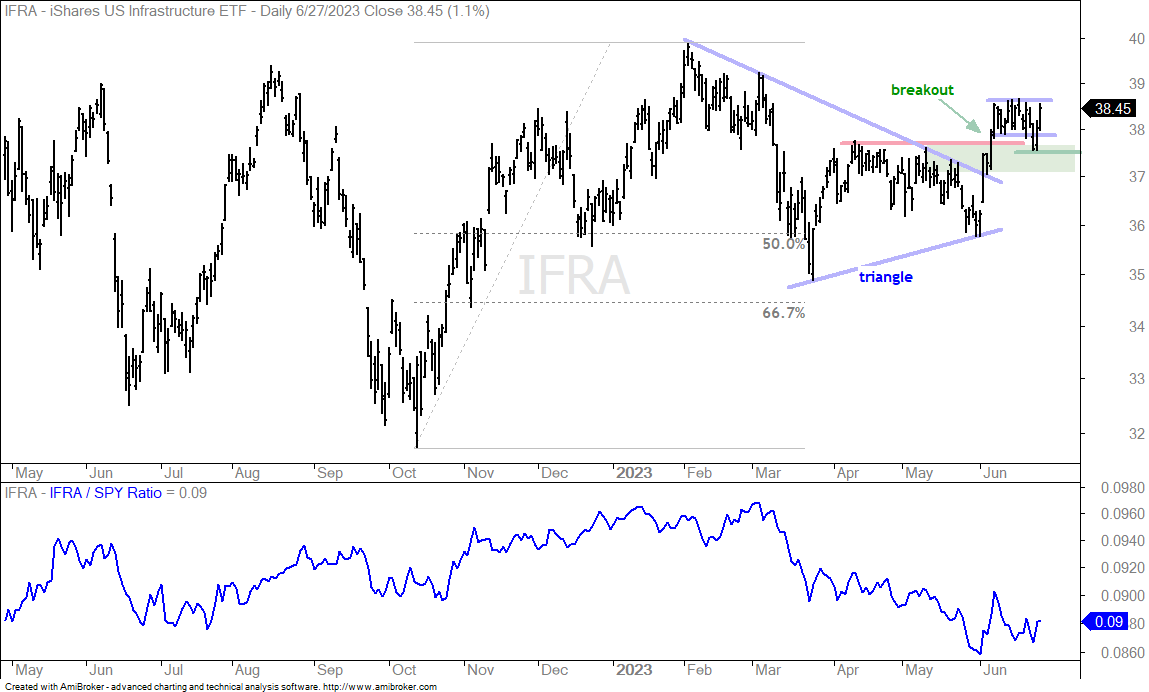
The Infrastructure ETF (IFRA) broke out in June and consolidated after the June surge. Overall, IFRA advanced from October to February and then corrected into June. This correction formed a large triangle and IFRA broke out with a surge in June. The green shading marks the breakout zone and this zone held with last week’s pullback. The blue lines show a flag developing and a breakout above the flag highs would signal a continuation higher. A close below last week low (37.5) would call for a re-evaluation.
Retail SPDR Battles Breakout Zone and Establishes Support (XRT)
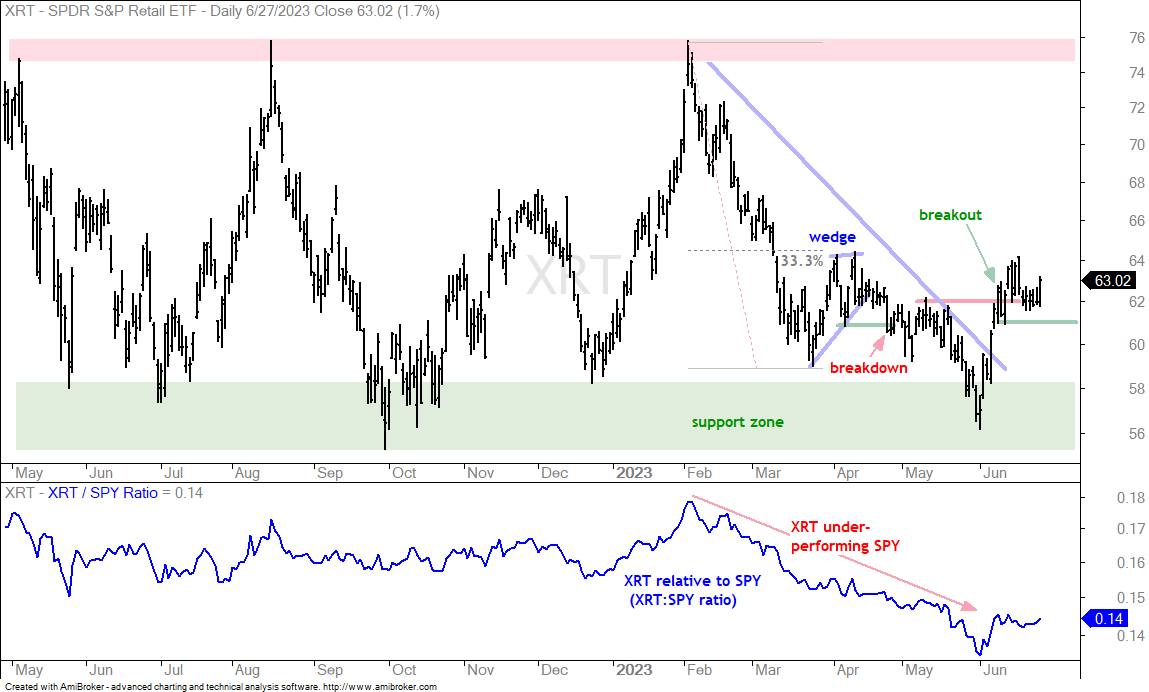
A breakout is valid as long as it holds. The chart below shows the Retail SPDR (XRT) surging in June and breaking the May high. This is a positive sign for the market because retail spending accounts for some two thirds of GDP. Notice that XRT surged off a support zone that extends back to May 2022. The swing within the large trading range is up and I am watching the breakout for clue. A strong breakout will hold and a weak one will fold. I am marking support at 61 and a close below this level would negate the breakout.
Insurance ETF Forms Bull Flag
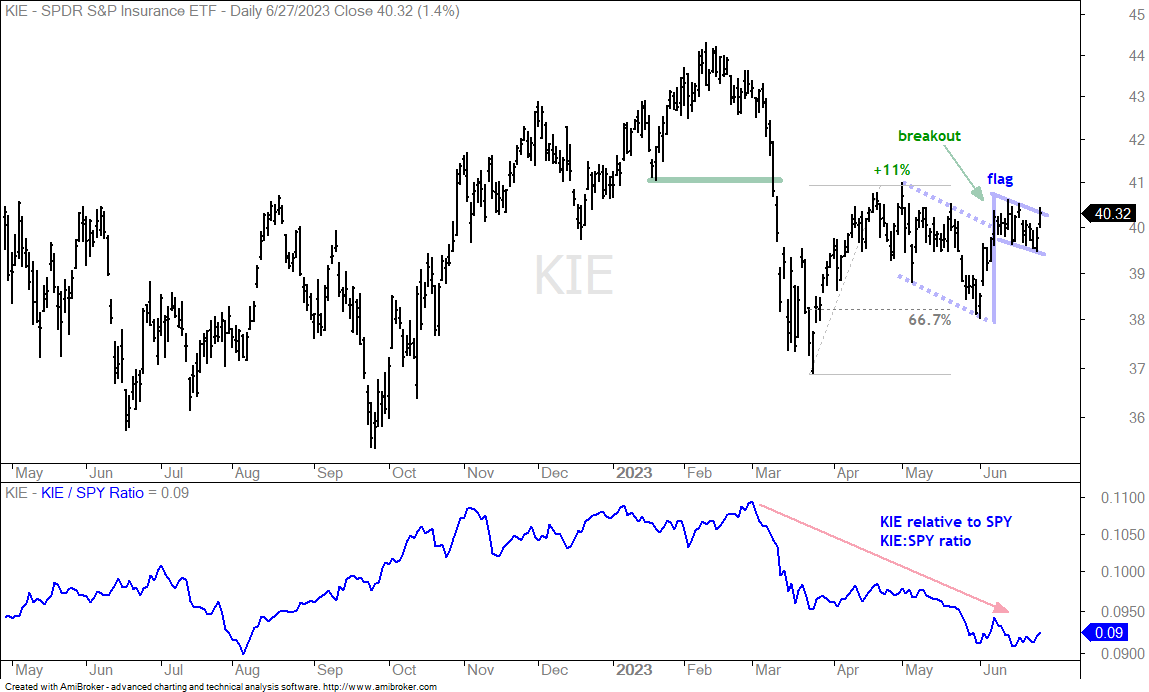
The Insurance ETF (KIE) surged with the rest of the market in June and broke out of a falling channel (blue dashed lines). KIE corrected after this surge with a slight pullback the last three weeks. This pullback looks like a falling flag and this is a bullish continuation pattern. A flag breakout is in the making and this would signal a continuation of the June surge.
Still Watching Flags in FCG and XES
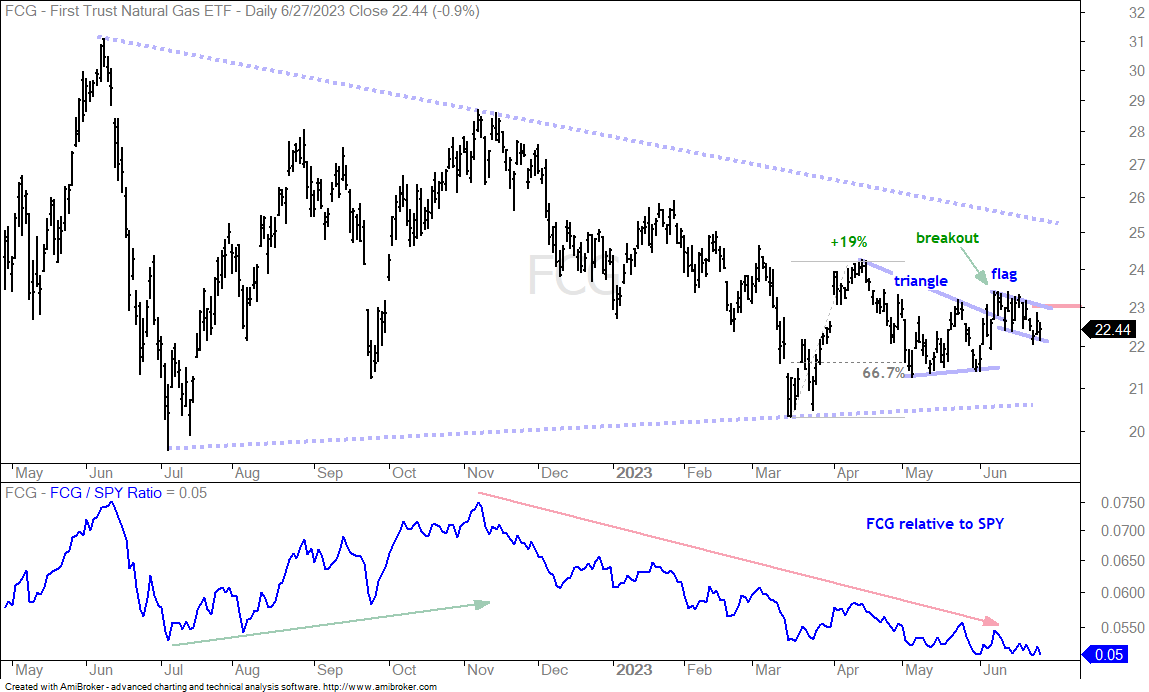
I am still watching the flags in the Natural Gas ETF (FCG) and the Oil & Gas Equipment & Services ETF (XES). The first chart shows FCG trying to break out of the triangle, but failing to hold the breakout and failing to follow through. The decline over the last 3-4 weeks could be a falling flag and a breakout at 23 would be bullish.
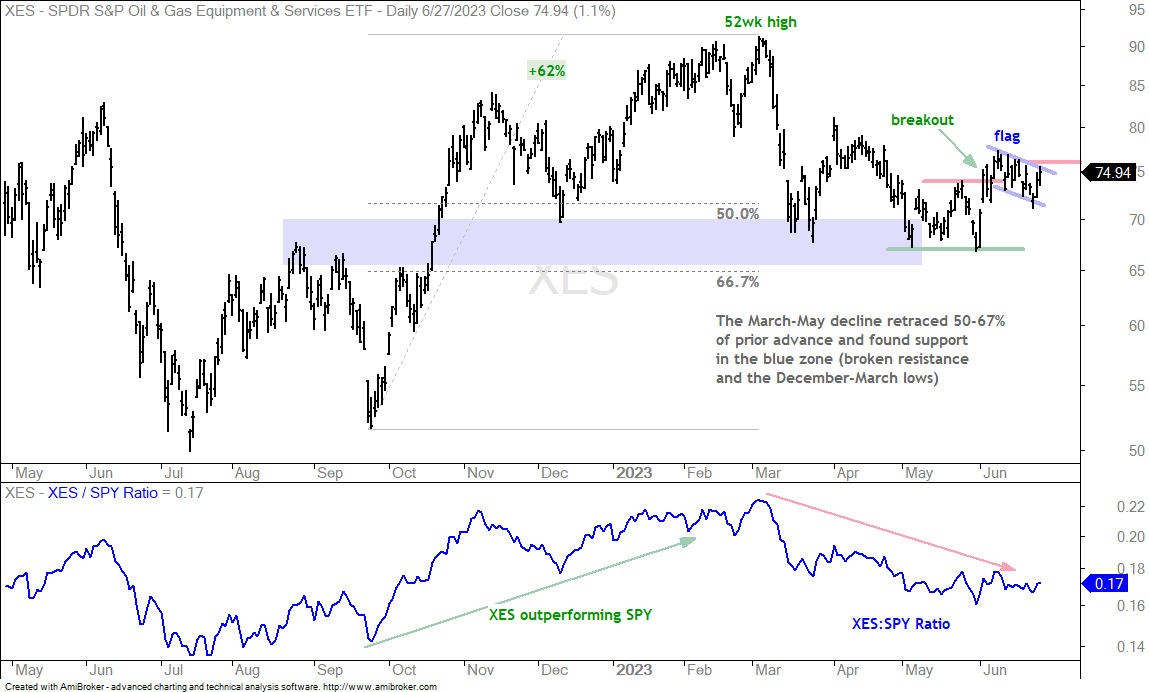
The next chart shows XES with a June surge and break above the mid May high. The ETF then pulled back with a falling flag. A breakout at 76 would confirm the flag and signal a continuation higher.
Gold SPDR Extends Pullback
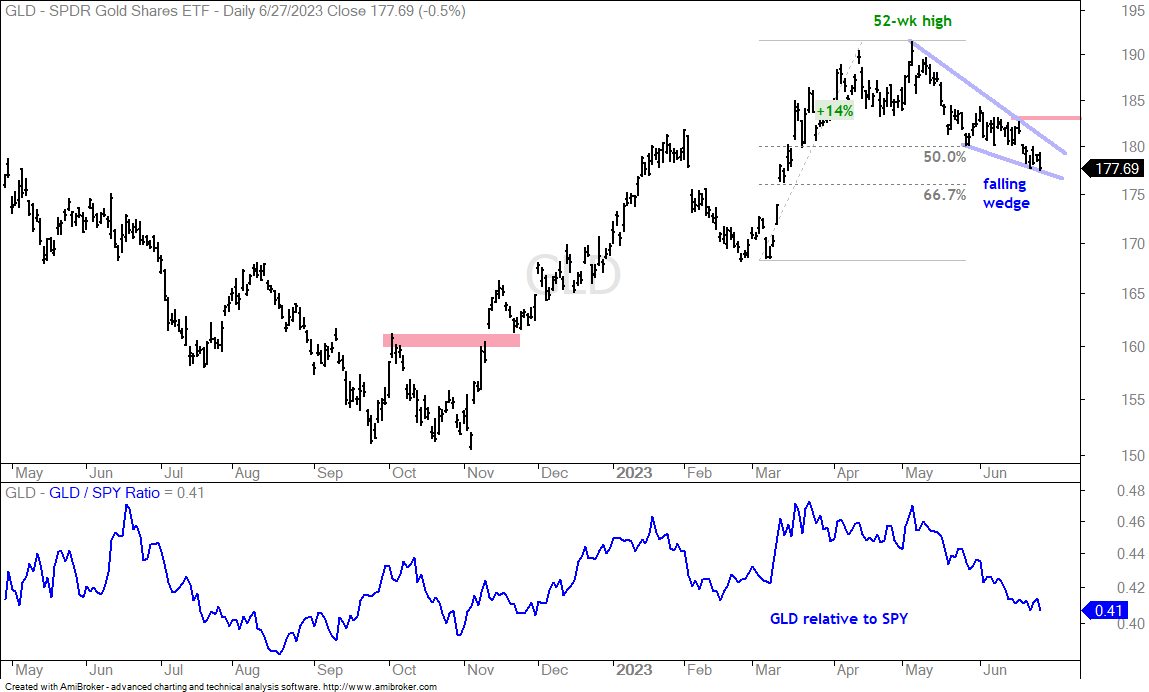
The Gold SPDR (GLD) remains in pullback mode. I am calling this a pullback because the ETF hit a new high in mid May and the decline retraced 50-67 percent of the prior decline. A falling wedge also formed. Both the pattern and the retracement amount are typical for corrections after big advances. Note that the immediate trend is down as long as wedge resistance holds. I am setting resistance at 183 and a break above this level would be bullish. I am not showing the Gold Miners ETF (GDX) and Silver ETF (SLV) because they will move in the same direction as gold. Thus, a breakout in gold would be bullish for GDX and SLV.