Two Clean Energy ETFs with Late Breakouts (PBW, ACES)
Natural Gas and Oil & Gas Equipment & Services ETFs Surge (FCG, XES)
Agribusiness ETF Surges and Flags (MOO)
Video Games eSports ETF Breaks Out of Pennant (ESPO)
Gold SPDR and Gold Miners ETF Remain with Downswings (GLD, GDX)
Weight of Evidence Bullish
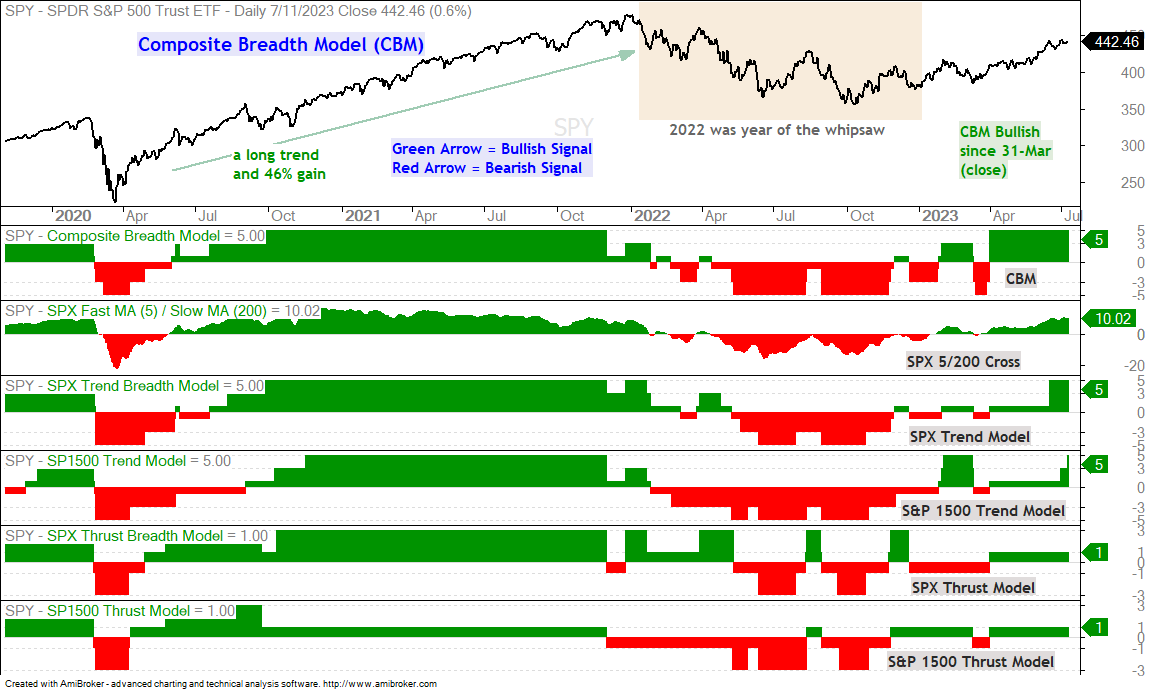
The weight of the evidence remains bullish for stocks. The Composite Breadth Model is positive (since March 31st), yield spreads show no stress and upside participation continues to improve. The Retail SPDR is coming to life and the Home Construction ETF continues to lead. These two represent the Consumer Discretionary sector and it is positive to see strength here. We are also seeing upside leadership in the Industrials and Technology sectors.
Upside Participation Continues to Improve
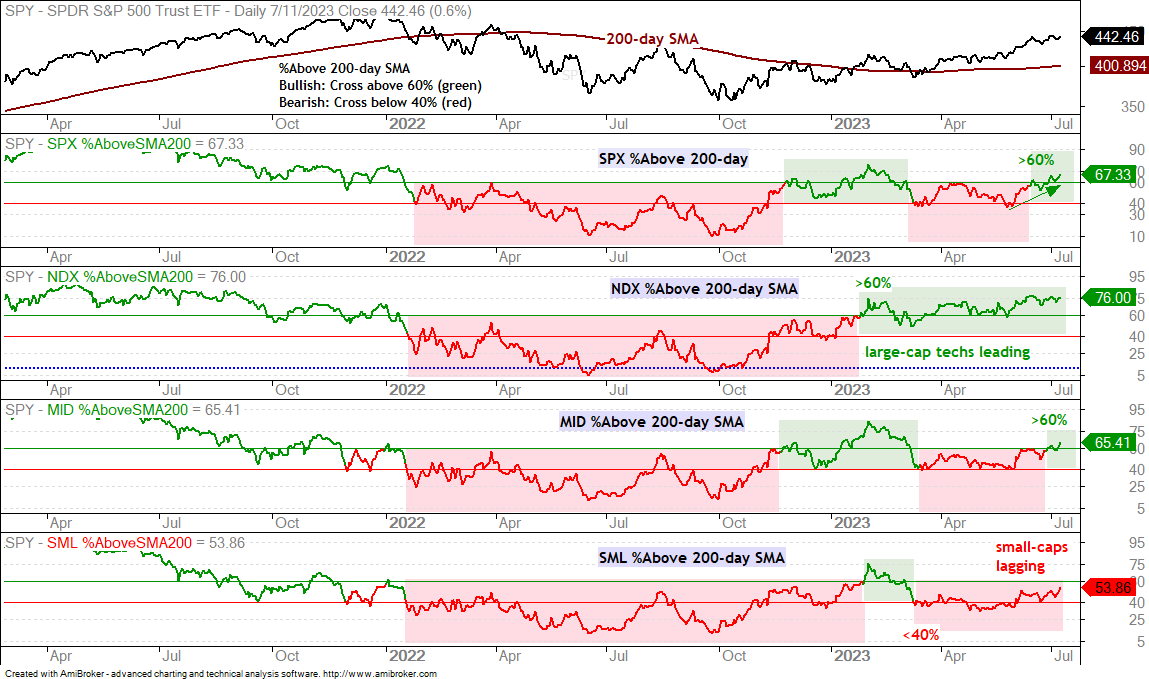
The chart below shows the percentage of stocks above the 200-day SMA for the S&P 500, Nasdaq 100, S&P MidCap 400 and S&P SmallCap 600. Nasdaq 100 stocks continue to lead with 76% above their 200-day SMAs. Large-caps are also strong with 67% of S&P 500 stocks above their 200-day SMAs. The green arrow in the first indicator window shows participation improving with a move from 39% to 67%. Mid-caps are also showing improvement as MID %Above 200-day moved above 60% for the first time since March. 65.41% of mid-caps are above their 200-day SMAs. Small-caps remain the laggards with just 53.86% of small-caps above their 200-day SMAs.
New Highs Expand
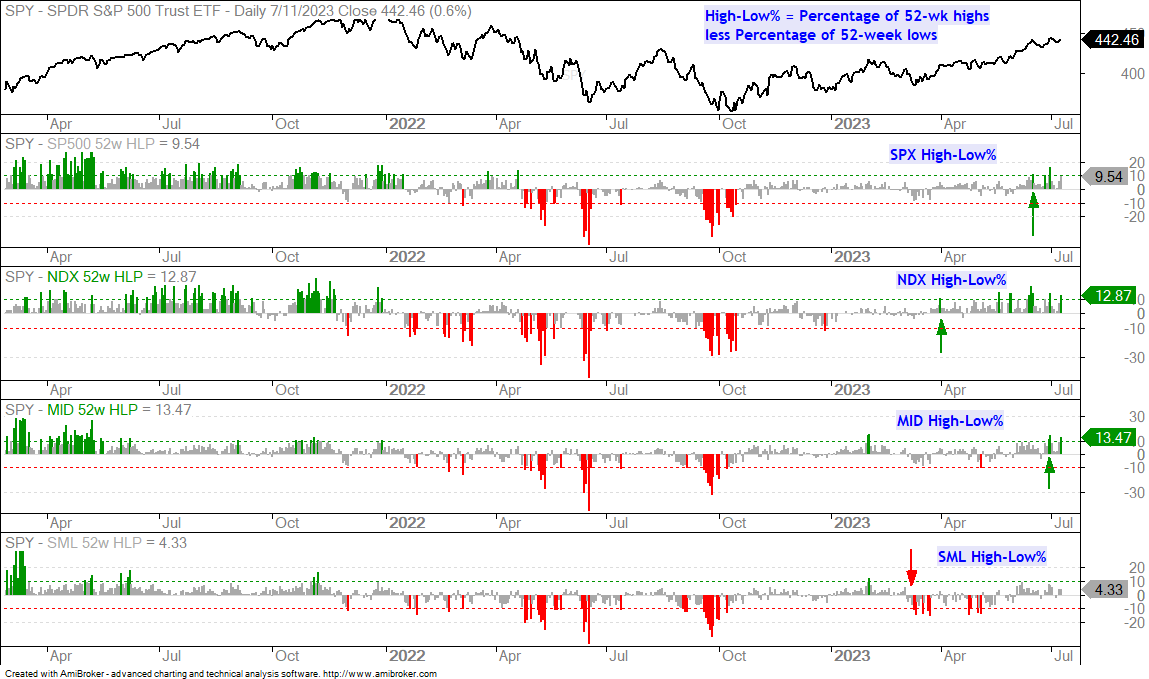
We are also seeing more new highs the last two weeks. The next chart shows the High-Low Percent indicators for the same indexes. High-Low Percent is the percentage of new highs less the percentage of new lows. This indicator turns bullish when it exceeds +10% (green lines on histograms). Nasdaq 100 High-Low Percent turned bullish in late March and S&P 500 followed in mid June. Mid-caps joined as High-Low Percent exceeded +10% on June 30th. This means three of the four are in bull mode. Small-caps are still the laggard because SML High-Low Percent has yet to exceed +10%.
SPY Breaks out of Flag and Extends Uptrend
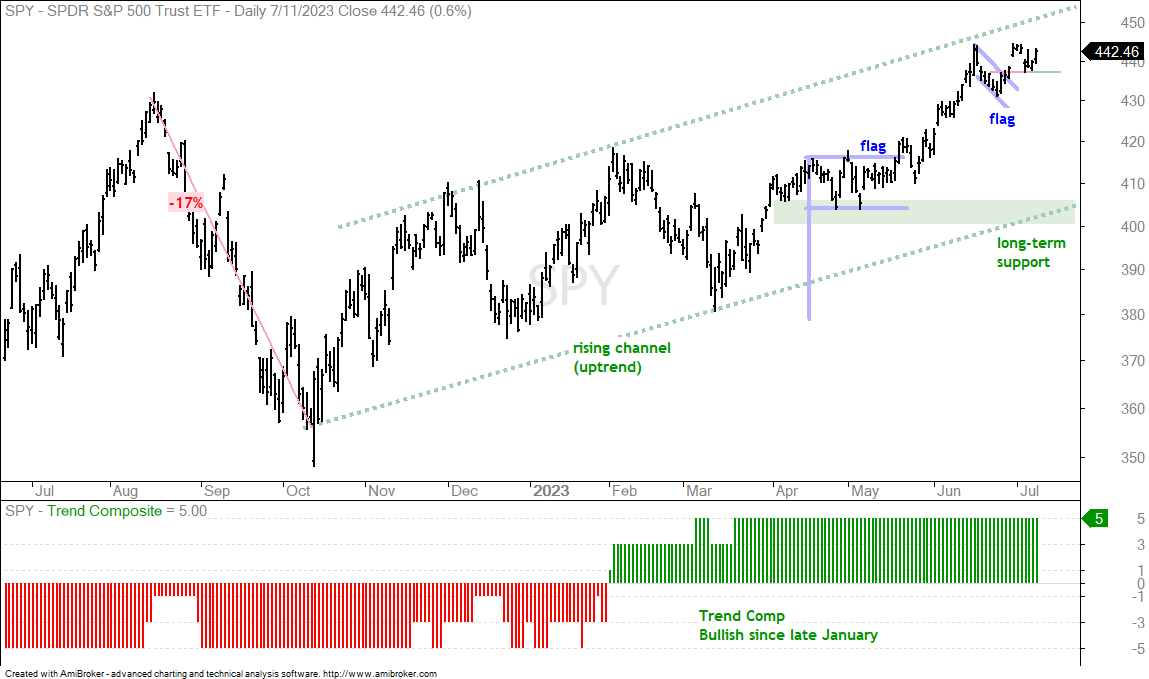
SPY is in a long-term uptrend with a rising channel defining this uptrend. The lower line, the April-May lows and a buffer mark a support zone in the 400-405 area. This is long-term support. Short-term, SPY formed a falling flag in the second half of June and broke out on June 29th. There was a short throwback to the breakout line (red) and SPY bounced the last two days. This small bounce reinforces short-term support at 437. A close below 437 would negate the flag breakout.
A Word on Chart Analysis
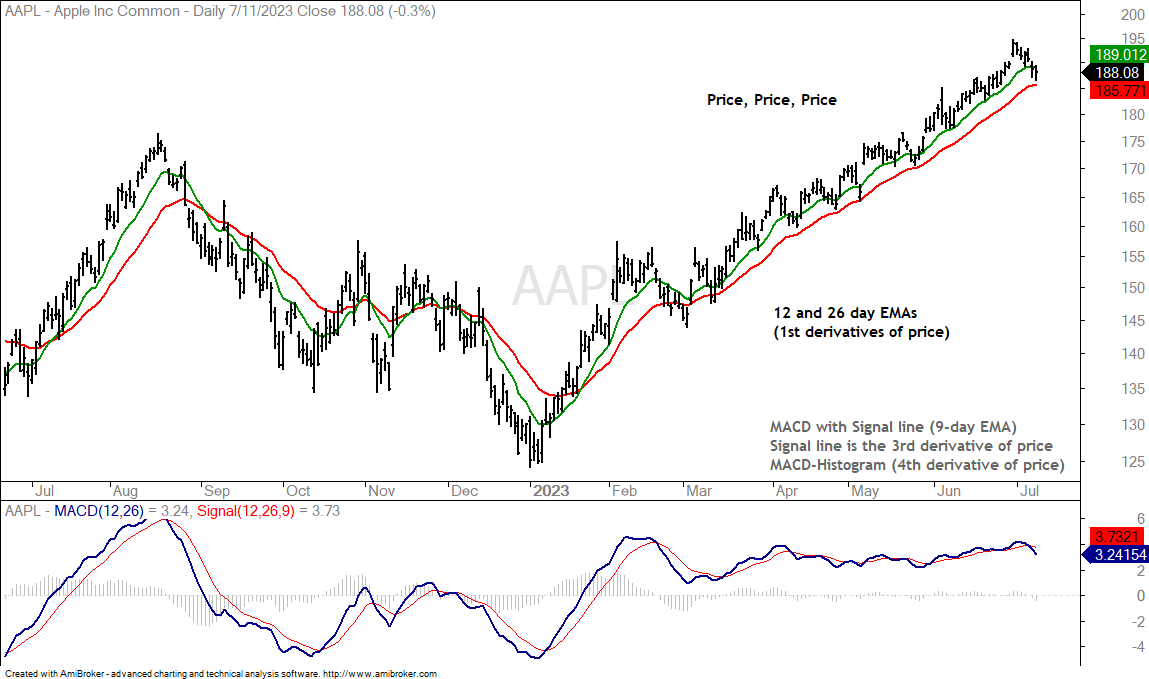
Indicators are based on price data, which makes them a derivative of price, at best. MACD, for example, starts with closing prices and smooths them with two EMAs. Typically, these are the 12-day and the 26-day EMAs. MACD then plots the difference between these two EMAs. This means MACD is a second derivative of price. Despite being two steps removed from price, MACD is considered a momentum indicator that leads price. Chew on that one for a while.
It sounds great in theory, but practice is much more nuanced. Indicators are great for scans and building a systematic trading strategy. When it comes to chart analysis, however, price is the only thing that matters. Indicators sometimes confirm what we are seeing on the chart. Other times, indicators do not confirm and simply sew the seeds for analysis paralysis. Less really is more and price is all we need. The following charts will show price bars only.
QQQ Breaks out of Pennant, but Remains Extended
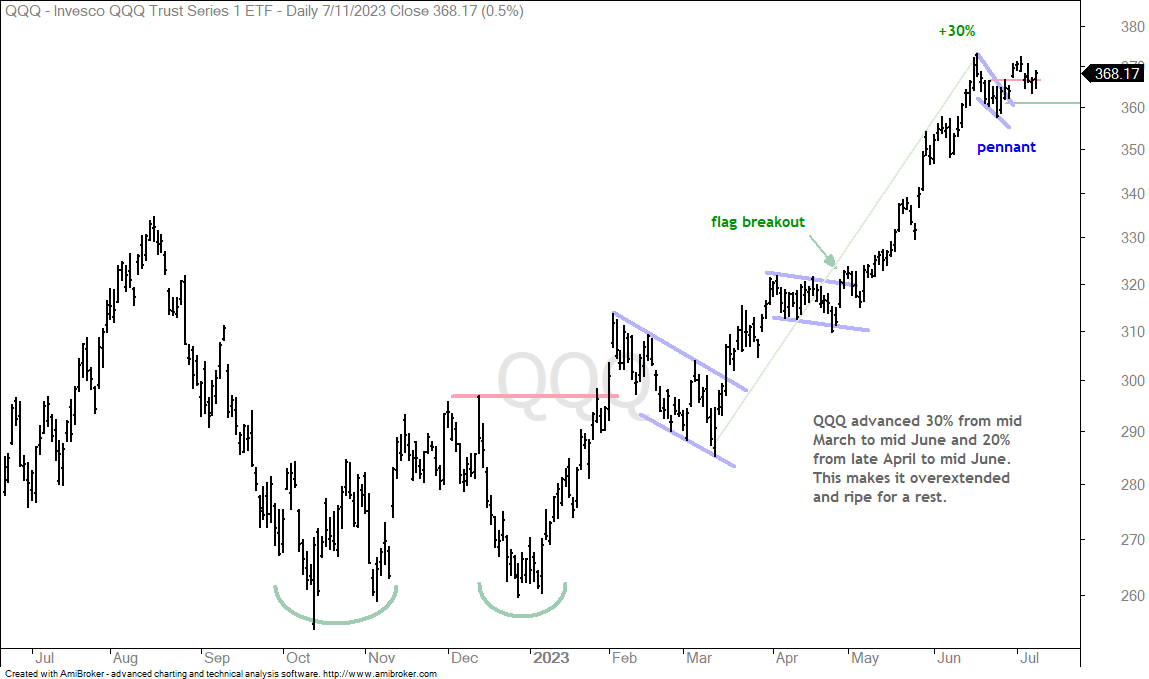
QQQ surged some 30% from mid March to mid June. The ETF consolidated with a flag in April and broke out in early May. It then formed a pennant in the second half of June and broke out with a surge last week. QQQ fell back after this surge and bounced on Tuesday (+.50%). The pennant breakout is holding for the most part and I will mark short-term support at 360. I am still wary of QQQ because it remains extended after a sharp advance. This overextension makes it vulnerable to a correction, which could involve a pullback or a consolidation.
S&P MidCap 400 SPDR Extends Bounce (MDY)
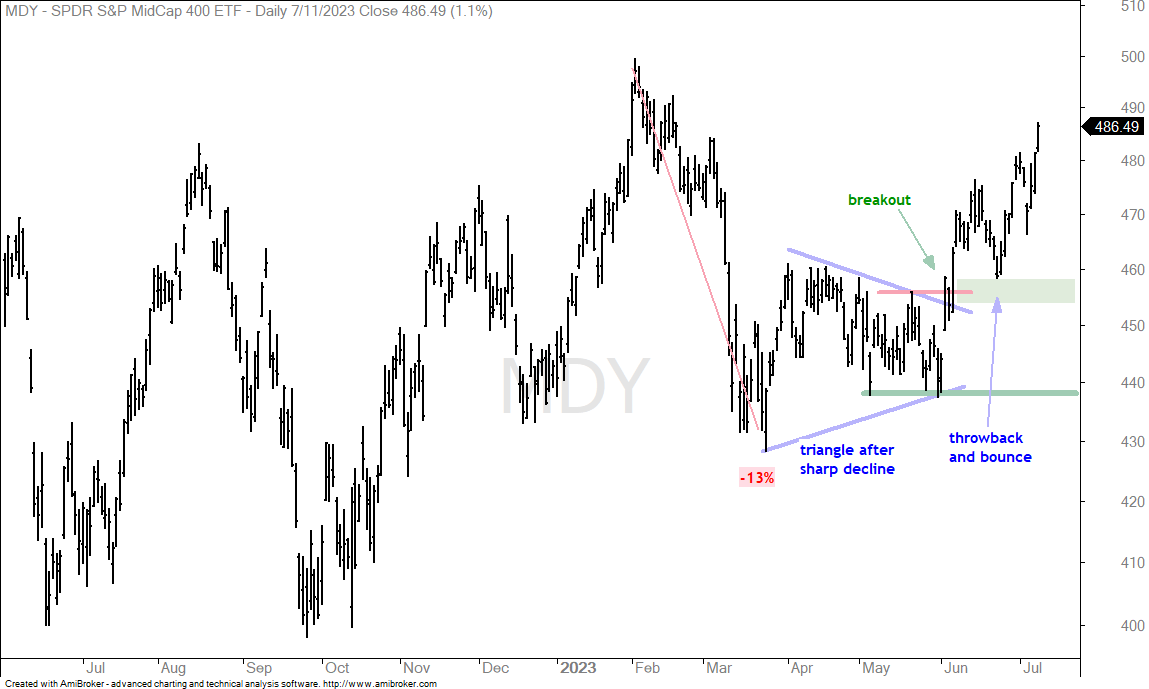
I highlighted the breakout in MDY three weeks ago and marked support at the breakout zone (green shading). This is a classic tenet of technical analysis: broken resistance turns into first support. MDY fell back to the breakout zone and this is known as a “throwback”. The throwback to the breakout zone provides a second chance to partake in the breakout. MDY bounced the last few weeks and is starting to play catchup.
Mobile Payments and Fintech ETFs Play Catch Up (IPAY, FINX)
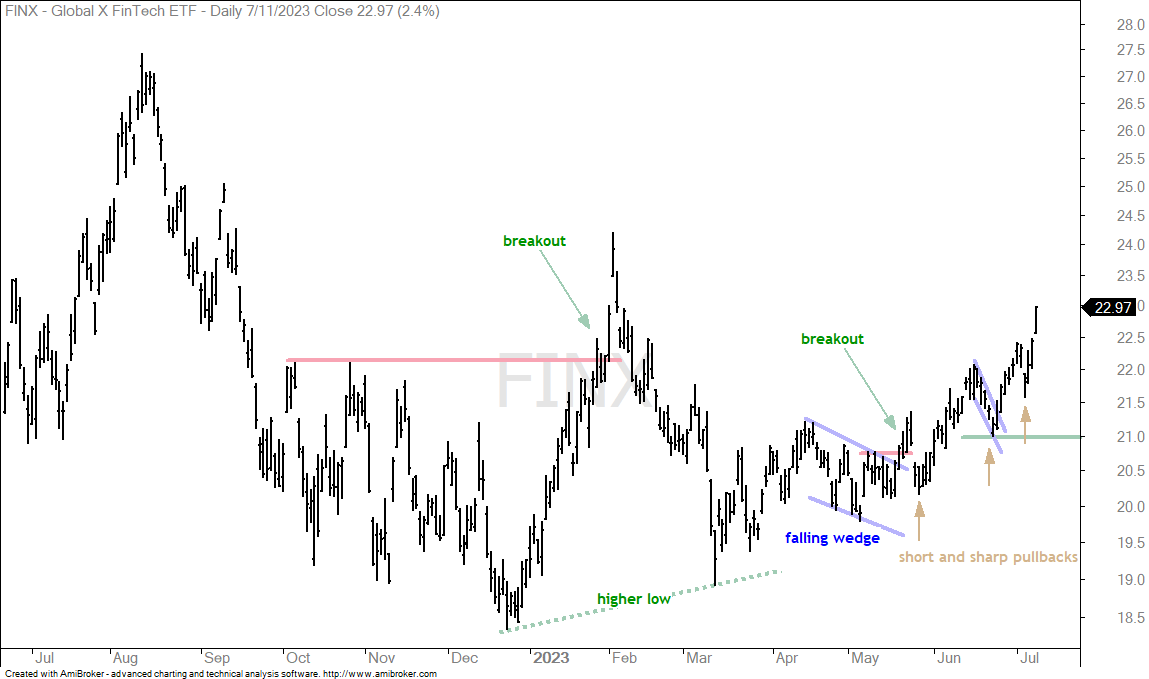
The FinTech ETF (FINX) broke out in mid May and then worked its way higher the last two months. Notice the short and sharp pullbacks along the way (yellow arrows). These short-sharp pullbacks create mean-reversion opportunities. The pullback in late June even formed a falling flag of sorts. FINX was slow out of the gate in May, but made up for lost ground in June-July with a strong move higher. Support is set at 21.
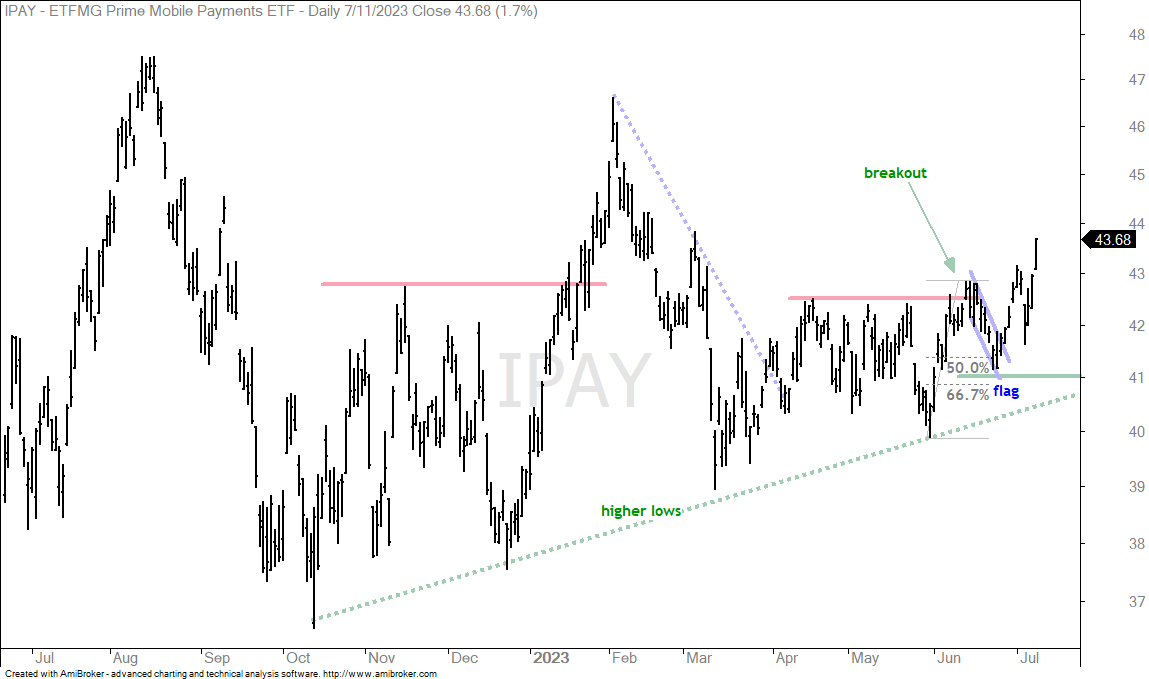
The next chart shows the Mobile Payments ETF (IPAY) with a breakout in mid June and a falling flag that retraced 50-67 percent of the prior surge. The pullback was sharp, but the retracement amount was normal for a correction after a big advance. The flag is also normal for pullbacks. IPAY broke out in late June and extended higher into July. Support is set at 41.
Tech ETFs Consolidate and Break Out (SOXX, IGV, SKYY, CIBR)
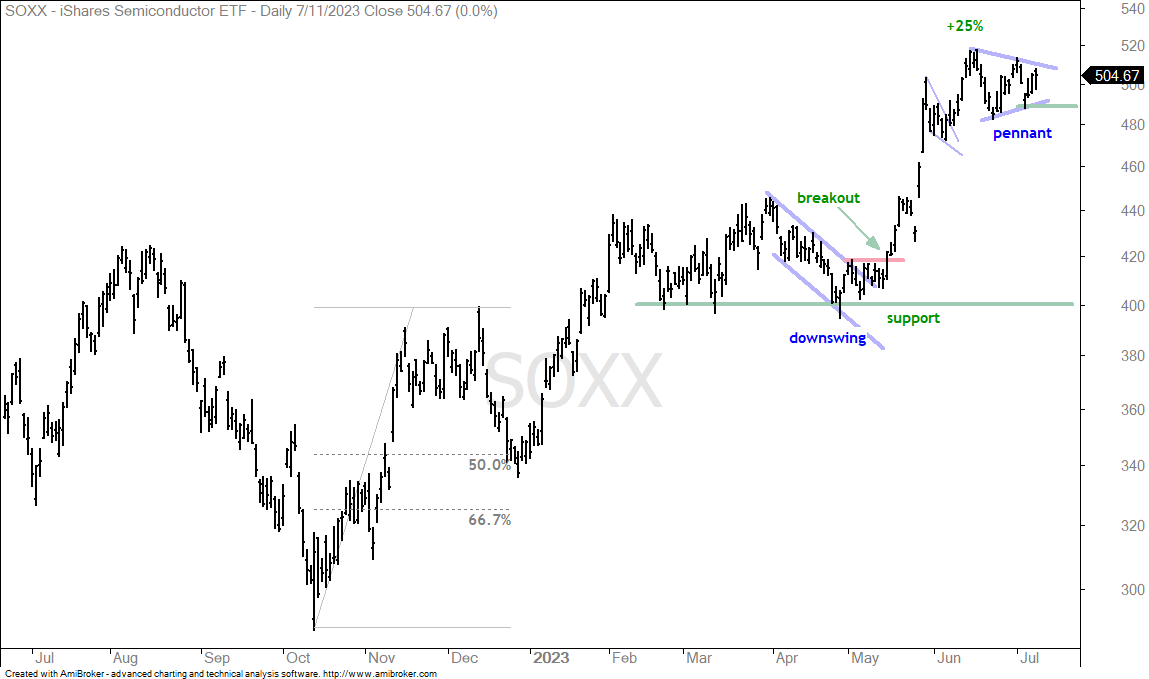
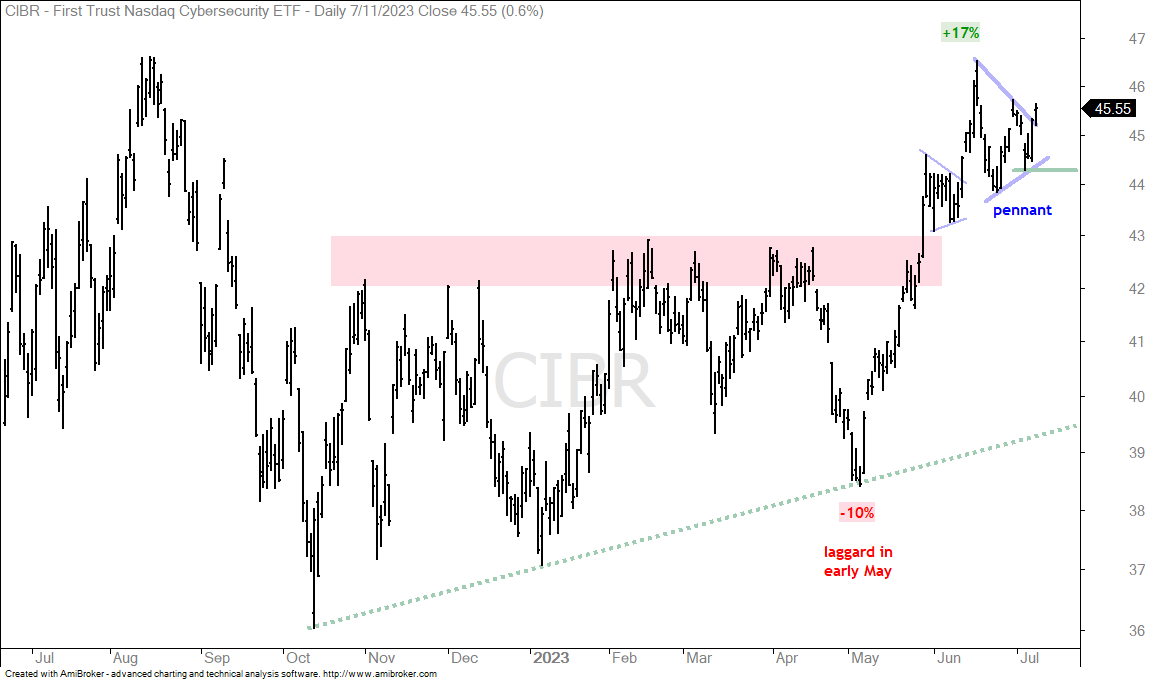
Several tech-related ETFs consolidated the last few weeks with triangles or pennants. Visually, there is no difference in these patterns. Technically, a pennant is a short-term pattern that usually extends 1-4 weeks (depending on who you ask). Anything longer is a triangle. Both are consolidations and their trading bias depends on the direction of the prior move. The tech-related ETFs surged into mid June so these are bullish consolidations. Breakouts would end these and signal a continuation higher. The low just prior to the breakout marks first support. A move below this level would negate the breakout. The first chart shows the Semiconductor ETF (SOXX) with a pennant taking shape.
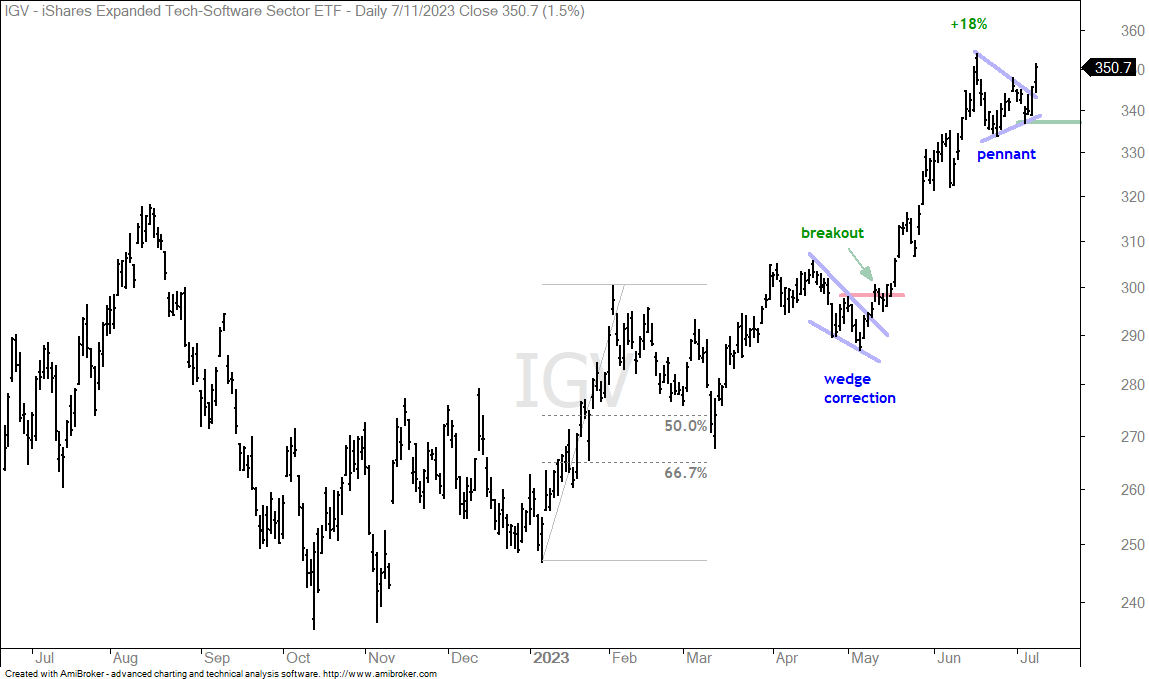
The next chart shows the Software ETF (IGV) with a pennant breakout.
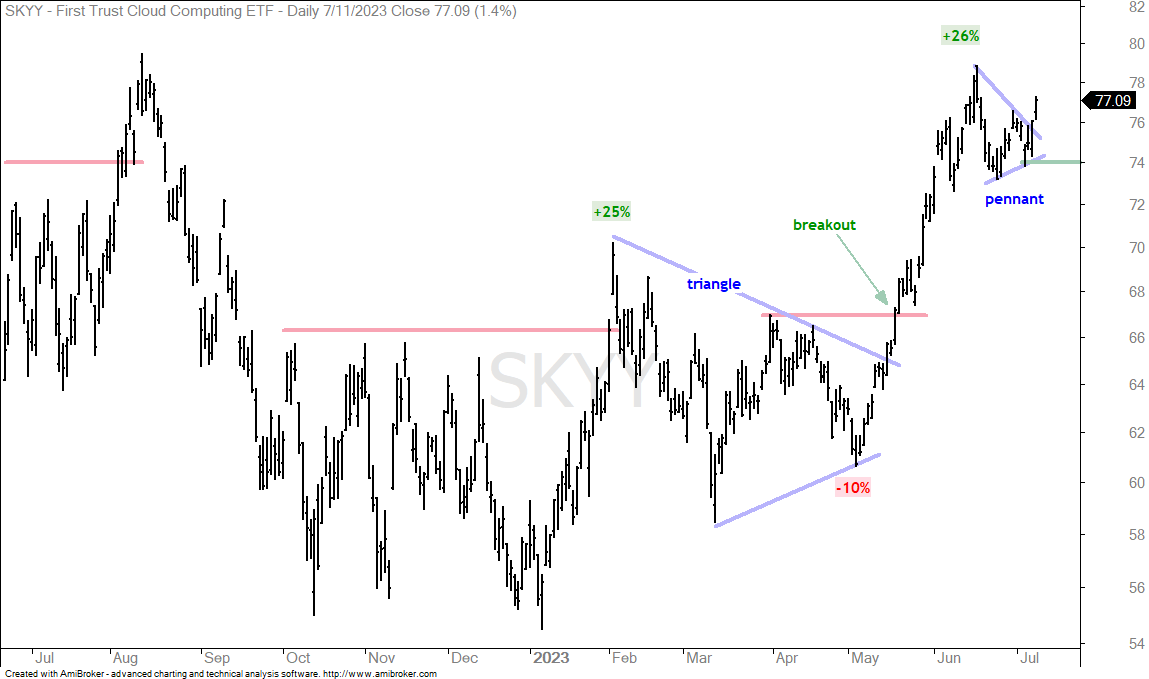
The next chart shows the Cloud Computing ETF (SKYY) with a pennant breakout.
The next chart shows the Cybersecurity ETF (CIBR) with a pennant breakout.
Retail SPDR Extends on Breakout and Housing Leads (XRT, ITB)
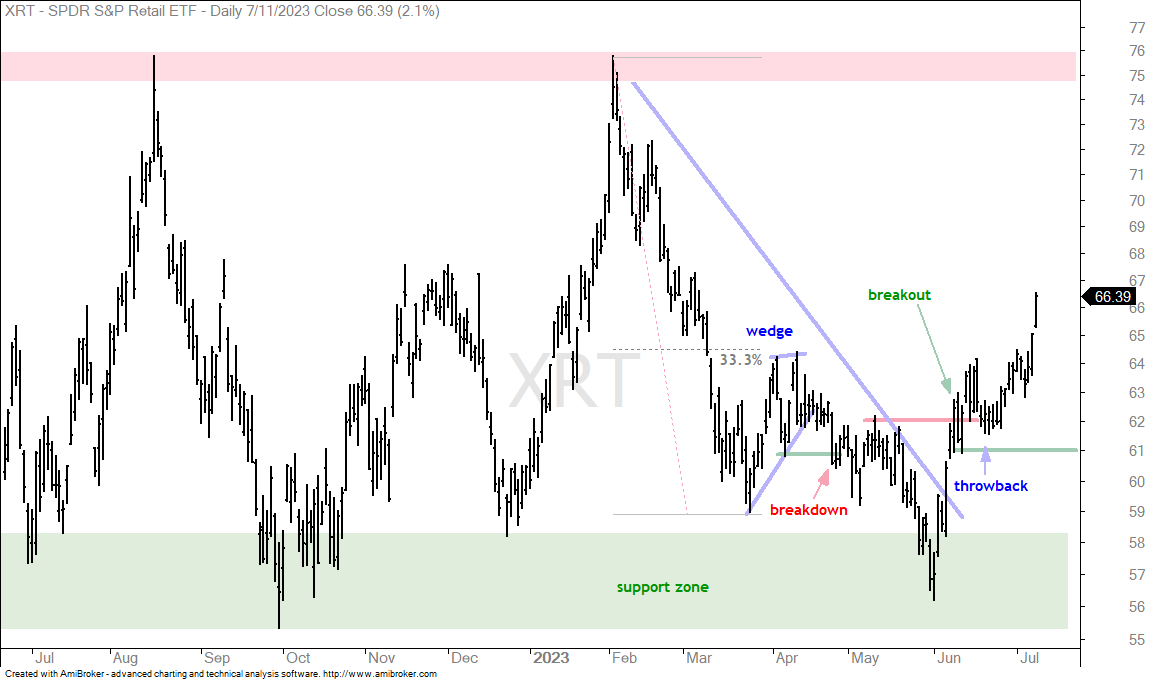
The Retail SPDR (XRT) came to life over the last five weeks with a surge off support and a breakout in mid June. There was a brief throwback to the 62 area and then another push higher the last few weeks. Strength in retail is a positive for the broader market. Support is set at 61.
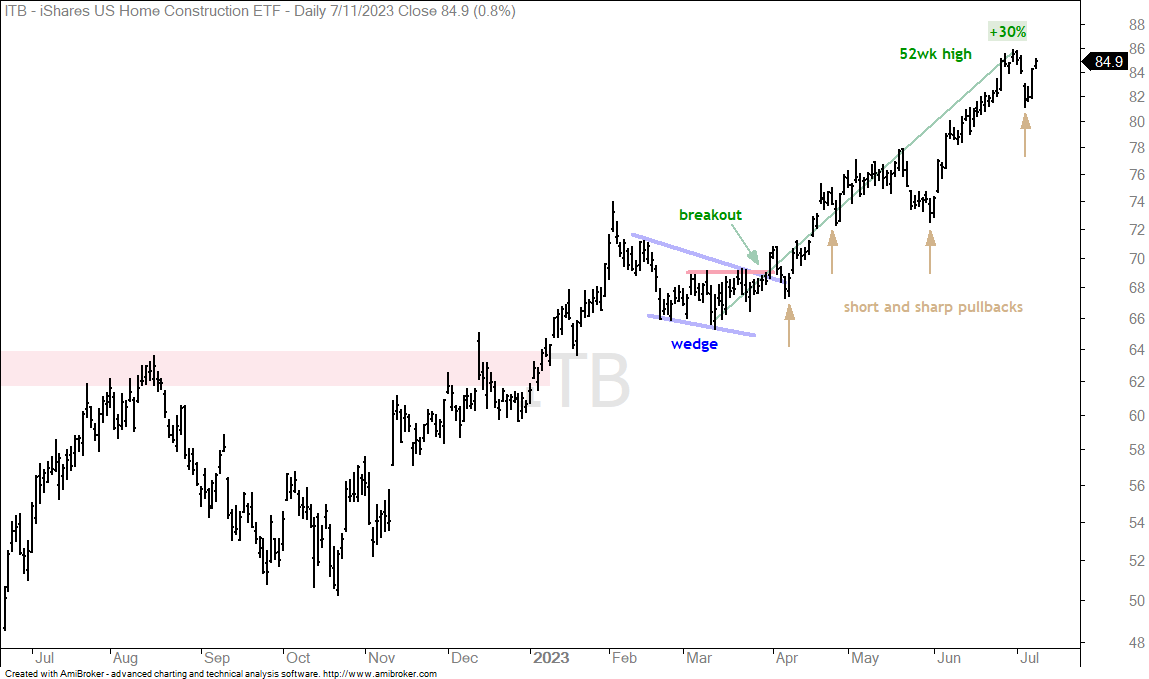
The Home Construction ETF (ITB) continues to lead the market with a new high in late June. The ETF surged some 30% from mid March to late June with four short-sharp pullbacks along the way. I do not see a setup on this chart, just a strong and leading uptrend. Strength in housing is also positive for the broader market.
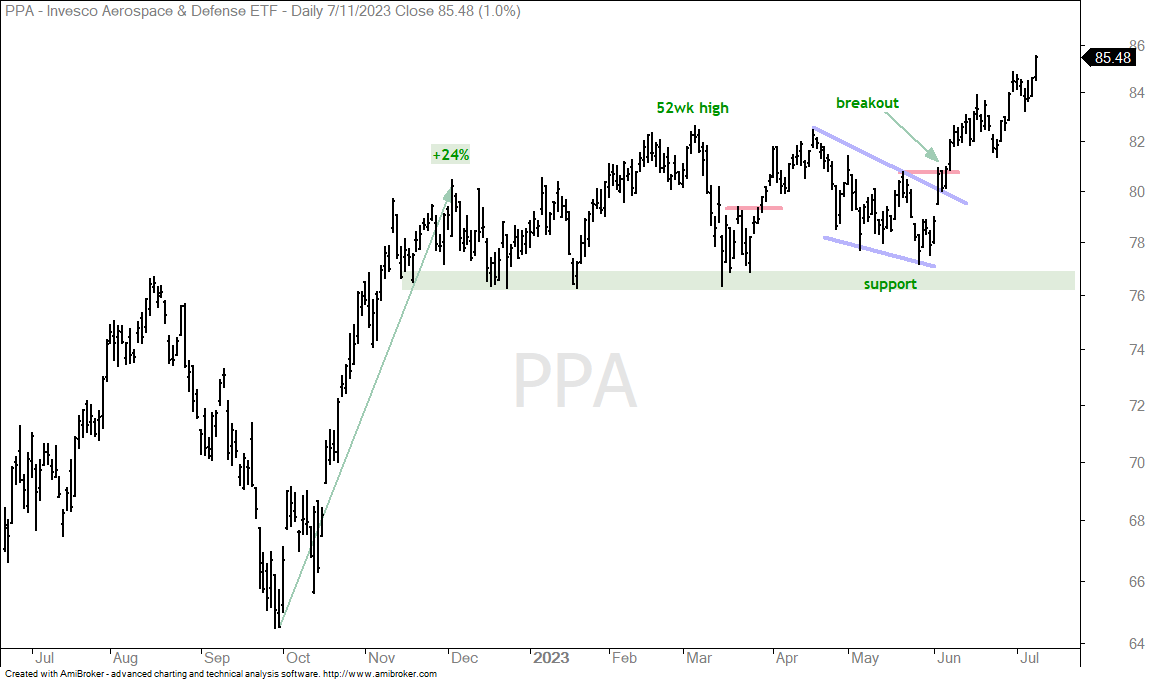
The Aerospace & Defense ETF (PPA) surged to new highs in June and July. ETFs making new highs are in strong uptrends and leading. Overall, PPA surged 24% into early December and then consolidated into June. A wedge formed into May and the ETF broke out in early June. There is no setup here, just a strong and leading uptrend.
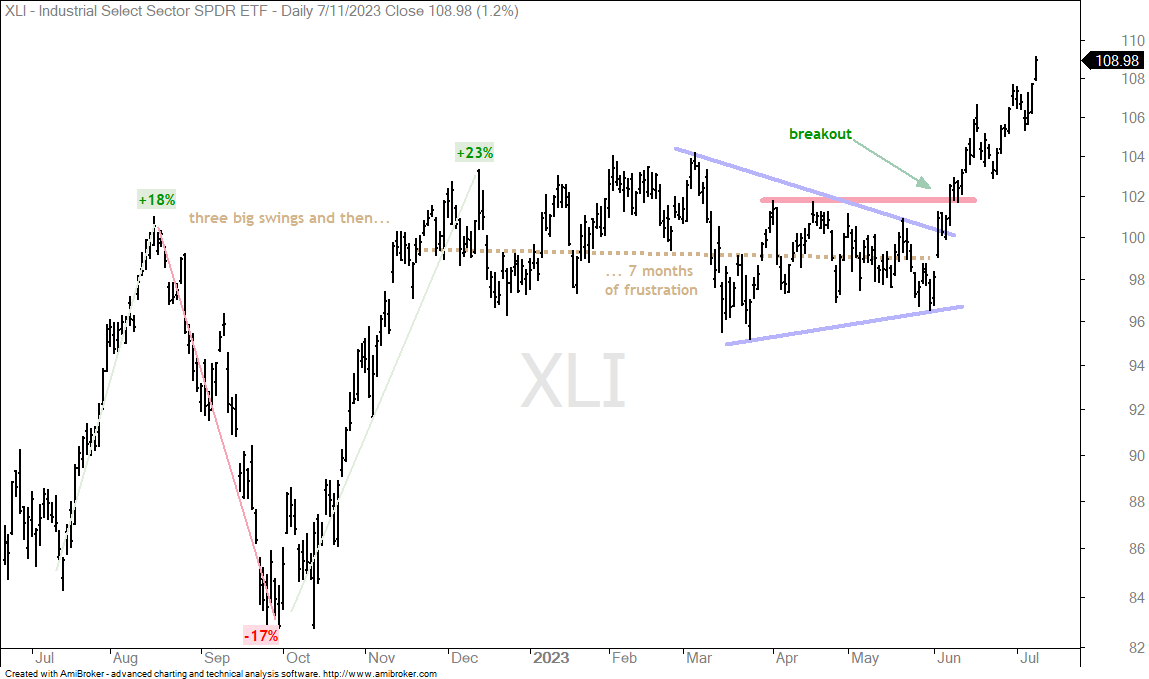
The Industrials SPDR (XLI) is a real hodge-podge of industry groups ranging from machinery to ground transport to electrical equipment. Aerospace-defense is the second largest group and accounts for 19.54% of the ETF. XLI is currently bullish with a breakout in early June and new highs the last few weeks.
Two Clean Energy ETFs with Late Breakouts (PBW, ACES)
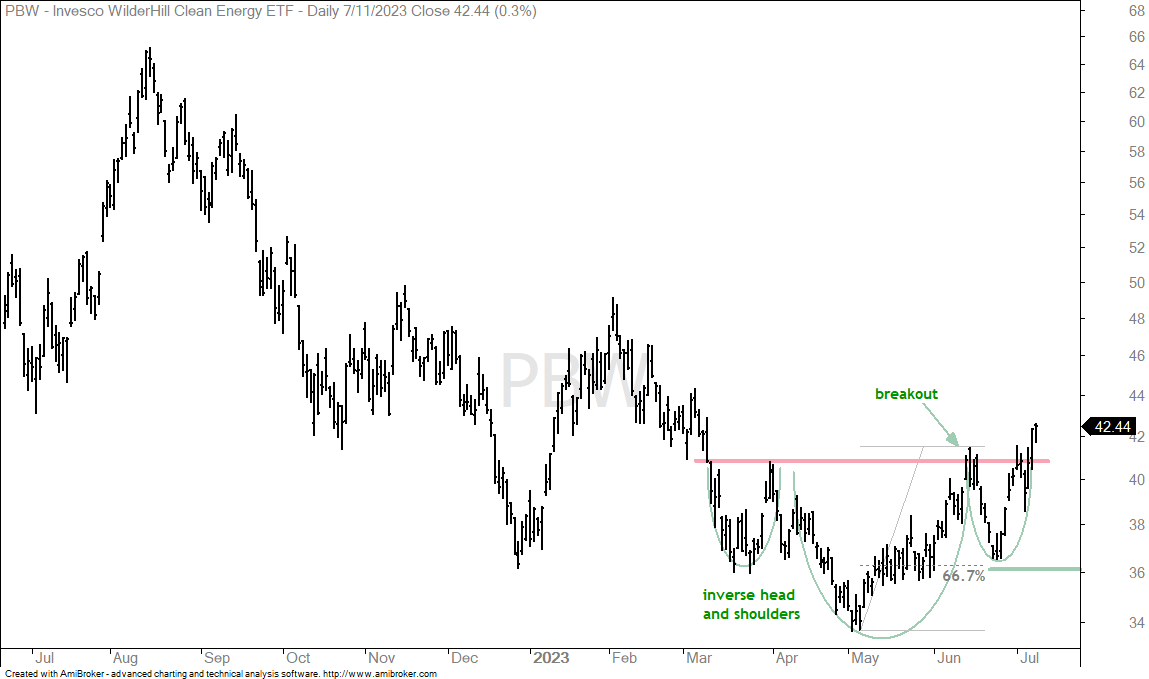
Many clean-energy stocks are part of the industrials sector and they have been lagging for the most part. However, the Clean Energy ETF (PBW) and Clean Energy ETF (ACES) are showing signs of life with bullish reversal patterns. The first chart shows PBW with an inverse head-and-shoulders. I elected to draw the neckline straight, as opposed to slightly rising. PBW broke the spring high (resistance) in June and then fell back hard into late June. This decline retraced around 67% of the prior surge and reversed on a dime. PBW broke back above the neckline and a trend reversal is in the making. Support is set at 36.
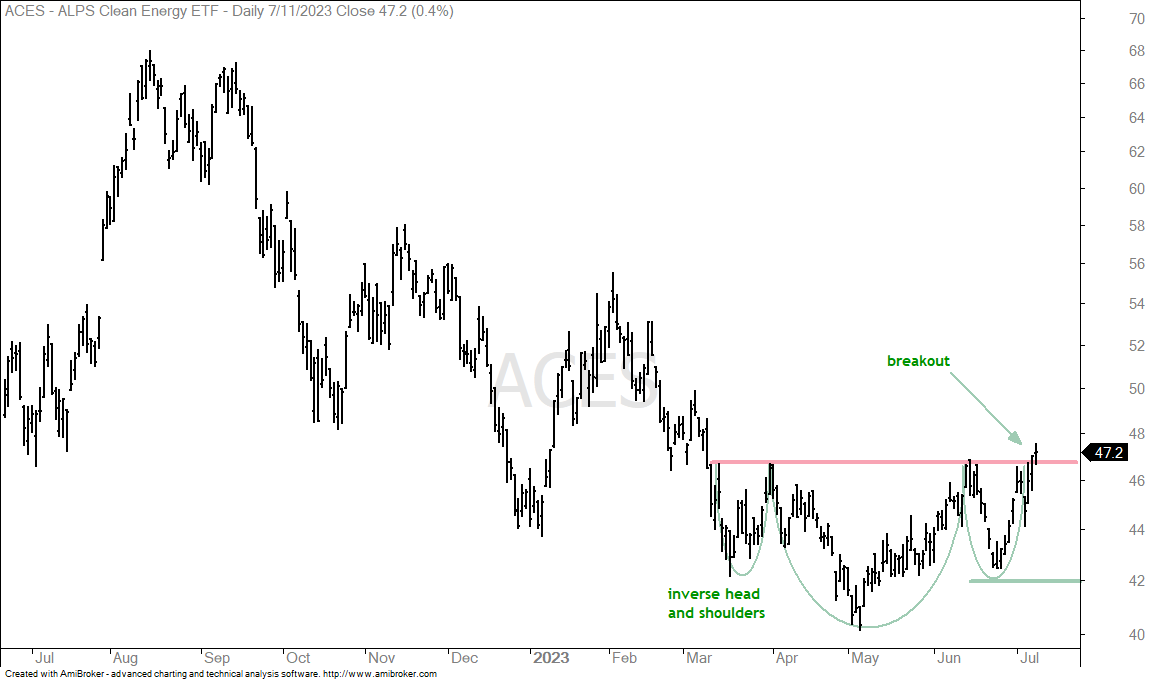
The next chart shows ACES with a neckline breakout and support at 42.
Natural Gas and Oil & Gas Equip & Services ETFs Surge (FCG, XES)
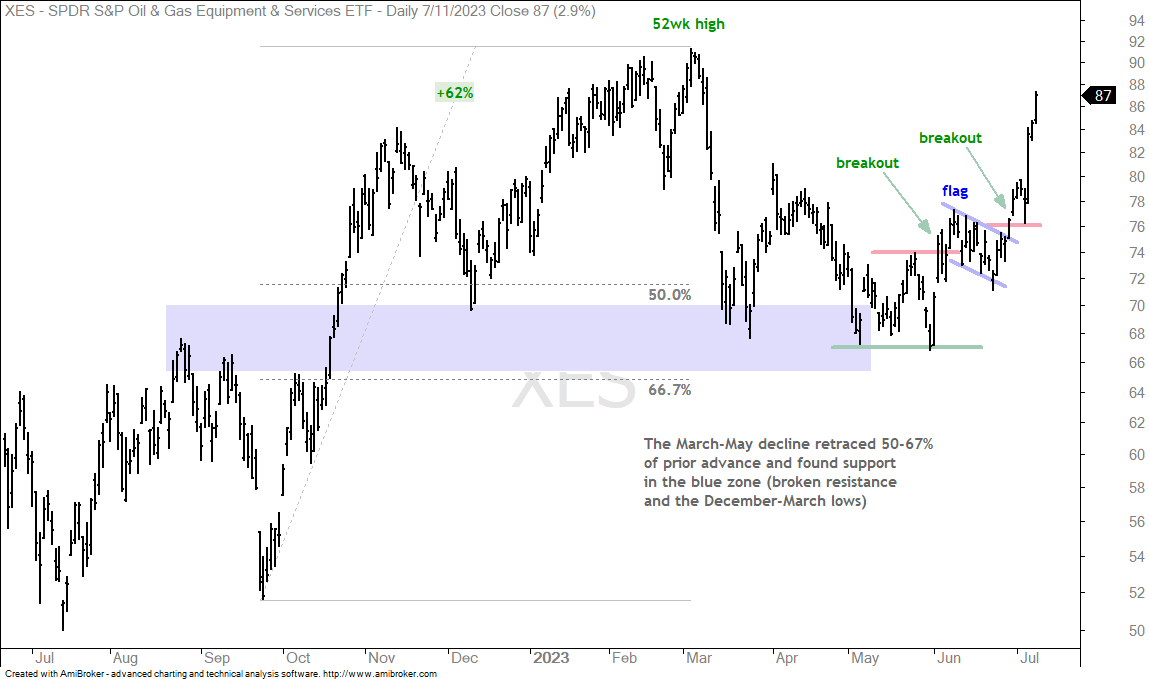
Energy-related ETFs surged the last two weeks with the Natural Gas ETF (FCG) and Oil & Gas Equipment & Services ETF (XES) getting breakouts in late June. These two were featured in the report-video on June 28th. The first chart shows XES with a breakout in early June, a falling flag into mid June and a flag breakout in late June. The ETF extended higher with a surge to 87.
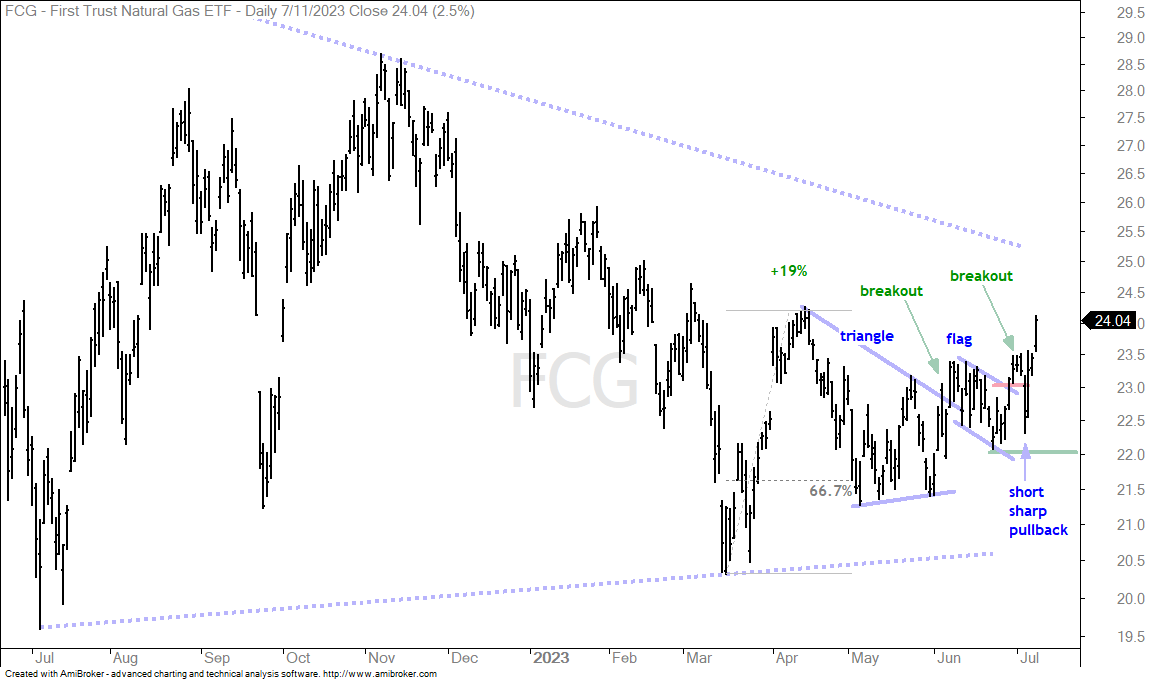
The next chart shows FCG with a triangle breakout in early June and a falling flag into late June. The ETF broke out of the flag with a surge on June 29th and then fell back hard with a decline to 22.5 on July 6th. Keep this sequence in mind: a breakout followed by a short-sharp pullback. FCG surged after this pullback and kept the breakouts alive. Key support is set at 22.
Agribusiness ETF Surges and Form Pennant (MOO)
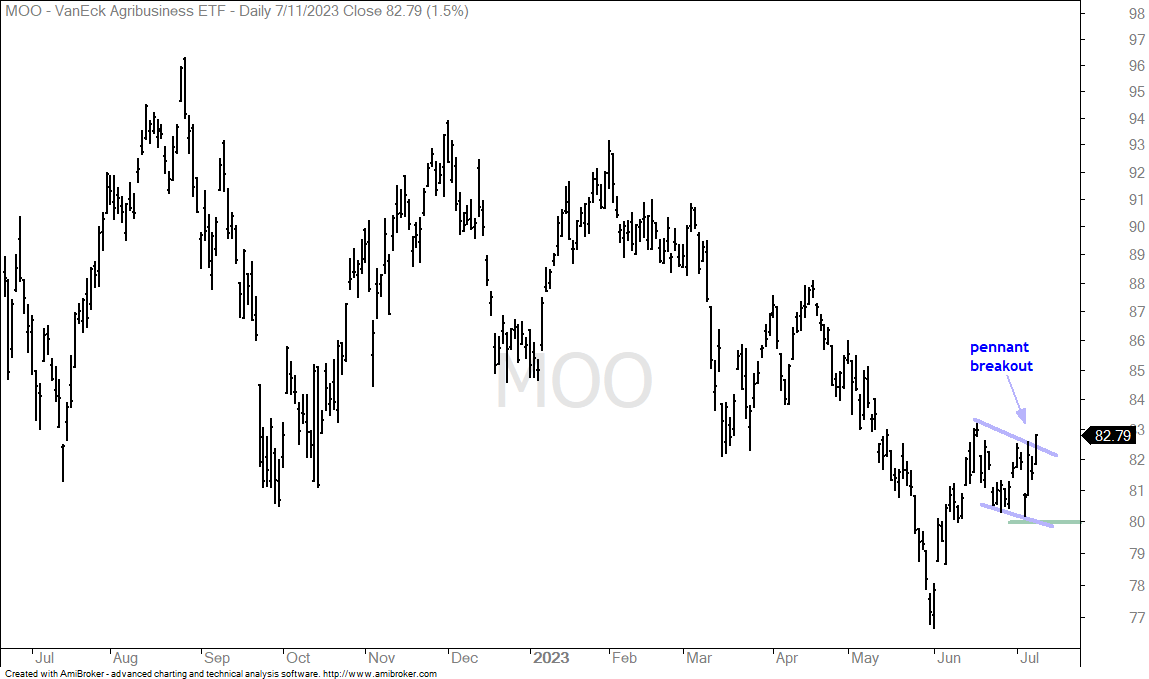
The next chart shows the Agribusiness ETF (MOO) surging in early June, correcting into early July and breaking out of a pennant with a surge on Tuesday. The long-term trend is down on this chart, but we are in a bull market and MOO is showing signs of life.
Video Games eSports ETF Breaks Out of Pennant (ESPO)
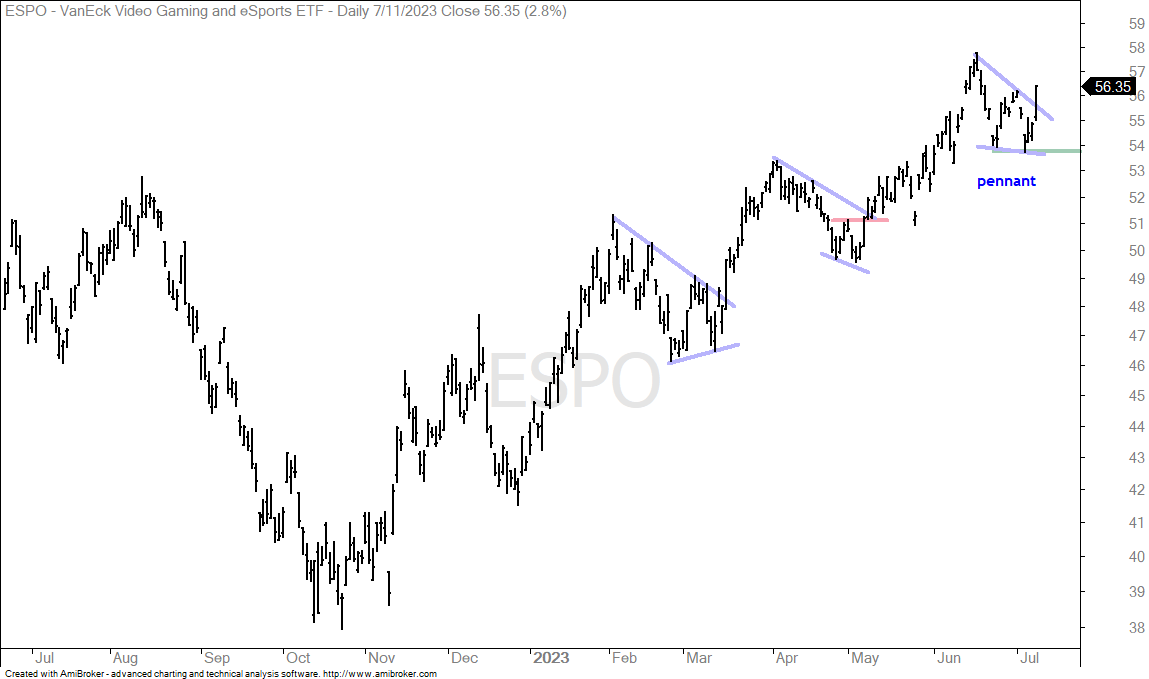
In contrast to MOO, the Video Games eSports ETF (ESPO) is in a long-term uptrend and leading the market since November. Short-term, the ETF also formed a pennant consolidation and broke out with a surge on Tuesday.
Gold and Gold Miners ETFs Remain with Downswings (GLD, GDX)
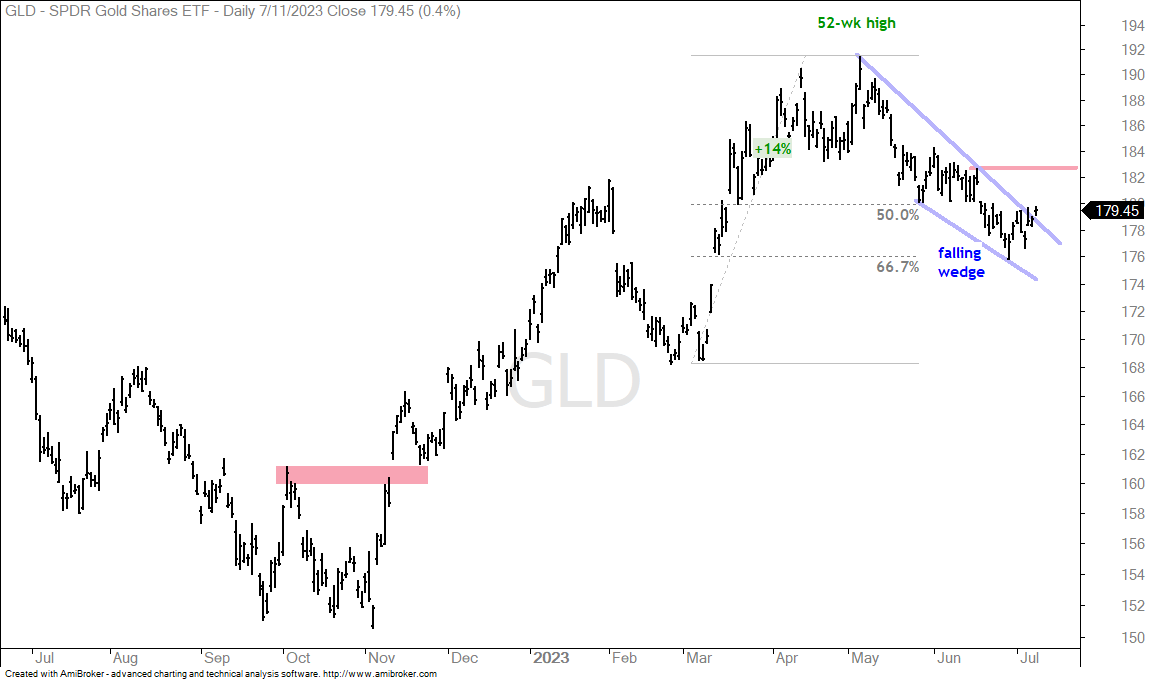
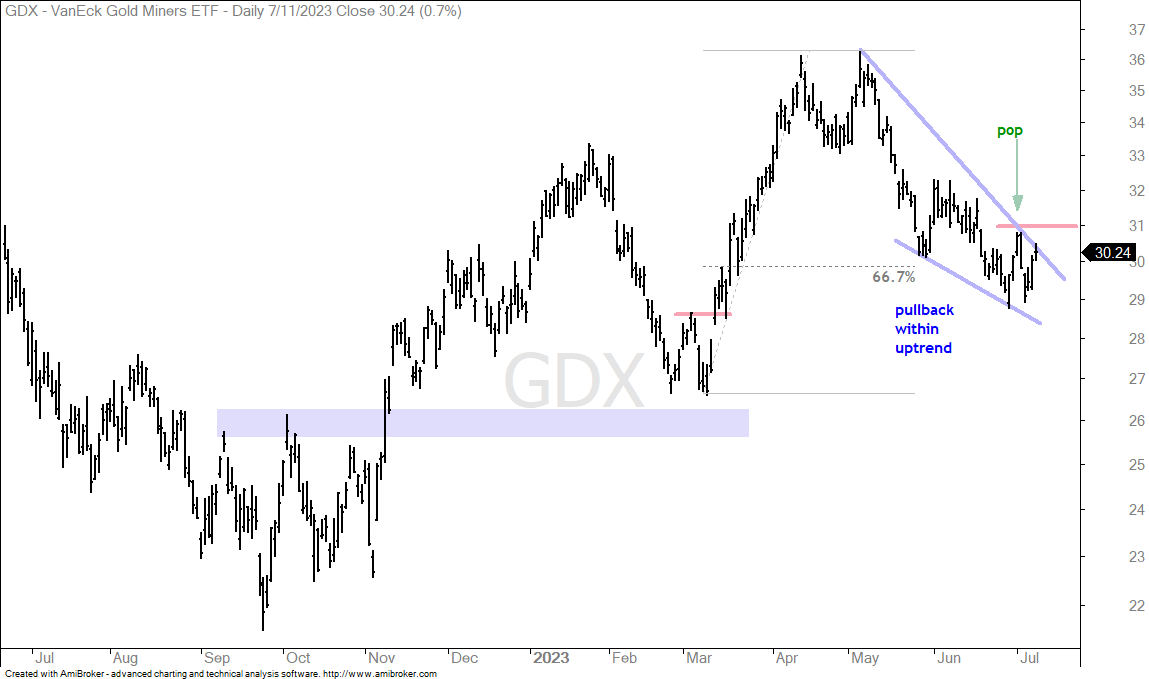
The Gold SPDR (GLD) and Gold Miners ETF (GDX) remain in short-term downtrends. Both are in long-term uptrends and these short-term downtrends are considered corrections. Gold is simply out of favor right now and not attracting any interest. The first chart shows GLD with a falling wedge that retraced around 67% of the prior advance. GLD broke the wedge line with a bounce on Tuesday, but has yet to clear a significant resistance level. I am marking first resistance at 183.
GDX sports a similar chart, but the pullback is deeper (greater than 67 percent). GDX popped to around 31 on July 1st and then fell back to the 29 area. This pop and drop establishes a resistance level to watch for a breakout. It does not correspond to the resistance level in GLD, but is worth watching.