Strength in the stock market is narrow, which means a handful of stocks are keeping the market afloat. Put another way, weakness within the stock market is broad-based, which means the majority of stocks are under pressure. We can see this in the breadth indicators and the small-cap ETFs. SPY and QQQ are holding up relatively well, but the Russell 2000 ETF (IWM) and Russell Microcap ETF (IWC) are not. IWM broke its December low this month and IWC hit a 52-week low last week. Large-caps do not have to follow small-caps lower, but I would watch closely because the weight of the evidence is bearish for stocks. Todays’ report will show key levels to watch for the current upswing in SPY and QQQ. We will close cover the breakouts in precious metals, the stall in TLT, the breakout in copper and the breakout in Consumer Staples.
About the ETF Trends, Patterns and Setups Report
This report contains discretionary chart analysis based on my interpretation of the price charts. This is different from the fully systematic approach in the Trend Composite strategy series. In this ETF Trends, Patterns and Setups report, I am looking for leading uptrends and tradable setups within these uptrends. While I use indicators to help define the trend and identify oversold conditions within uptrends, the assessments are mostly based on price action and the price chart (higher highs, higher lows, patterns in play). Sometimes the chart assessment can be at odds with the indicators.
Report Schedule
Tuesday – 28-Mar: Market/ETF Report
Wednesday – 29 Mar: Market/ETF Video
Thursday – 30 Mar: Strategy Update or Article
Systematic Strategies and Tables
Here are the three active strategies and their respective tables.
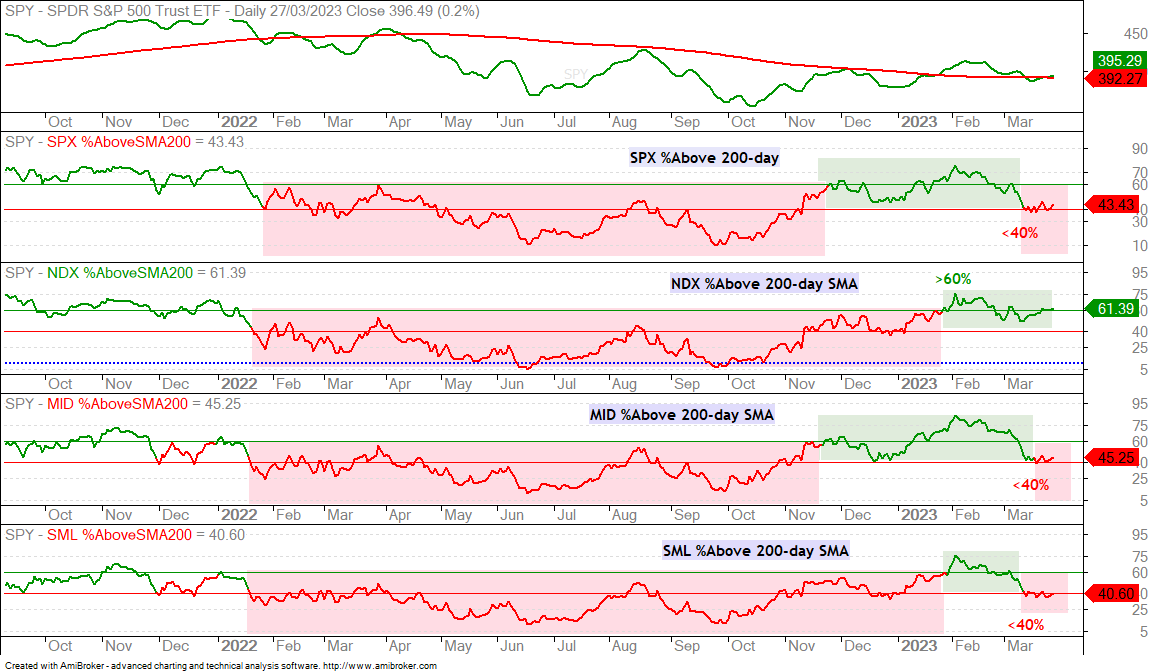
This is a very selective stock market. Some large-caps are in uptrends and leading the market. Most of these are large-cap tech stocks (Nasdaq 100). And then we have the rest of the market, the great majority. 61.4% of Nasdaq 100 stocks are above their 200-day SMAs, but only 42.8% of S&P 1500 stocks are above their 200-day SMAs. This is a big difference. The chart below shows the percentage of stocks above the 200-day SMA for the S&P 500, Nasdaq 100, S&P MidCap 400 and S&P SmallCap 600. NDX %Above 200-day is the only one that did not dip below 40% in early March. The cup is half full for the Nasdaq 100, but half empty for large-caps, mid-caps and small-caps as these three dipped below 40% in early March (<40%)
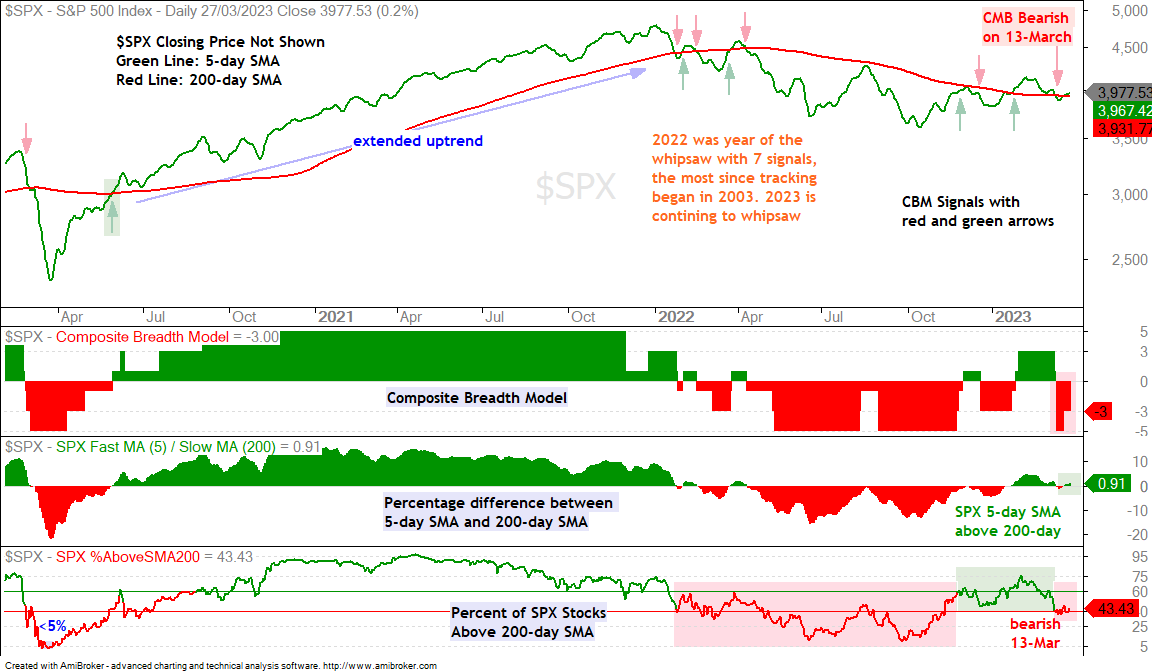
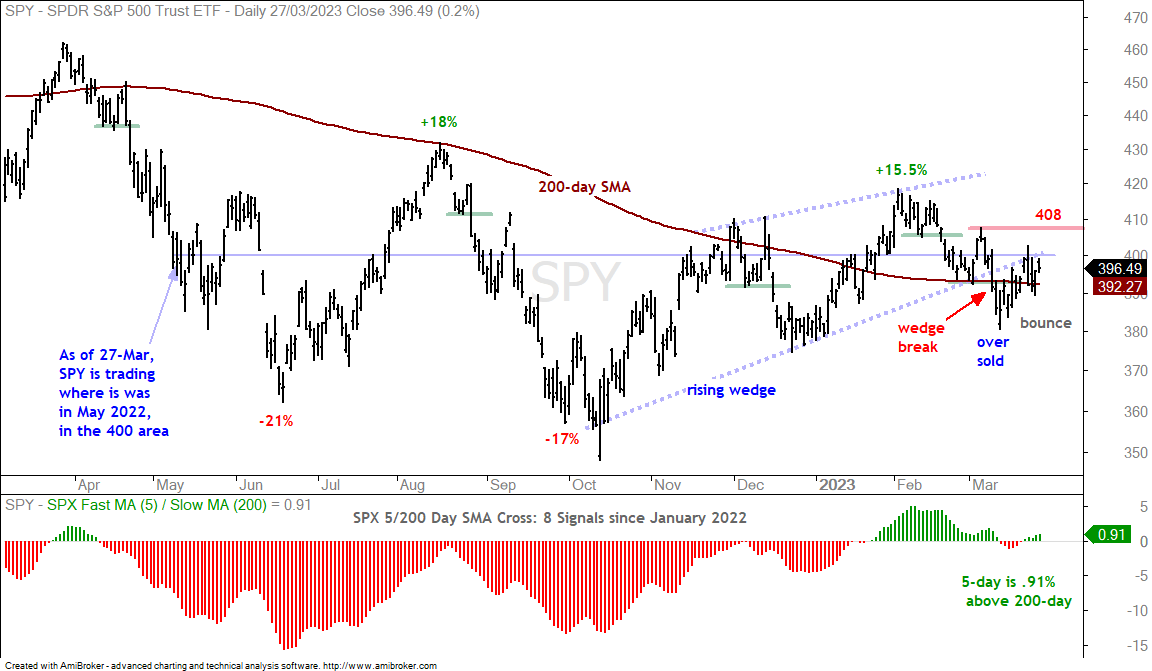
The next chart shows the Composite Breadth Model, which takes a weight of the evidence approach using breadth indicators. Note that breadth indicators favor the “average” stock (small-caps and mid-caps). See Friday’s report for more details. The CBM is bearish (-3), which means risk is above average in the stock market. The 5-day SMA for the S&P 500 is above the 200-day SMA (+.91%). The S&P 500 is dominated by large-caps and this means large-caps are holding up.
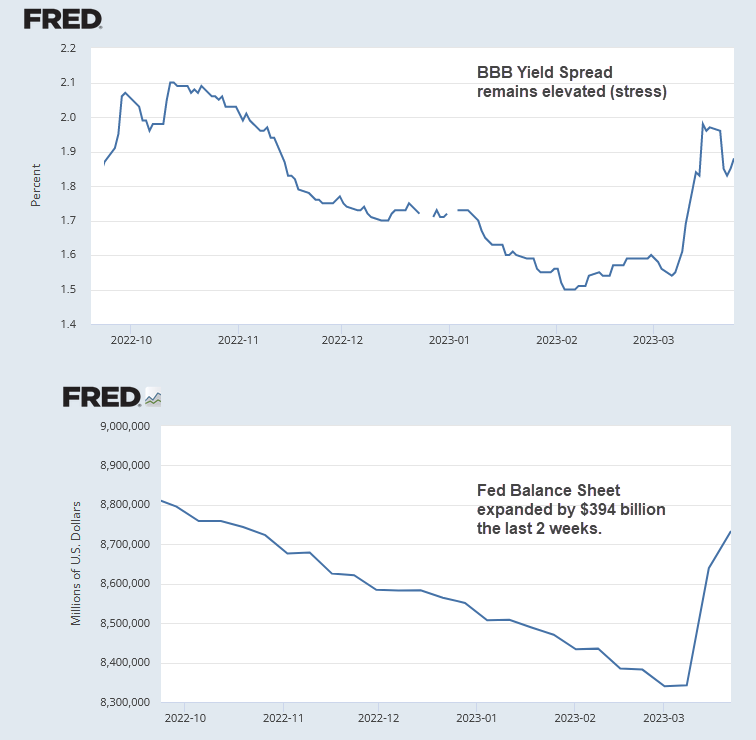
We can also see a discrepancy between the BBB yield spread and the Fed balance sheet. The BBB spread remains elevated and showing stress in the credit markets. The Fed is doing its best to counter this stress because its balance sheet expanded by $394 billion the last two weeks and erased five months of contraction. Small-caps are more sensitive to credit conditions and large-caps are the first to react to the Fed balance sheet. Note that yield spreads, the Fed balance sheet and the CBM will be updated on Wednesday.
The Wedge Break Remains for SPY
SPY has gone everywhere since April and nowhere since May. There are four double digit swings since April as SPY fell 21% into the June low, rose 18% into the mid August high, fell 17% into the mid October low and rose 15.5% into the early February high. Even with big swings, SPY is trading near the 400 level (blue line) and near the levels seen in May 2022. What a mess.
SPY reversed its uptrend with a wedge break on March 9th and became short-term oversold a few days later. This oversold condition gave way to the current bounce, but I am not ready to negate the wedge break because oversold bounces are normal. A break above the early March high (408) would call for a re-evaluation of the wedge break. Until then, the wedge break is bearish.
Key Level for Up Swing in SPY
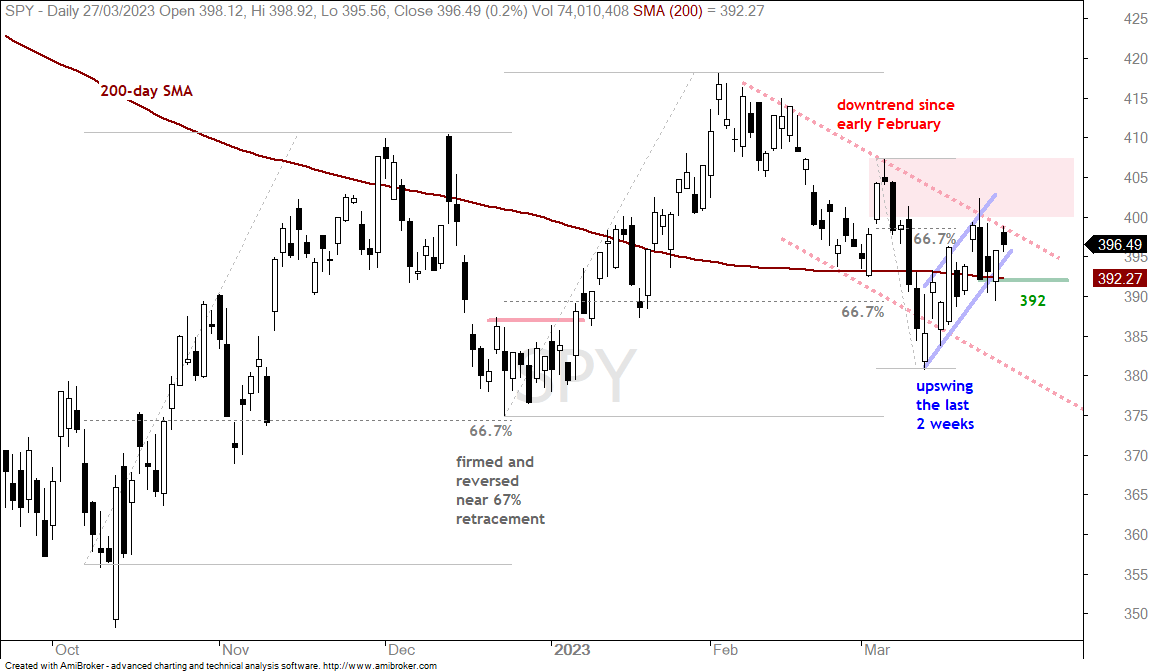
The next chart shows the S&P 500 SPDR (SPY) with candlesticks over the last six months. This is a short-term chart designed to catch the current price swings. The red dashed lines mark a downswing since early February. SPY broke above the 200-day SMA in late January and returned to this moving average in March. The decline exceeded the 67% retracement, but SPY managed a bounce the last two weeks and is back above the 200-day SMA. This is just an oversold bounce within a short-term downtrend (February-March). A break above the March high (408) is needed to suggest otherwise.
Short-term, the blue lines define the current bounce, which retraced around 2/3 of the early March decline. This puts SPY in a potential reversal zone because oversold bounces within bigger downtrends are expected to fizzle after retracing 50-67 percent. SPY is also right at the upper trendline of the falling channel (red). A close below 392 would reverse the short-term uptrend and argue for a continuation lower.
QQQ Leading Until it Doesn't
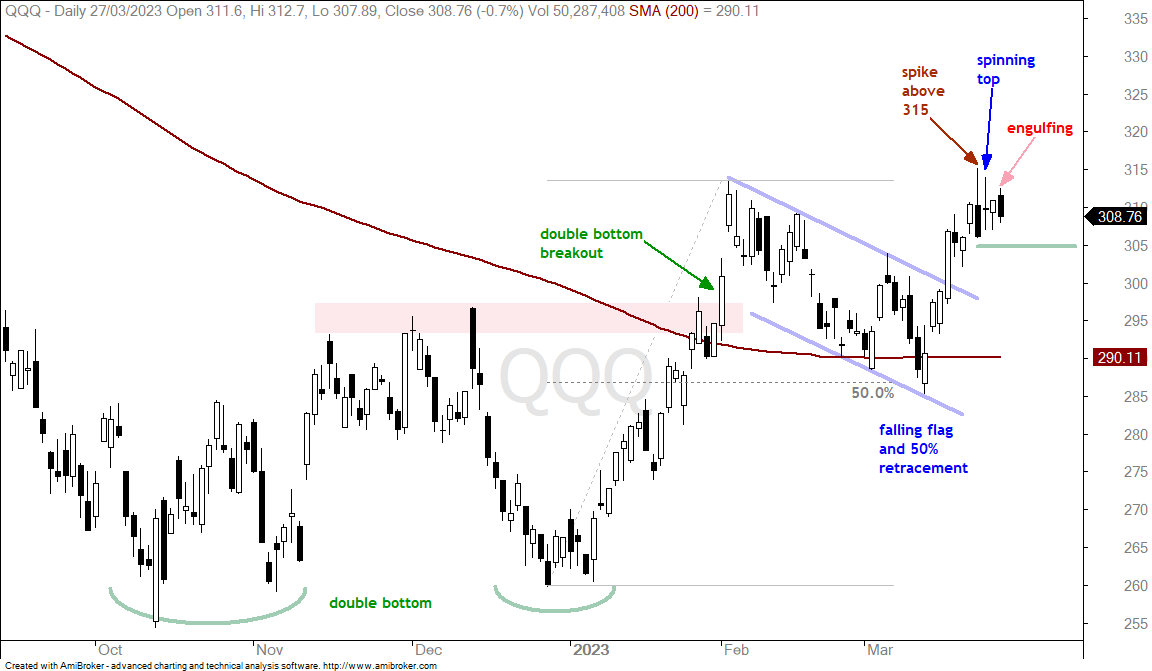
Large-cap tech stocks are currently leading and they will continue leading, until they don’t. There are some short-term signs of fatigue in the QQQ candlesticks. QQQ broke out of a falling flag with a surge on March 16th. The ETF then worked its way higher the last seven days, but we are starting to see some indecision. QQQ spiked above 315 on March 22nd and closed near 306. This shows a failed rally attempt as sellers took over. The ETF then formed a spinning top on March 23rd and this shows indecision. QQQ then formed a bearish engulfing on Monday. The immediate swing is up for now. These candlesticks are building a potential reversal zone and a break below 305 would reverse the short-term upswing
XLK Holds Flag Breakout
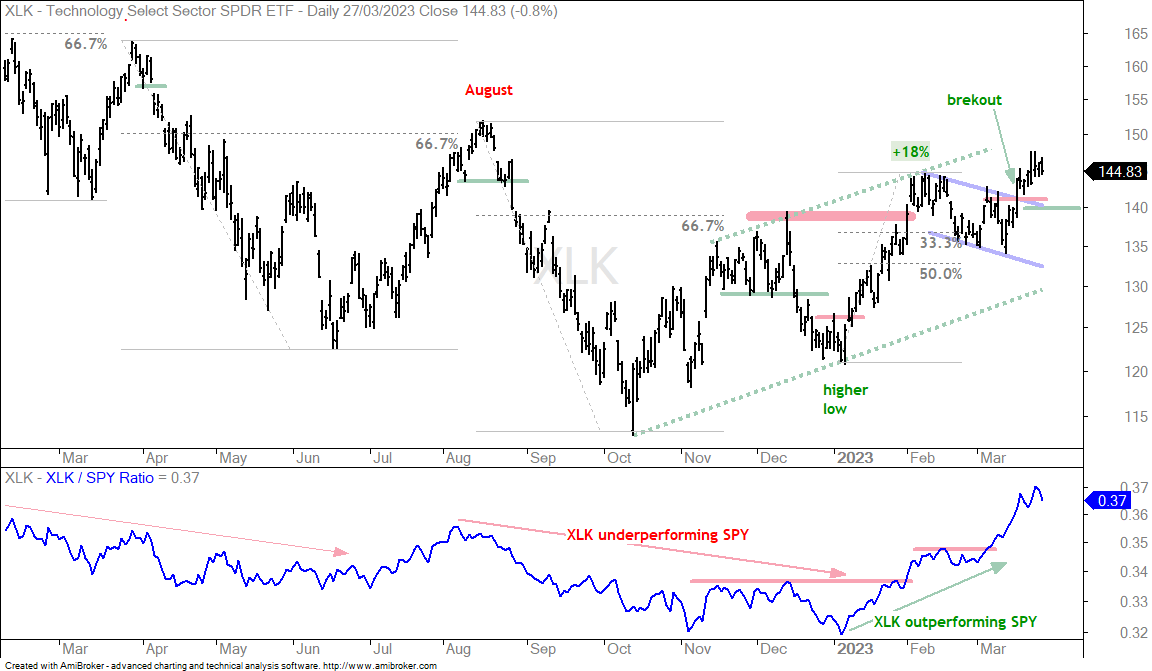
The short-term support level on the QQQ chart (305) is quite tight and aimed at identifying the first sign of trouble. The tighter the level, the higher the chance of a whipsaw (bad signal). The next chart shows the Technology SPDR (XLK) with a falling flag and a breakout on March 16th with a 2.6% surge. This breakout is bullish until proven otherwise and this means the 2.6% surge needs to hold. A close below 298 would negate this flag breakout and call for a re-evaluation.
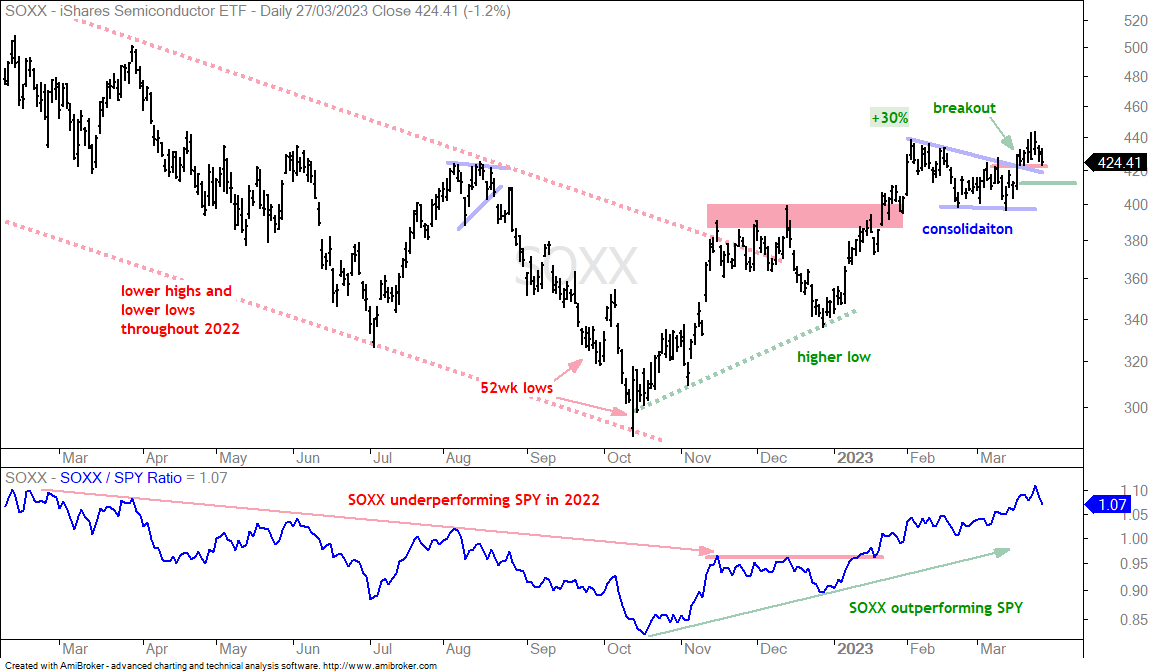
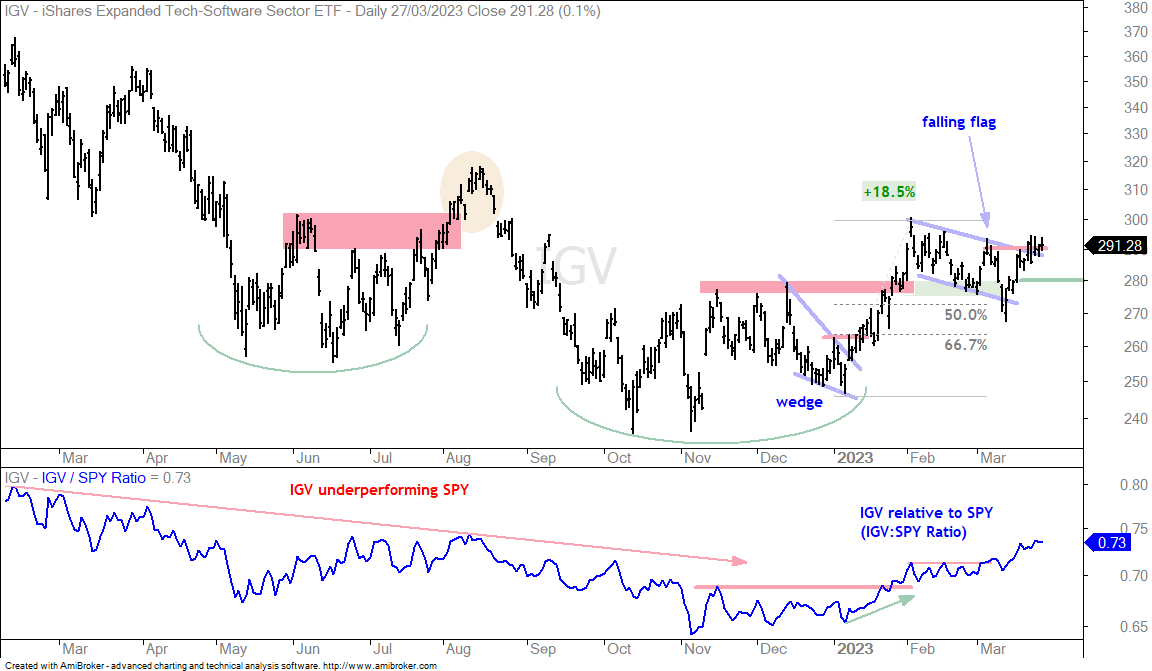
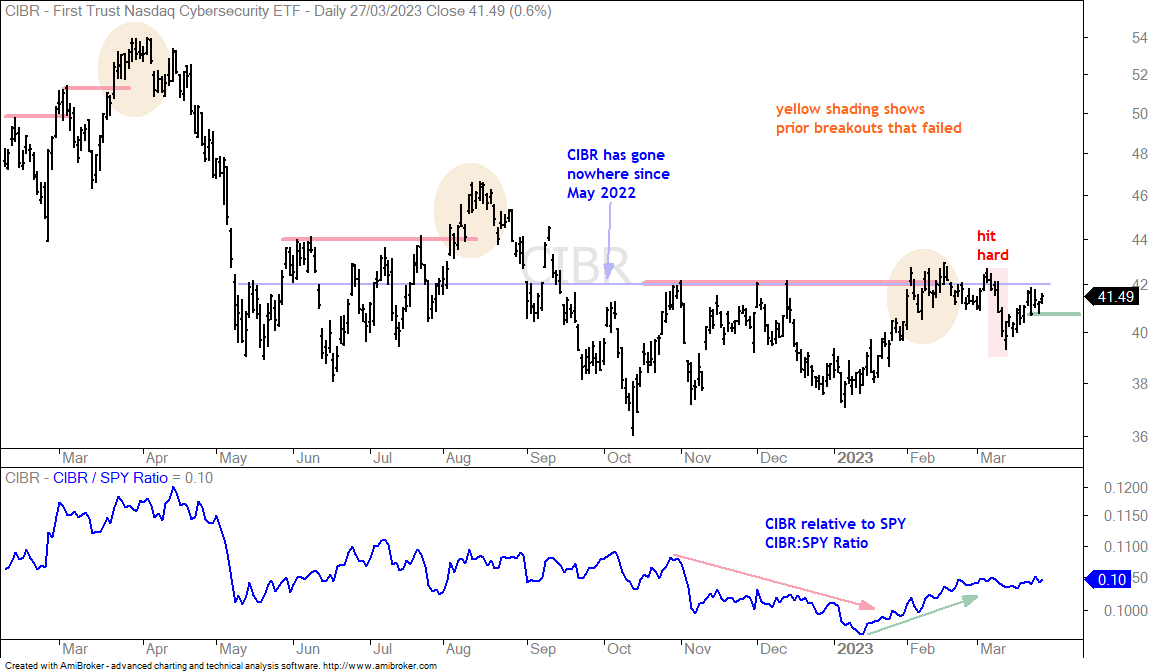
Semis, Software and Cyber Look Shakey (SOXX, IGV, CIBR)
Most tech-related ETFs will follow QQQ and XLK so chartists can watch these two for clues. The first chart shows the Semiconductor ETF (SOXX) with a 30% surge, a consolidation and a break above the early March high. SOXX did not extend after this breakout and stalled above 420. Picking the failure level is tricky, but I will use the March 16th surge and call this a failure on a close below 412.
The next chart shows the Software ETF (IGV) with a falling flag and a breakout attempt last week. This breakout attempt is not gaining traction because IGV cannot stay above its early March high (red line). A close below 280 would call for a re-evaluation.
The Cybersecurity ETF (CIBR) is struggling even more because it did not even challenge its early March high on the current bounce. The yellow ovals show prior breakout attempts that failed. Truth be told, there isn’t much trend on this chart because CIBR has gone nowhere since May 2022. CIBR was leading in February, but got hit hard in early March (red shading) and bounced the last two weeks. This looks like an oversold bounce and a close below 40.70 (red line) would reverse this short-term upswing.
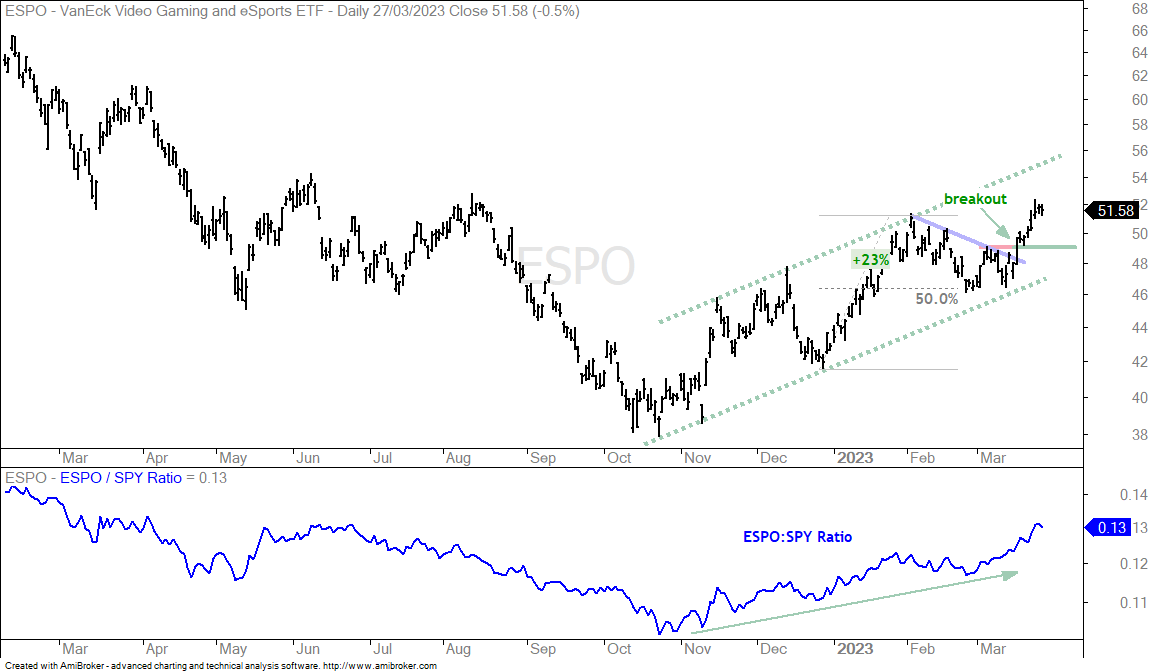
Video Games eSports ETF Extends on Breakout (ESPO)
The Video Games eSports ETF (ESPO) broke out on March 16th and extended higher with a move above 51 last week. The breakout level at 49 marks the first re-evaluation level.
Dollar Swings Lower as TLT Stalls below Resistance
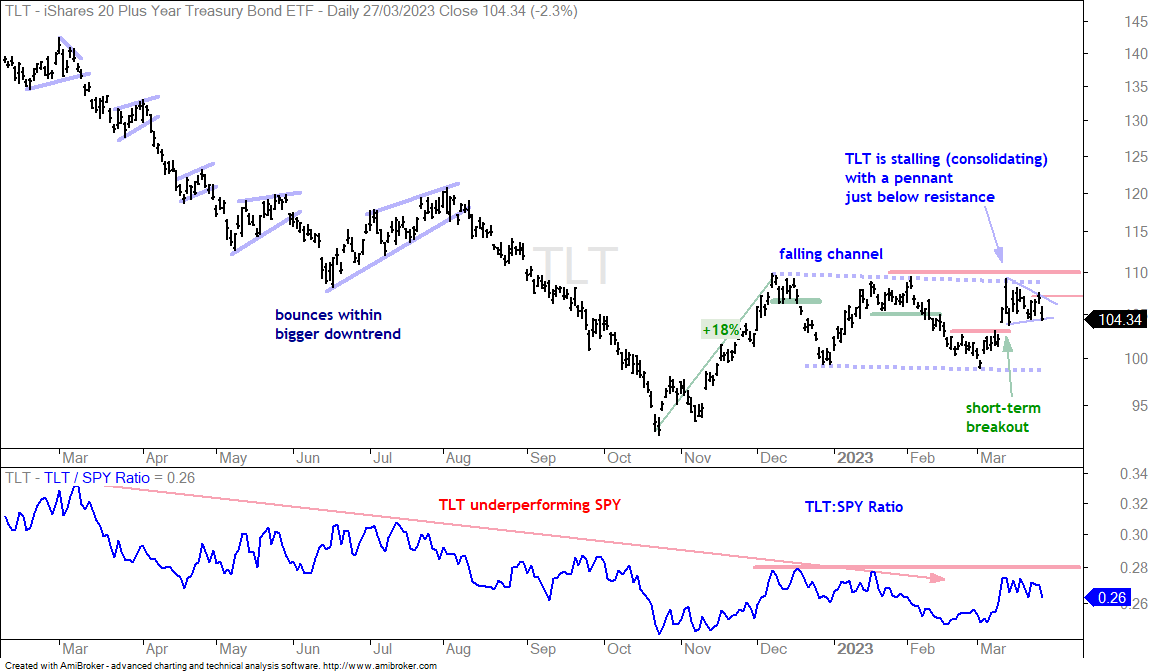
I will cover the 20+ Yr Treasury Bond ETF (TLT) and Dollar Bullish ETF (UUP) before getting to precious metals. The chart below shows TLT within a falling channel since December. There are four swings within this channel and the current swing is up since the short-term breakout on March 10th. TLT stalled since this breakout with a pennant forming. Further weakness below 104 would reverse this upswing. A breakout at 107 would be short-term bullish and increase the chances for a bigger breakout at 110.
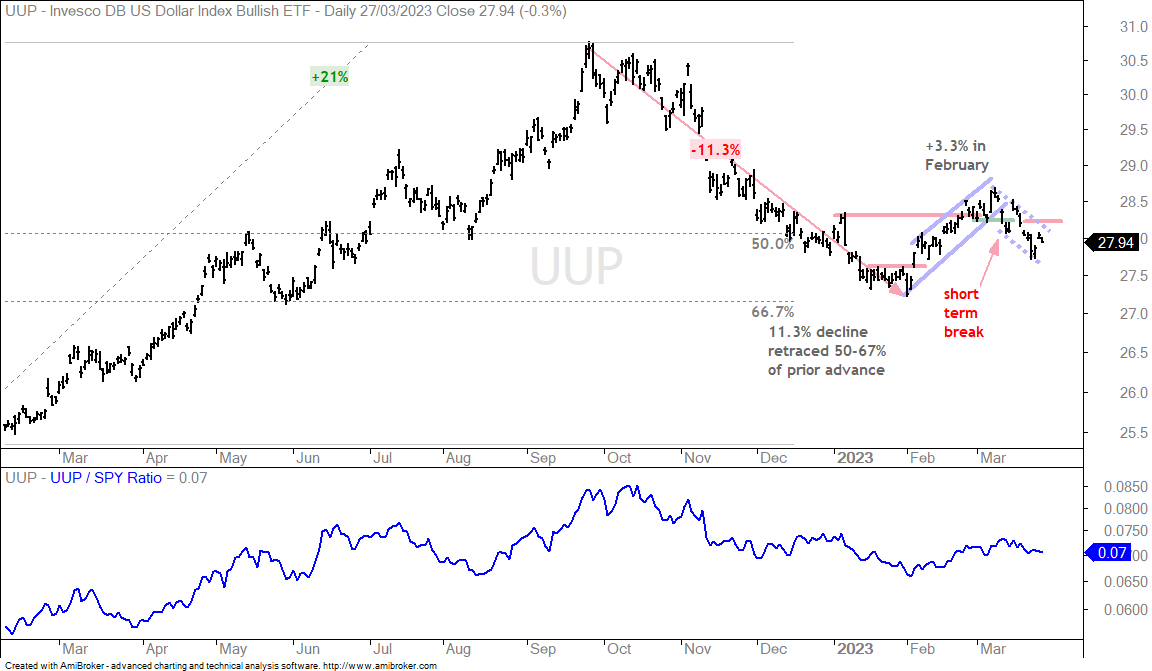
The next chart shows UUP breaking short-term support with a sharp decline in early March. The price swing is down for UUP with the blue dashed lines defining this downswing. A close above 28.20 would reverse the downswing and be short-term bullish.
Gold Turns Volatile after Breakout (GLD, SLV, PLTM, GDX, SIL)
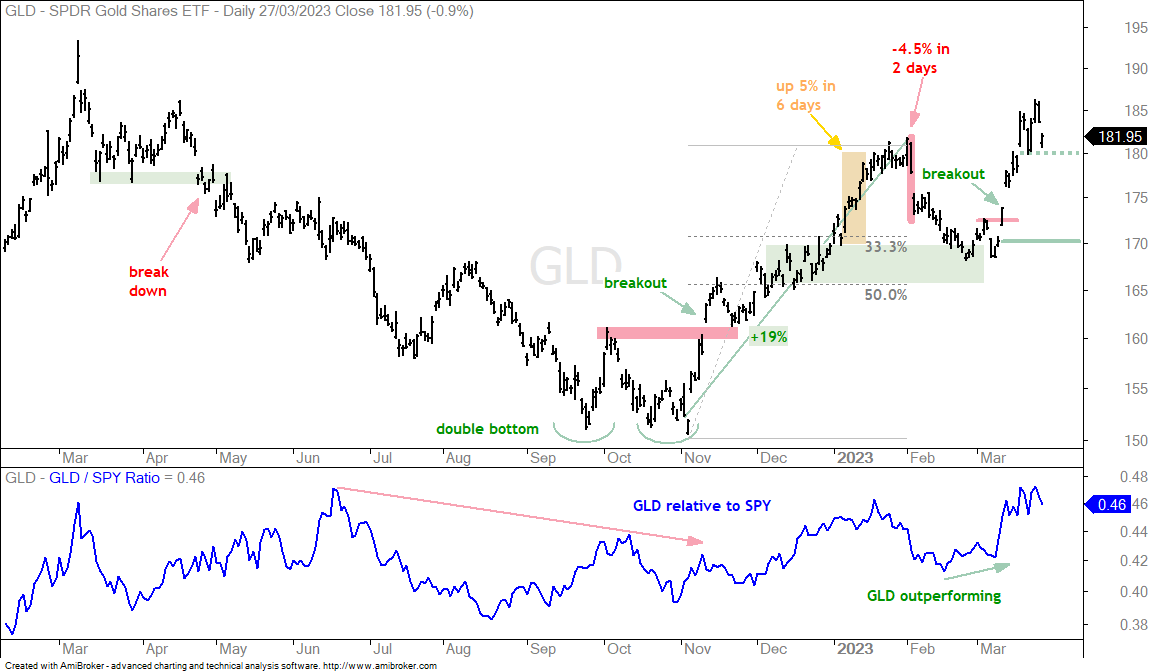
The precious metals ETFs surged from March 9th to 23rd as crisis hit the finance sector and the Dollar moved lower. The breakouts are bullish, as are the extensions after the breakouts. Volatility and the re-evaluation levels are the current challenge. I will not pretend to fully understand what is driving the price of gold. The Dollar plays a role, but there are other forces at work. An upside breakout in the Dollar and a short-term support break (180) in the Gold SPDR (GLD) would be the first sign of trouble. Other than 180, I do not see another level worth watching until we get to 170.
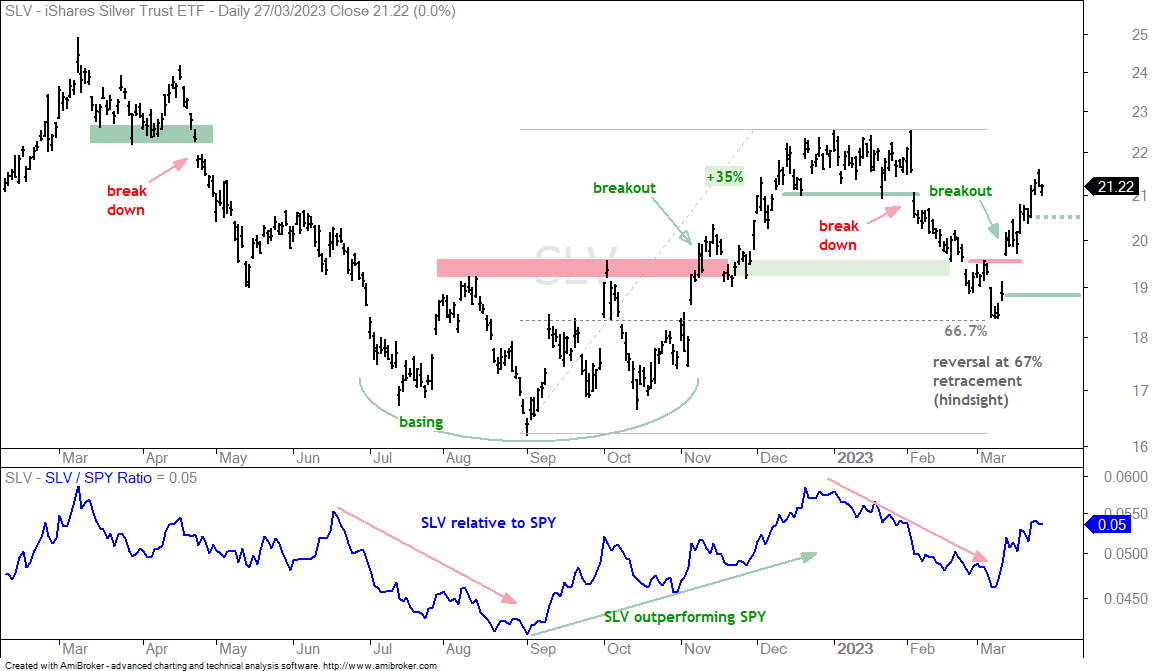
The next chart shows the Silver ETF (SLV) with re-evaluation levels at 20.50 and 18.80. Traders can re-evaluate on the early support break or the late break. There is not much in between these two levels.
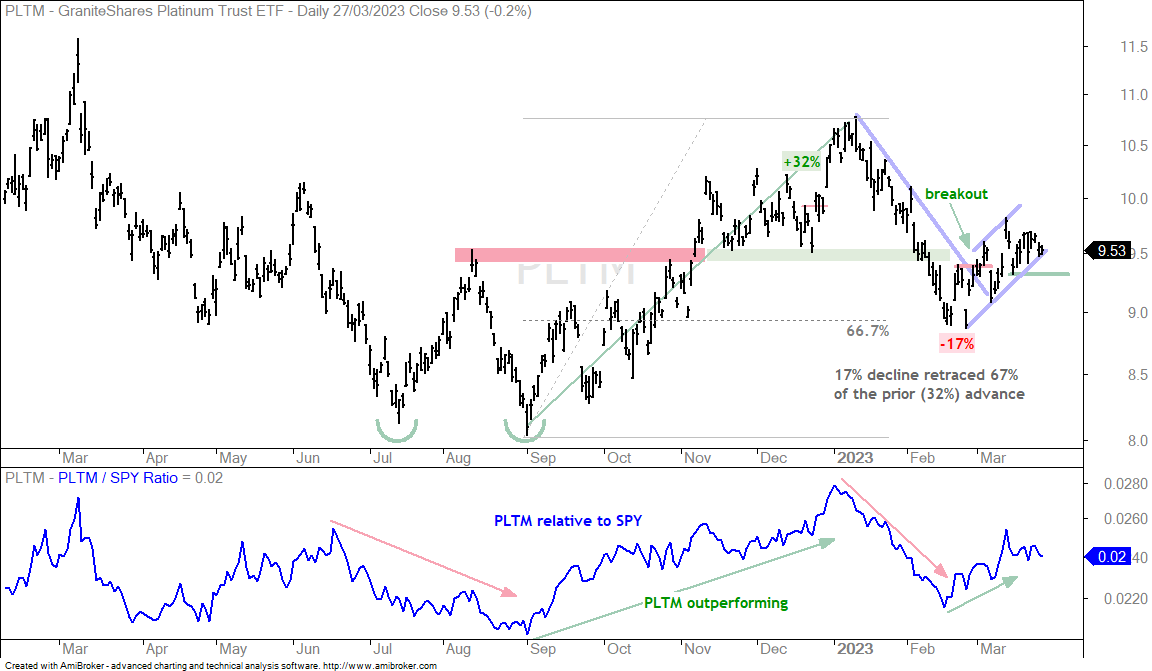
The next chart shows the Platinum ETF (PLTM) with an upswing since late February and support marked at 9.3. A break here would reverse the upswing and be short-term bearish.
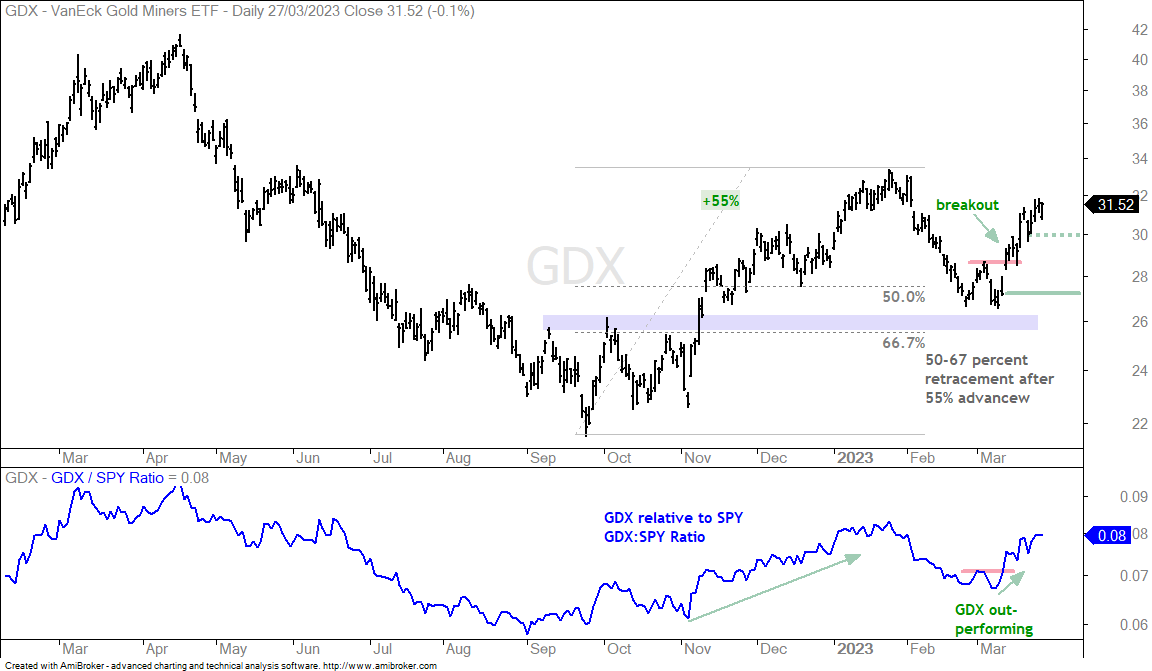
The Gold Miners ETF (GDX) is going to follow gold. GDX found support in the 50-67 percent retracement zone and broke out in early March. GDX extended on this breakout and I am marking short-term support at 30. The next re-evaluation level is set at 27.20.
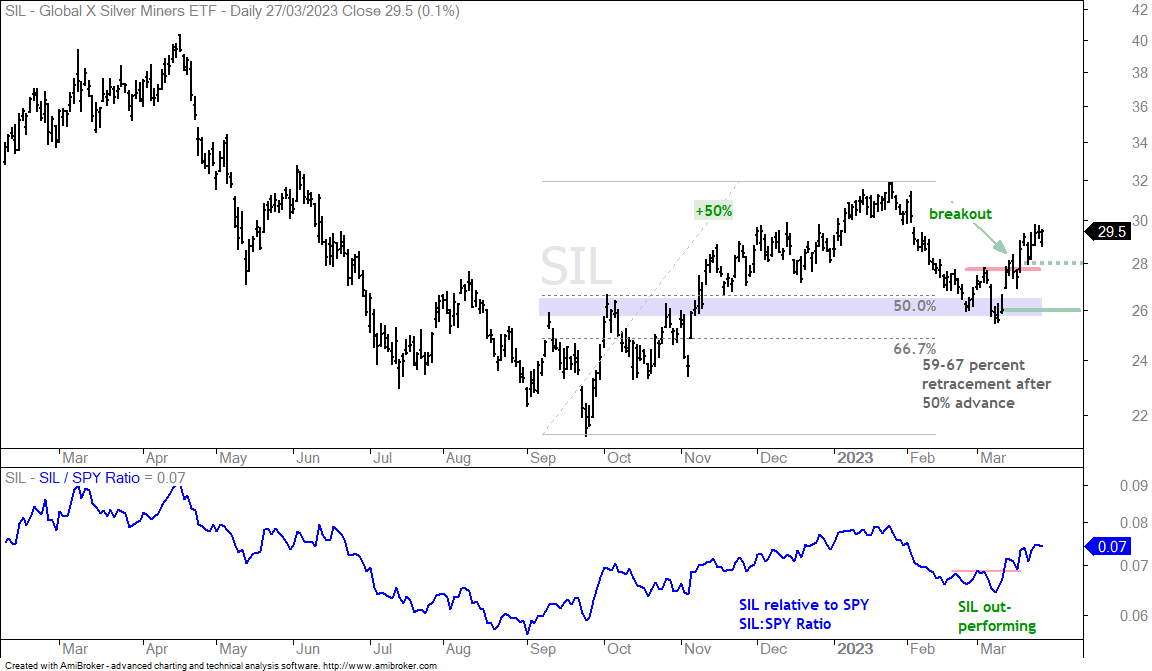
The next chart shows the Silver Miners ETF (SIL) with re-evaluation levels at 28 and 26. The key is to plan your trade while the market is closed and then trade according to that plan.
Copper and Base Metals Go for Breakouts (CPER, DBB)
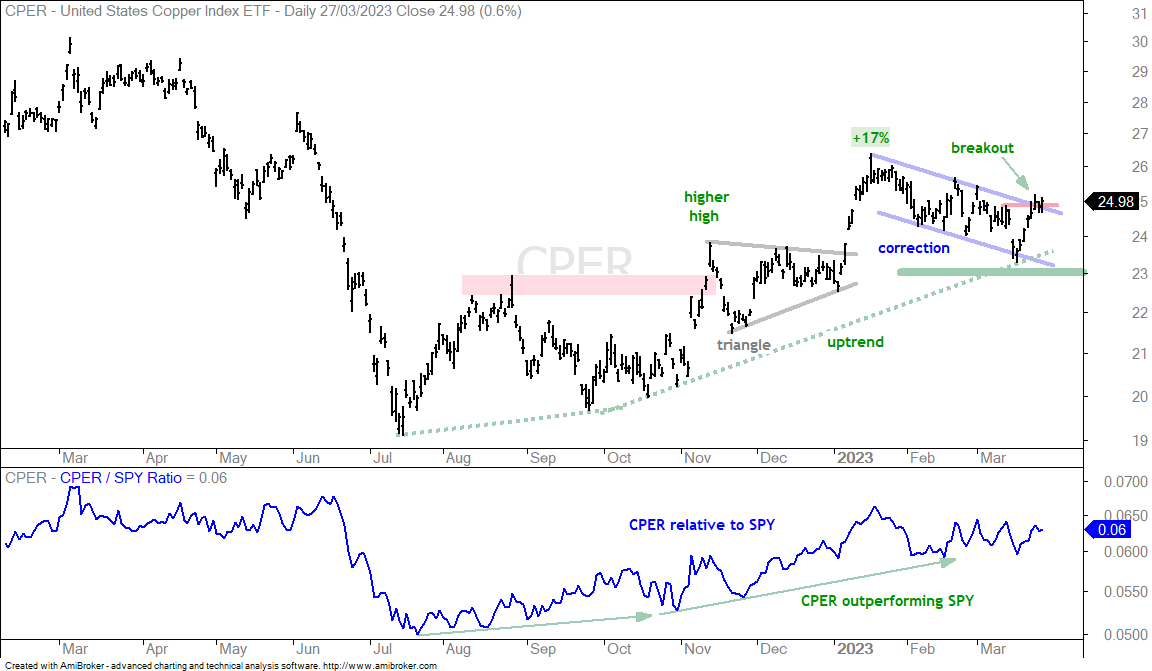
The Copper ETF (CPER) surged the last seven days and broke above the early March high. Overall, CPER has a 17% surge and a falling channel correction. The breakout signals an end to this correction and a resumption of the bigger uptrend. I will set uptrend support at 23. It is interesting to speculate on why copper surged, but keep in mind that there are several price drivers at work (global supply, global demand, Dollar strength/weakness, economic strength/weakness, performance of other commodities). Unless we are prepared for a deep dive into the fundamentals, I would just watch the price chart and read about the fundamental reasons a few weeks or months later.
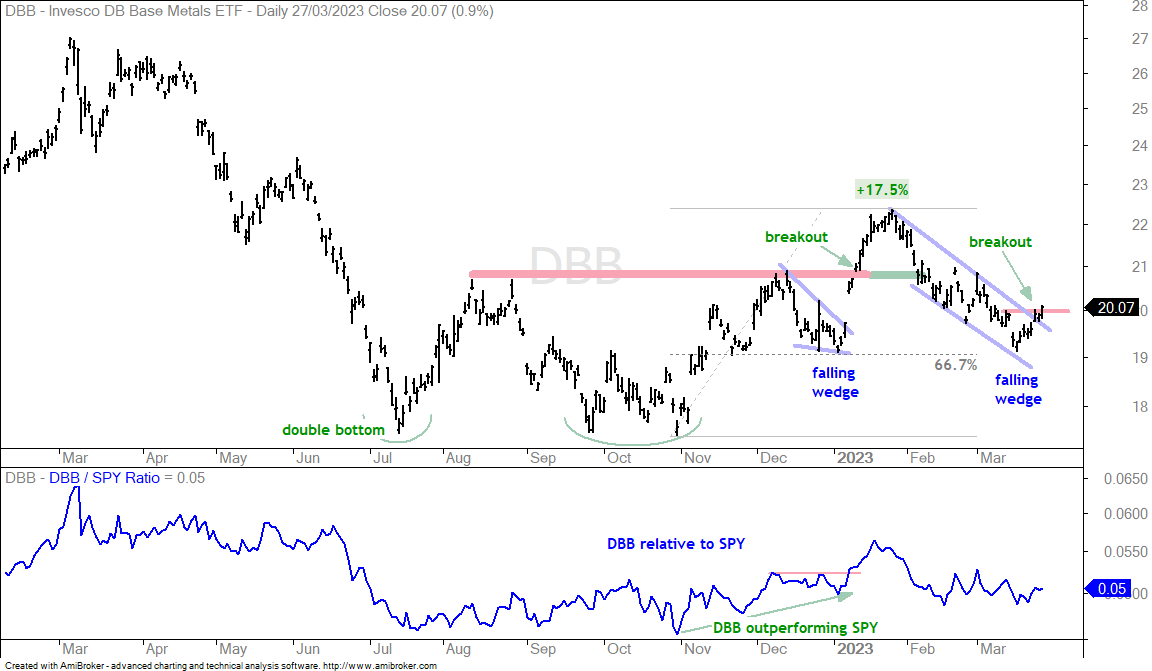
The next chart shows the DB Base Metals ETF (DBB) with a falling wedge breakout working.
Defense and Water ETFs Test Support (PPA, PHO)
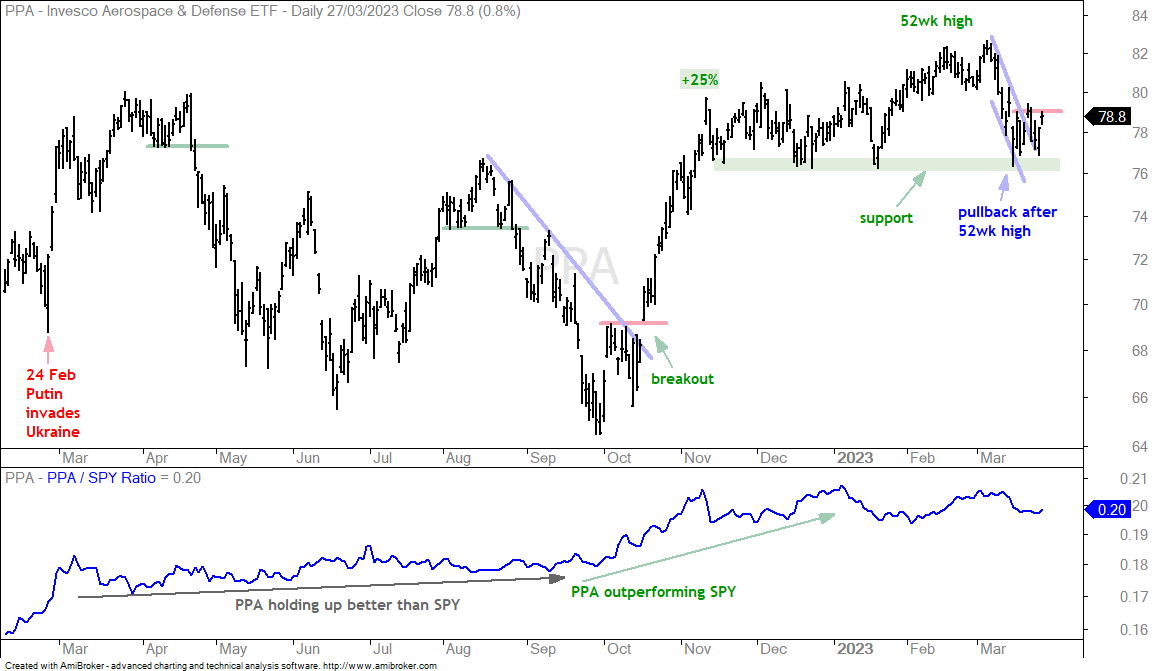
The next chart shows the Aerospace & Defense ETF (PPA) hitting new highs in February-March and then pulling back rather hard with a support test since mid March. PPA is testing support from the December-January lows and a break here would be bearish. As long as support holds, this is considered a pullback within an uptrend and this puts PPA at a moment of truth. Another breakout at 79 would reverse the short-term slide and affirm support in the 76-77 area.
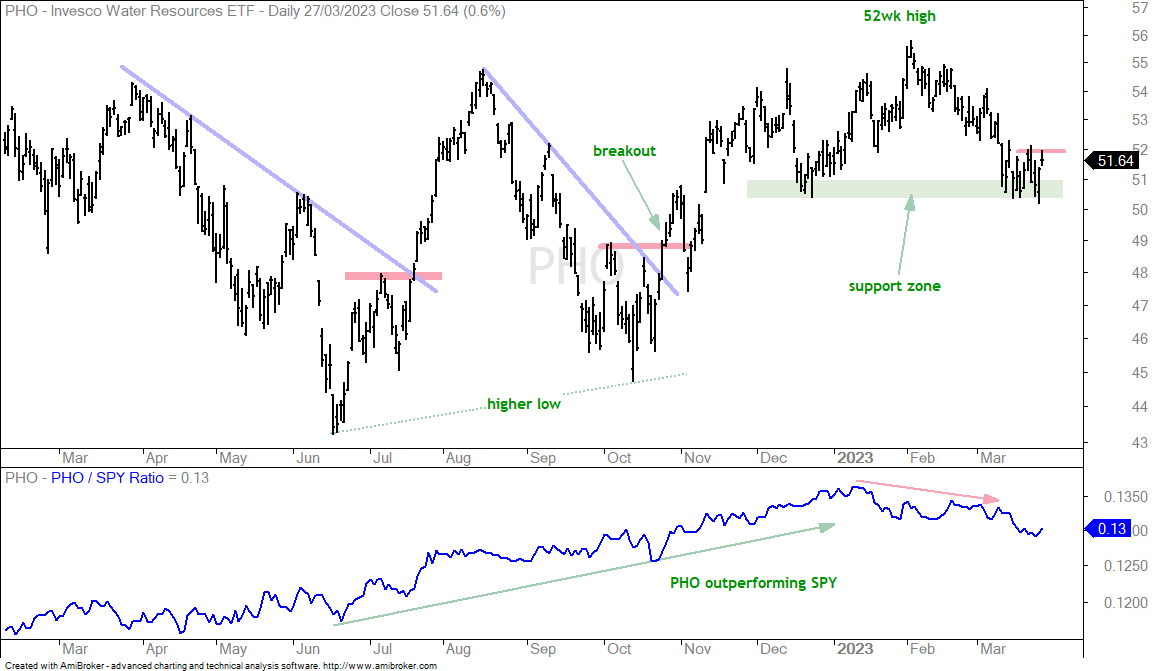
The next chart shows the Water Resources ETF (PHO) with a support test underway as well. PHO was leading in early February with a 52-week high and then fell around 10% into early March. PHO is testing the December lows and attempting to firm. A breakout at 52 would reverse the short-term downtrend.
Watching the Risk-Off Sectors (XLV, XLP, XLU)
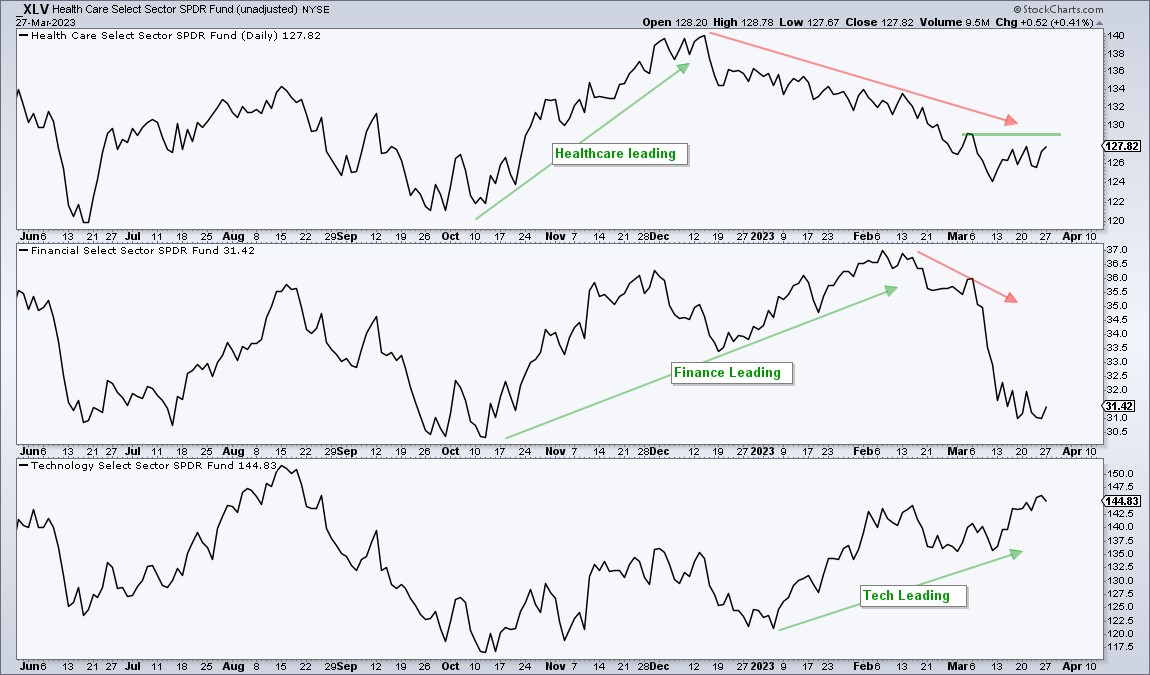
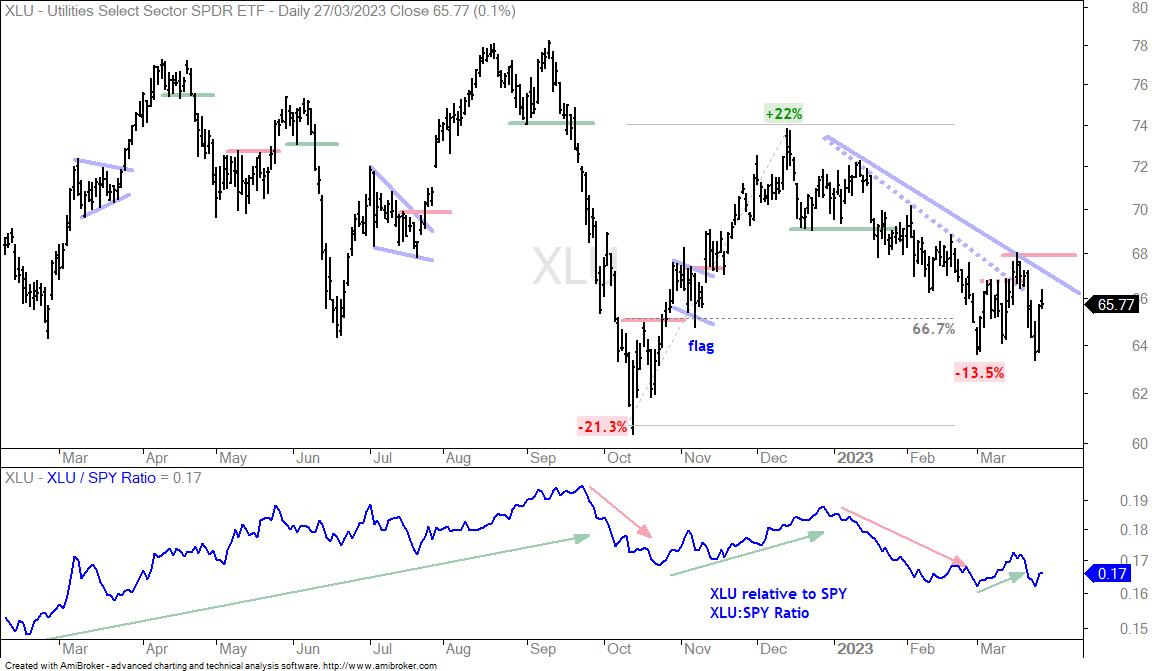
The risk-off and defensive areas of the stock market are currently out of favor and will remain out of favor….until they are back in favor. As with tech leadership, we cannot predict when this will happen, but we can identify a shift on the charts. The Utilities SPDR (XLU) broke out in mid March (dashed line), but failed to hold this breakout and closed below my re-evaluation level at 65 last week. There is still a downswing at work and I am re-setting resistance at 68.
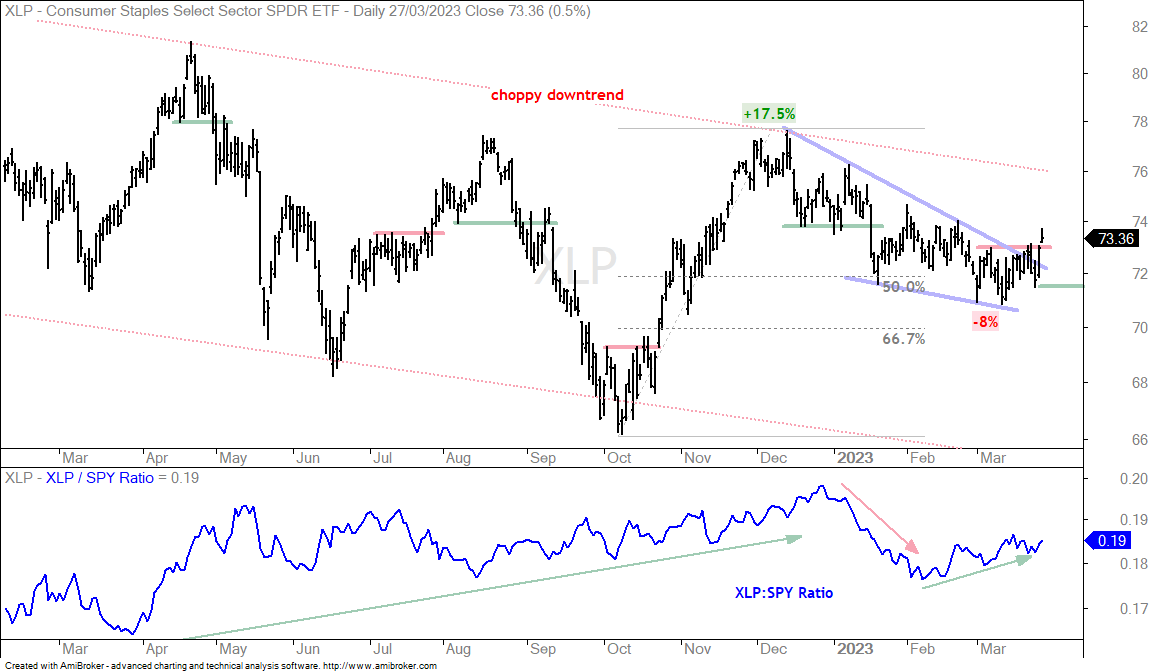
The Consumer Staples SPDR (XLP) reversed its downswing with a surge and breakout over the last two days. Overall, XLP surged 17.5% and then retraced 50-67 percent with a falling wedge decline into March. The retracement amount and pattern are typical for corrections after big moves. The breakout is bullish until proven otherwise and I am setting my re-evaluation at 71.50. The indicator window shows the XLP:SPY ratio rising since early February as XLP outperforms SPY.
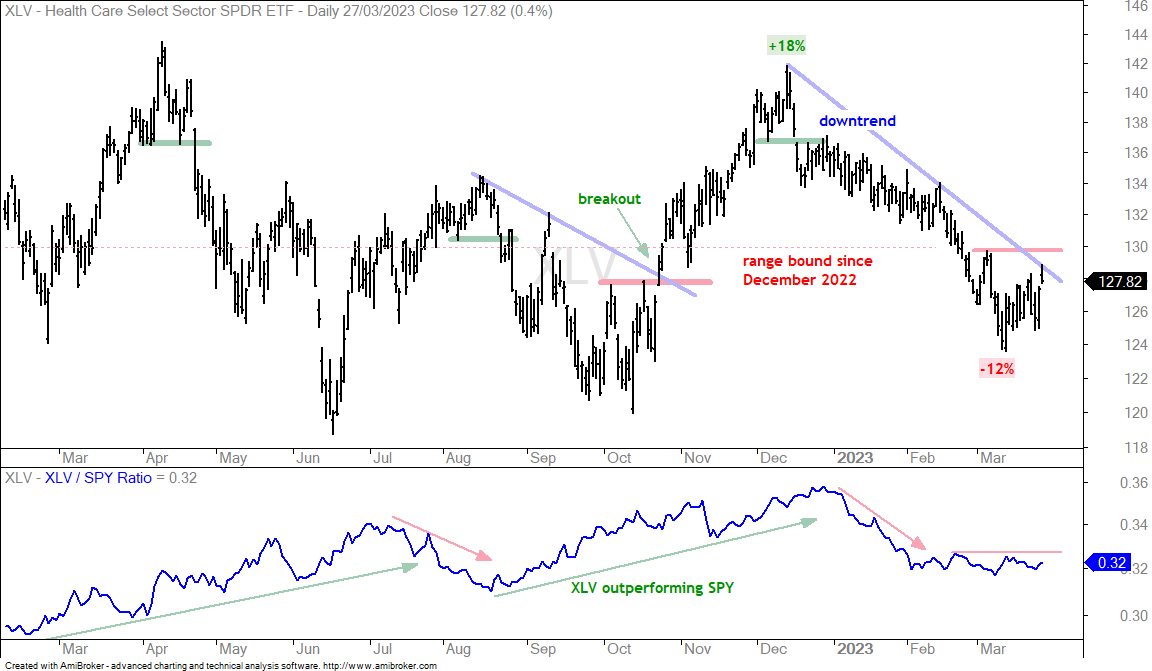
The next chart shows XLV with a 12% downswing since December. XLV has fluctuated between 144 and 118 over the past year and is currently in the lower half of this range. The swing is clearly down with resistance marked at 130. The indicator window shows the XLV:SPY ratio flattening out and a break above the February high would show a return to relative strength.
Biotech ETF Remains Short of Breakout (IBB)
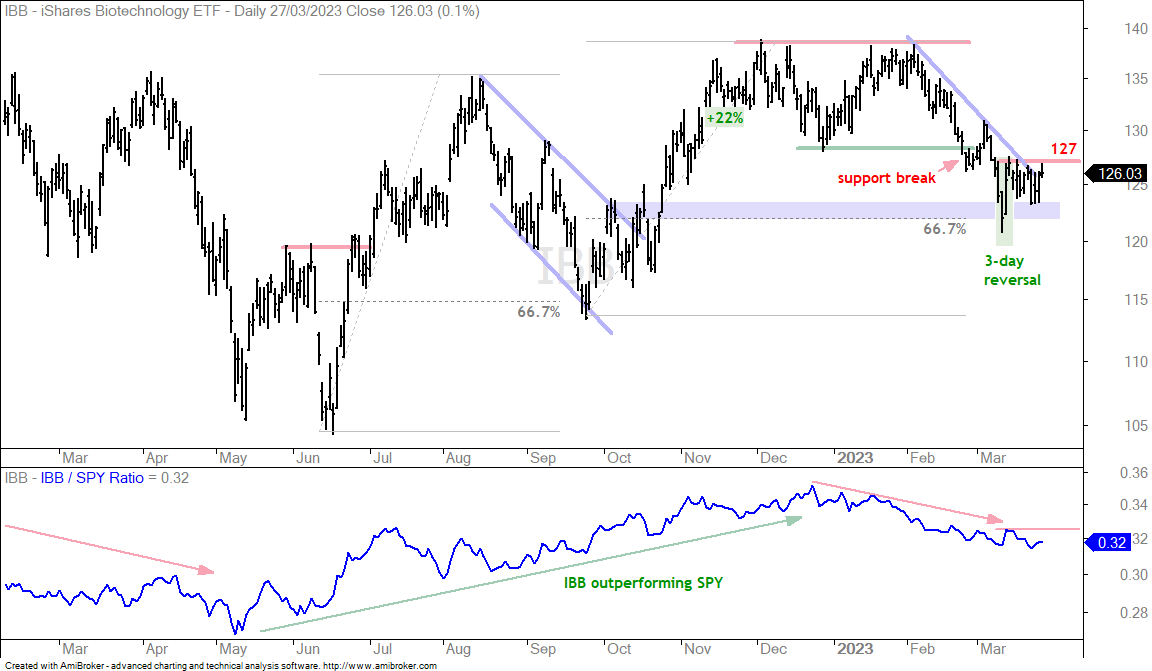
I am still watching the Biotech ETF (IBB) because the downtrend since early February could be a correction after the September-November advance. Notice that this decline returned to the October breakout zone and broken resistance turns into support (blue shading). Second, notice that this decline retraced 67% of the prior advance. IBB forged a 3-day reversal on March 9th, 10th and 13th (green shading). The ETF then stalled for four days. A follow through breakout at 127 would be bullish here and reverse the seven week downswing.
Home Construction, Retail and Discretionary (ITB, XRT, RCD)
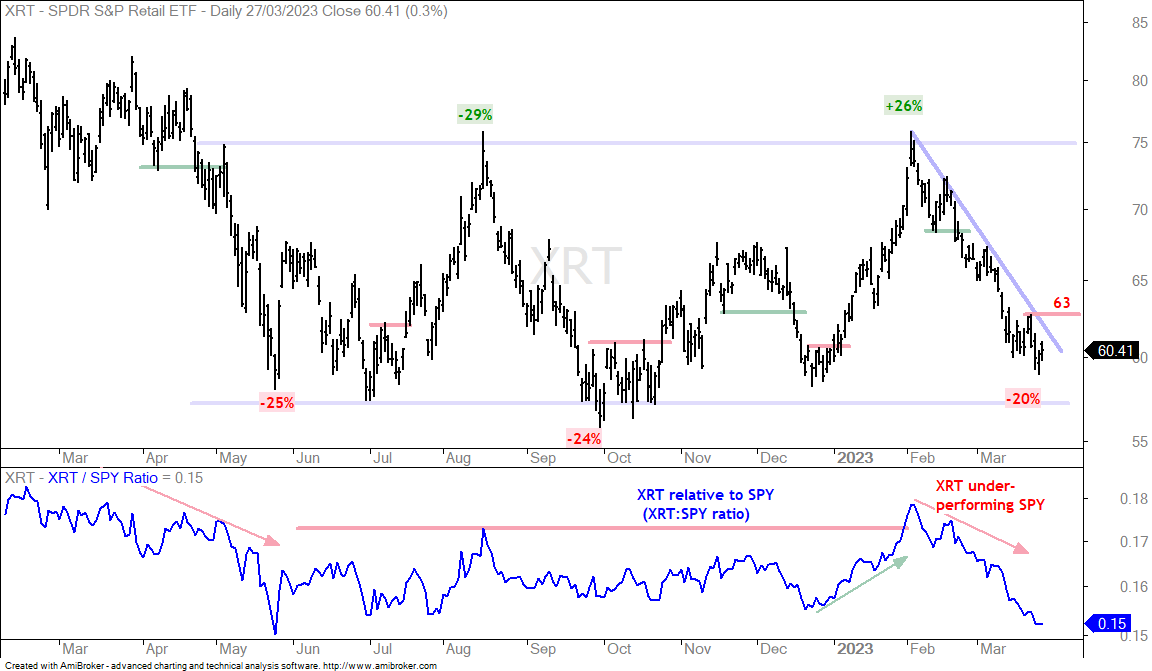
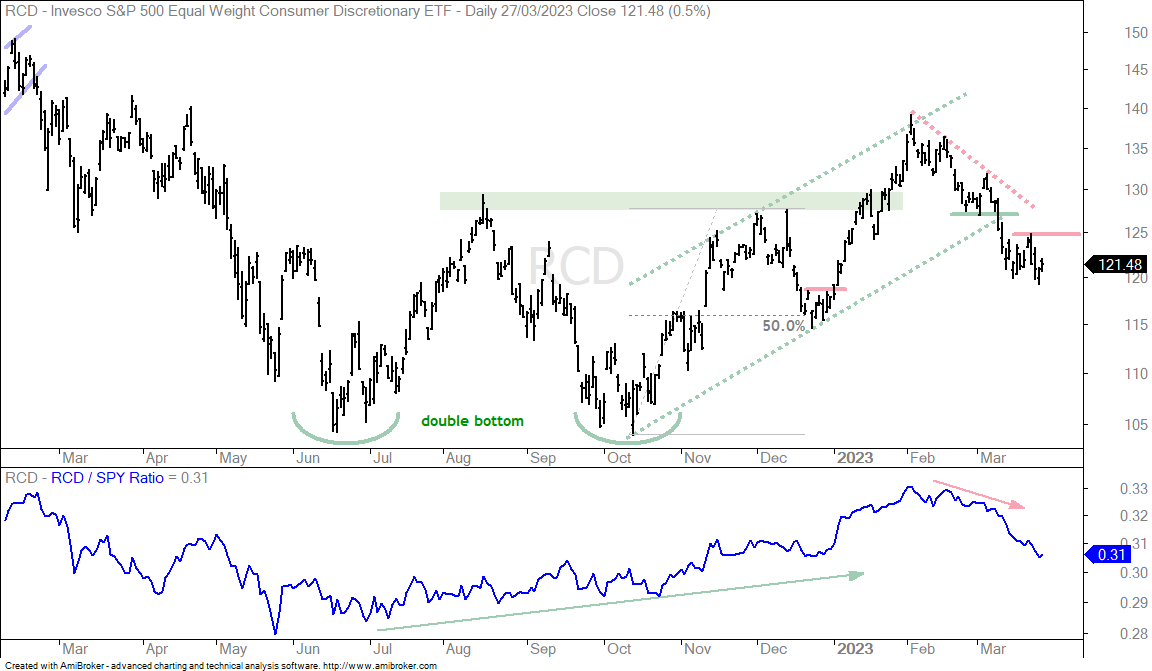
ETFs relative to housing, retail and the consumer discretionary sector are leading the market lower in March. These three ETFs are key to the economy and the overall stock market. Continued downswings and relative weakness bode ill. We need to see upside breakouts in two of the three to turn this negative into a positive.
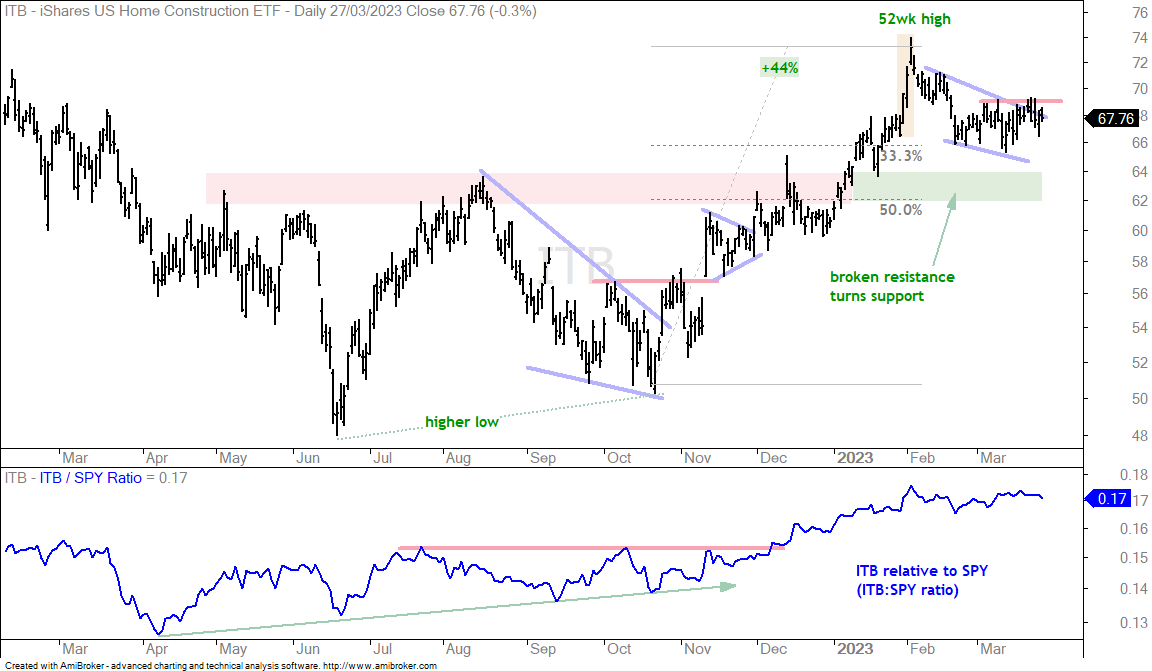
The chart below shows the Home Construction ETF (ITB) in correction (pullback) mode. I am calling this a correction because the bigger trend is still up. A falling wedge is taking shape with the March highs marking resistance. Note that ITB has yet to break the early March high. A breakout at 69 would signal an end to the correction and a resumption of the bigger uptrend. Keep in mind that housing is also a cyclical group and dependent on the economy, as well as credit conditions.
The Retail SPDR (XRT) fell off a cliff from mid February to late March with a 20% decline. XRT is back at the low end of its volatile range (55-75). There have been five swings of 20% or more since April. The only way to trade this range is to catch the swings and reversals as early as possible. The swing here is down with resistance set at 63.
The next chart shows the EW Consumer Discretionary ETF (RCD) with a channel break in early March. RCD led the market lower from mid February to late March as the price-relative (RCD:SPY ratio) fell sharply. The current swing is down with short-term resistance marked at 125. A breakout is needed to reverse the downswing and turn bullish again.