The weight of the short-term evidence remains bullish for stocks. Even though SPX %Above 20-day SMA plunged below 60% to trigger bearish, SPY has yet to break support and the key intermarket relationships are bullish for stocks. Bonds are surging, yields are falling, the Dollar fell to its rising 200-day and GLD surged to its falling 200-day. In addition, the four key groups I am watching have yet to break support from their mid November lows. The intermarket charts, key groups, metals and energy ETFs are featured in today’s report.
A lot could ride on next release for Sticky CPI, which will be on Tuesday, December 13th, before the open. A better-than-expected number on November 10th caused SPY to surge 5.5% and TLT to jump 3.85%. This report ignited the big surge in Treasury bonds and the decline in the 10yr yield. Next week is the encore.
About the ETF Trends, Patterns and Setups Report
This report contains discretionary chart analysis based on my interpretation of the price charts. This is different from the fully systematic approach in the Trend Composite strategy series. In this ETF Trends, Patterns and Setups report, I am looking for leading uptrends and tradable setups within these uptrends. While I use indicators to help define the trend and identify oversold conditions within uptrends, the assessments are mostly based on price action and the price chart (higher highs, higher lows, patterns in play). Sometimes the chart assessment can be at odds with the indicators.
This Week's Publishing Schedule
Tuesday – 6 December: Market-ETF Report and Signal-Rank Table Update
Wednesday – 7 December Market-ETF Video and Market Regime Update
Thursday – 8 December: Market-ETF Report and Signal-Rank Table Update
Saturday – 10 December: ETF Signal and Rank Table
Intermarket Charts Supporting the Q4 Uptrend
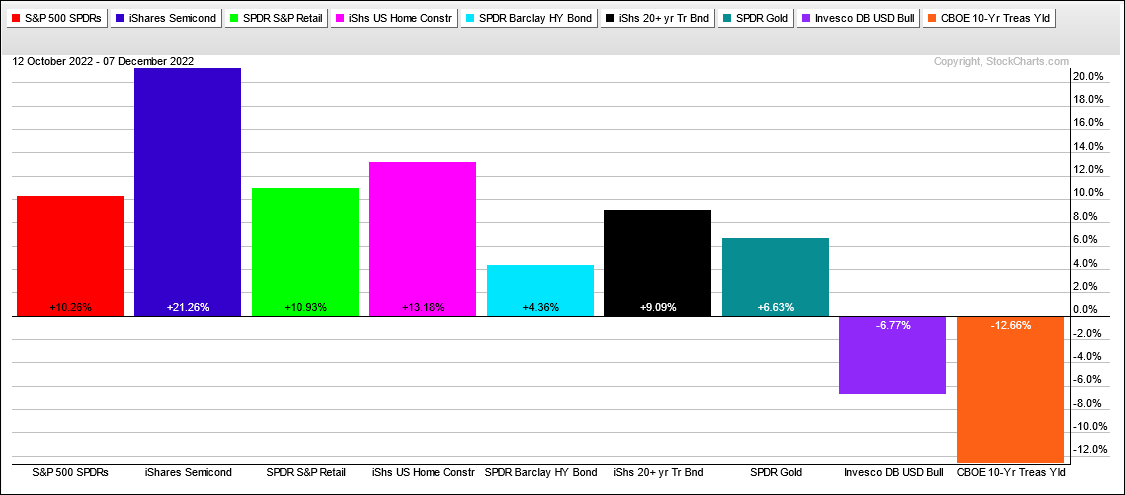
The stock market is in the midst of a strong fourth quarter advance. This advance was strong enough to turn the Composite Breadth Model positive and the S&P 500 is challenging its 200-day SMA. Macro factors are driving this advance and we can capture these dynamics with the inter-market charts.
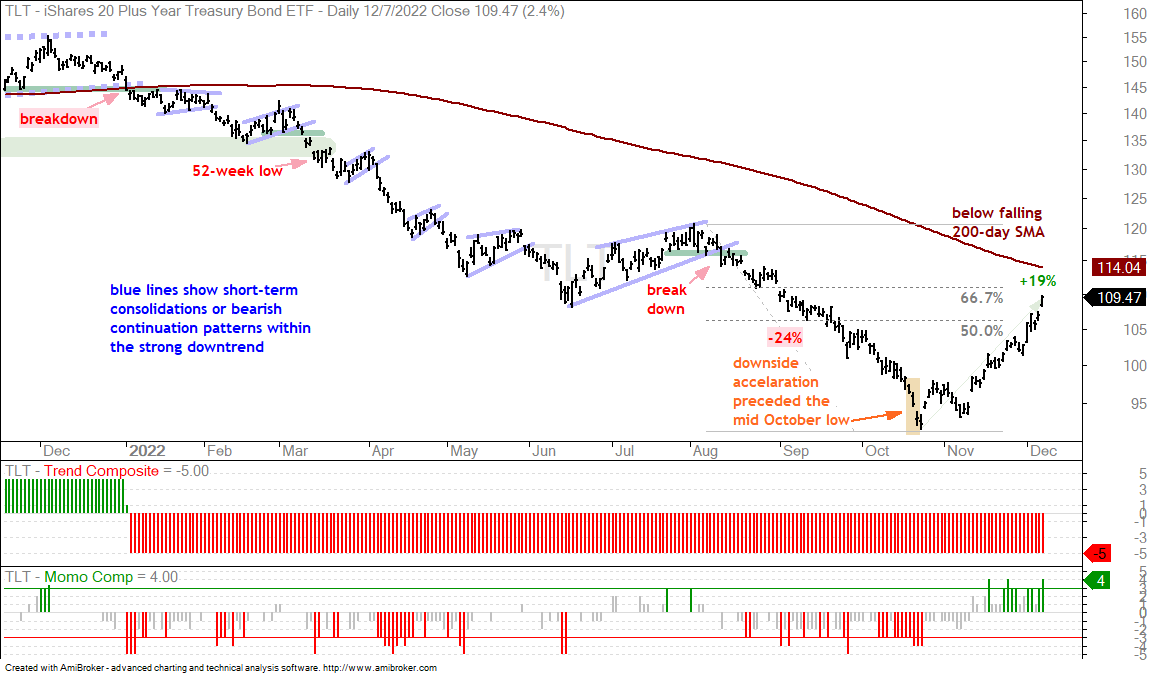
The first chart shows the 20+ Yr Treasury Bond ETF (TLT) falling from mid August to mid October and surging since mid October. SPY is positively correlated with TLT because it declined and advanced along with TLT during these periods. TLT is up 19% and this advance retraced 50-67 percent of the prior decline, which was 24%. TLT is still below its falling 200-day SMA and the long-term trend is still down. TLT is also entering a possible resistance-reversal zone as it nears the 67% retracement and falling 200-day.
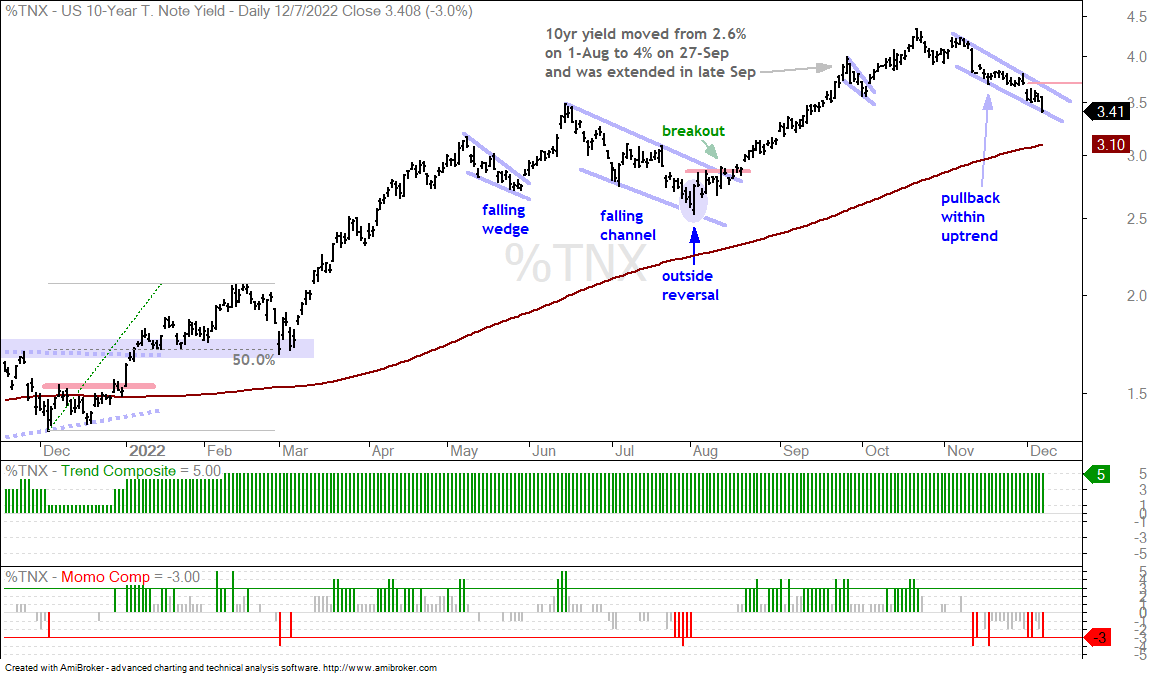
The next chart shows the 10-yr Treasury Yield falling since mid October. SPY advanced during this period and is negatively correlated with Treasury Yields. Thus, falling yields are bullish for stocks. A close above 3.7% would break falling wedge resistance and signal an upturn in yields, which would be negative for stocks.
The Trend Composite aggregates signals in five trend indicators: Bollinger Bands (125,1), Keltner Channels (125,2), 5-day Rate-of-Change of 125-day SMA, StochClose (125,5) and CCI-Close (125). The Trend Composite and ten other indicators are part of the TIP Indicator Edge Plugin for StockCharts ACP
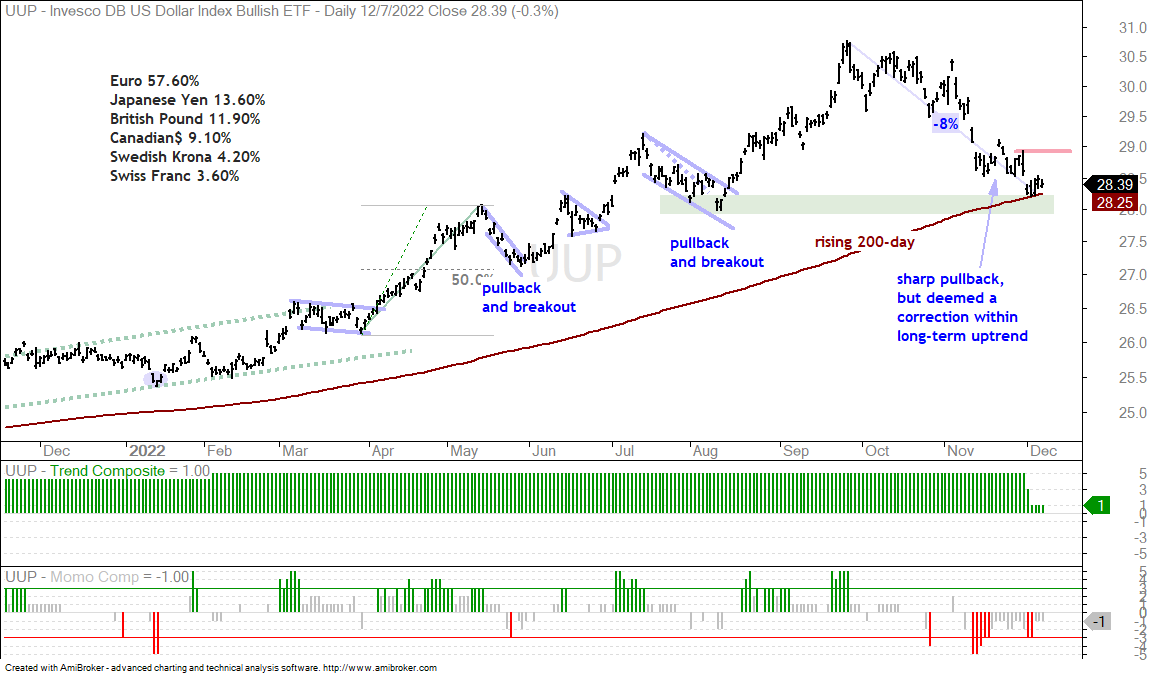
The Dollar Bullish ETF (UUP) is positively correlated with the 10-yr Treasury Yield as both fell since mid October. A breakout in the 10-yr Yield could be bullish for the Dollar. On the price chart, the Dollar is at the rising 200-day and August low, which marks a support-reversal zone. A breakout at 29 would be bullish.
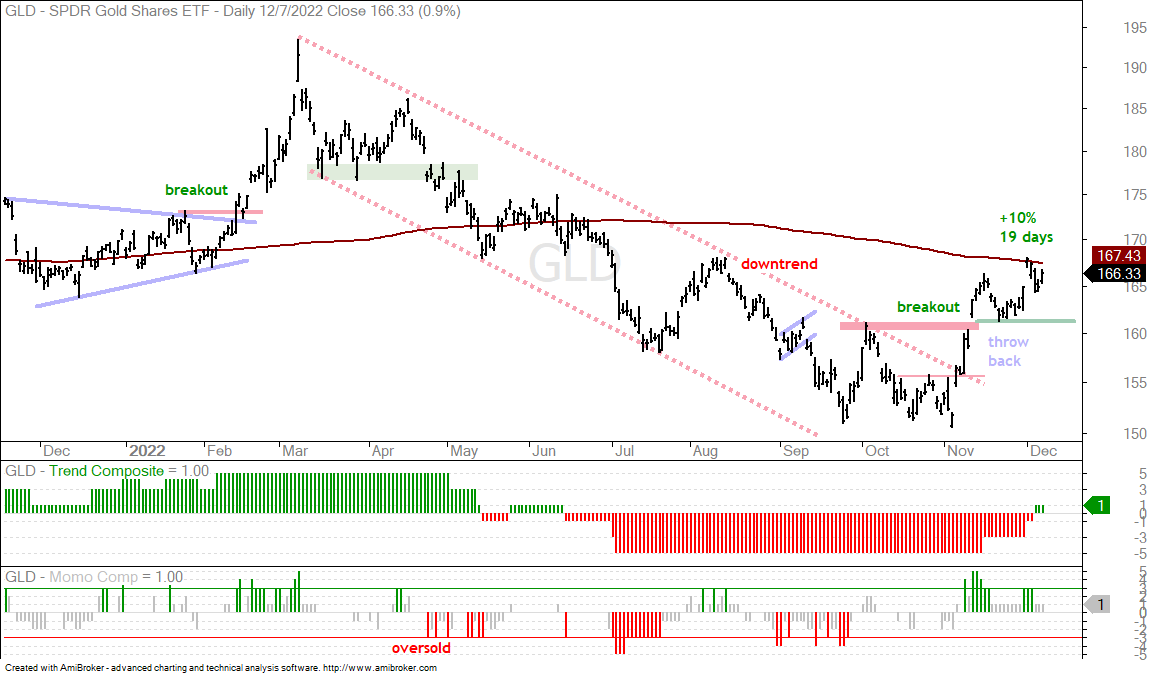
The fall in yields and Dollar weakness boosted the Gold SPDR (GLD) as it broke above its October highs and challenged its falling 200-day SMA. GLD successfully tested the breakout zone with a throwback into mid November and tagged the 200-day SMA with a surge last week. The bulls get the benefit of the doubt as long as the breakout zone at 161 holds. Breakouts in the 10yr Yield and Dollar would also be negative for gold.
You can learn more about my chart strategy in this article covering the different timeframes, chart settings, StochClose, RSI and StochRSI.
%Above 20-day Triggers as SPY Tests Support
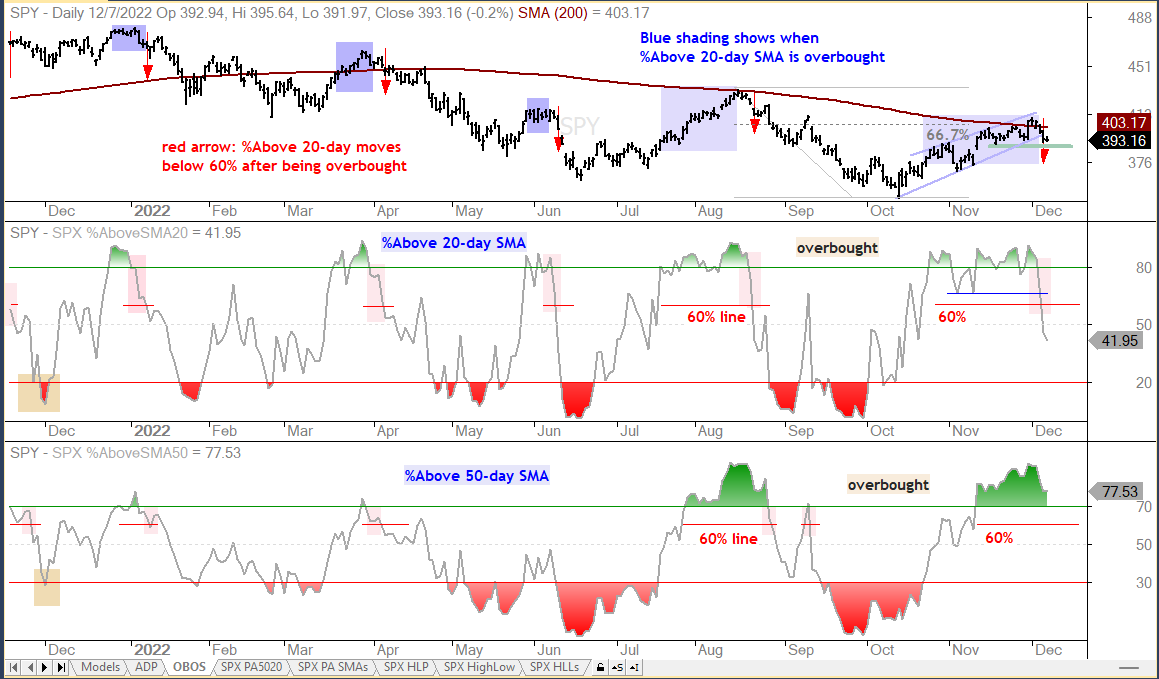
Broad selling pressure hit stocks on Monday and Tuesday as SPX %Above 20-day SMA plunged below 60% and SPY tested support from the mid November lows. The first shoe dropped with this decline. A follow through decline and support break at 390 would signal that the second shoe is dropping. Chartists can also watch SPX %Above 50-day SMA for a move below 60%. The chart below links to a corresponding chart from StockCharts, but the indicator values are not exactly the same because we have different providers.
You can learn more about exit strategies in this post, which includes a video and charting options for everyone.
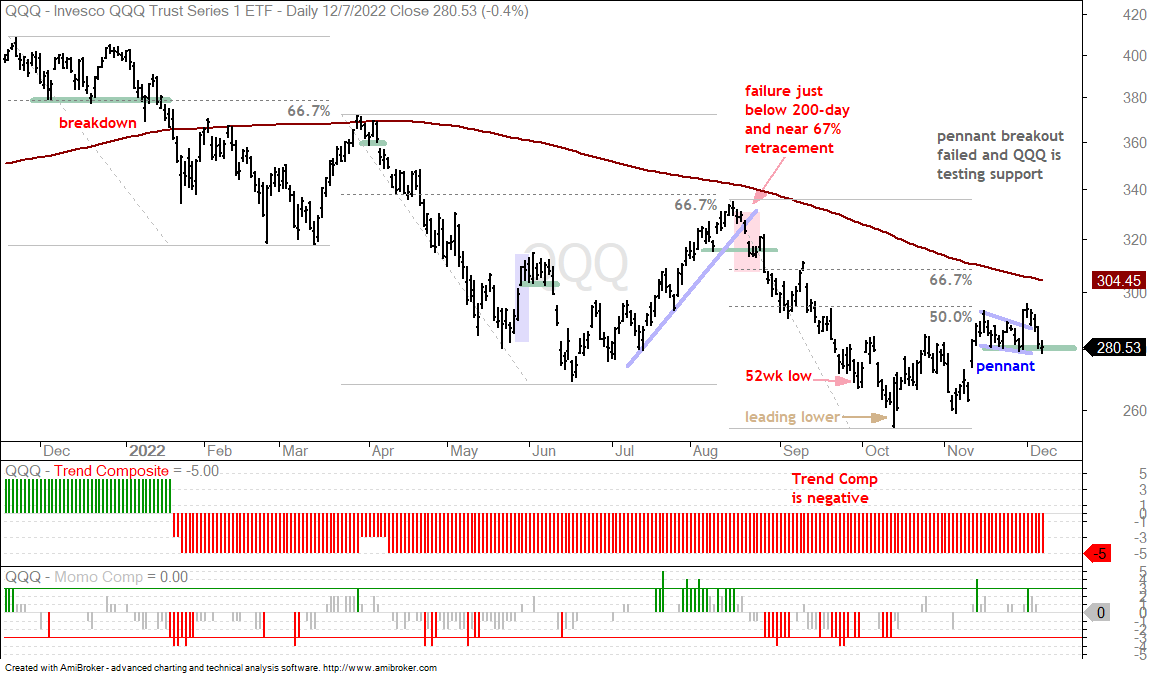
The next chart shows QQQ falling well short of its 200-day during this advance and underperforming SPY. The ETF is testing short-term support at 280.
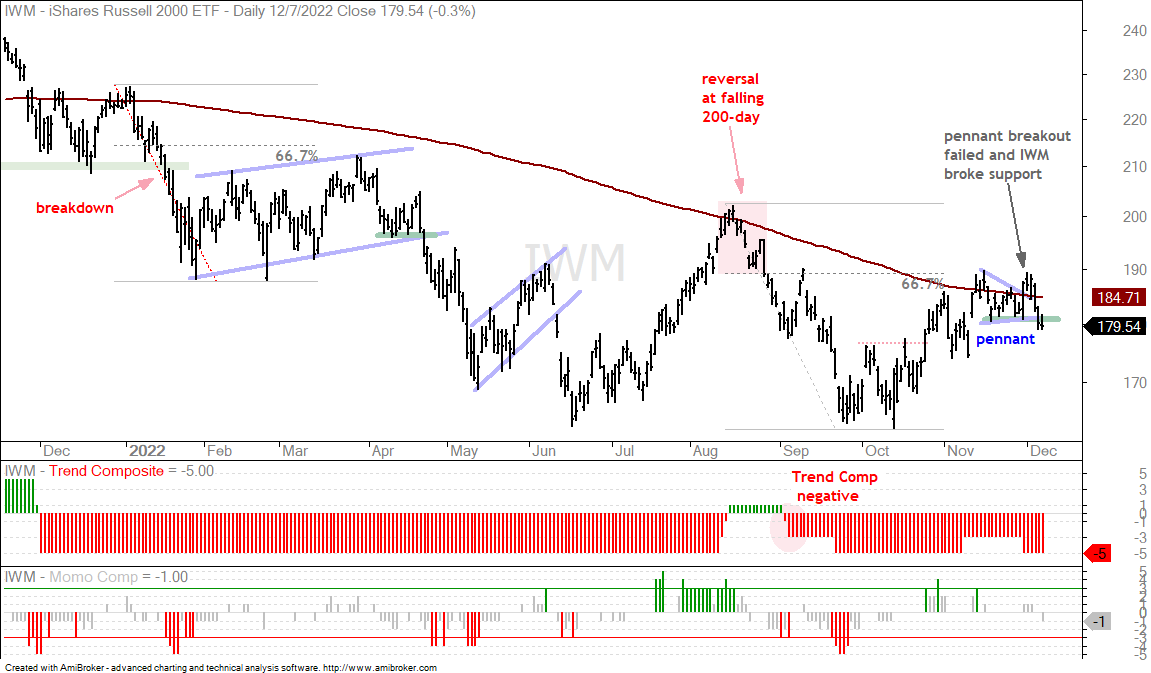
The next chart shows the Russell 2000 ETF (IWM) breaking short-term support as small-caps lead lower.
Four Key Charts to Monitor
I am also monitoring four charts for signs that the fourth quarter uptrend is reversing. These are the Semiconductor ETF (SOXX), the Home Construction ETF (ITB), the Retail SPDR (XRT) and the Junk Bond ETF (JNK). Semis are one of the few strong areas within tech. Housing and retail are important parts of the economy. Junk bonds represent the appetite for risk. These four are still in uptrends and above their mid November lows, and thus supporting the fourth quarter advance. Support breaks in these ETFs would provide further evidence that the fourth quarter advance is reversing.
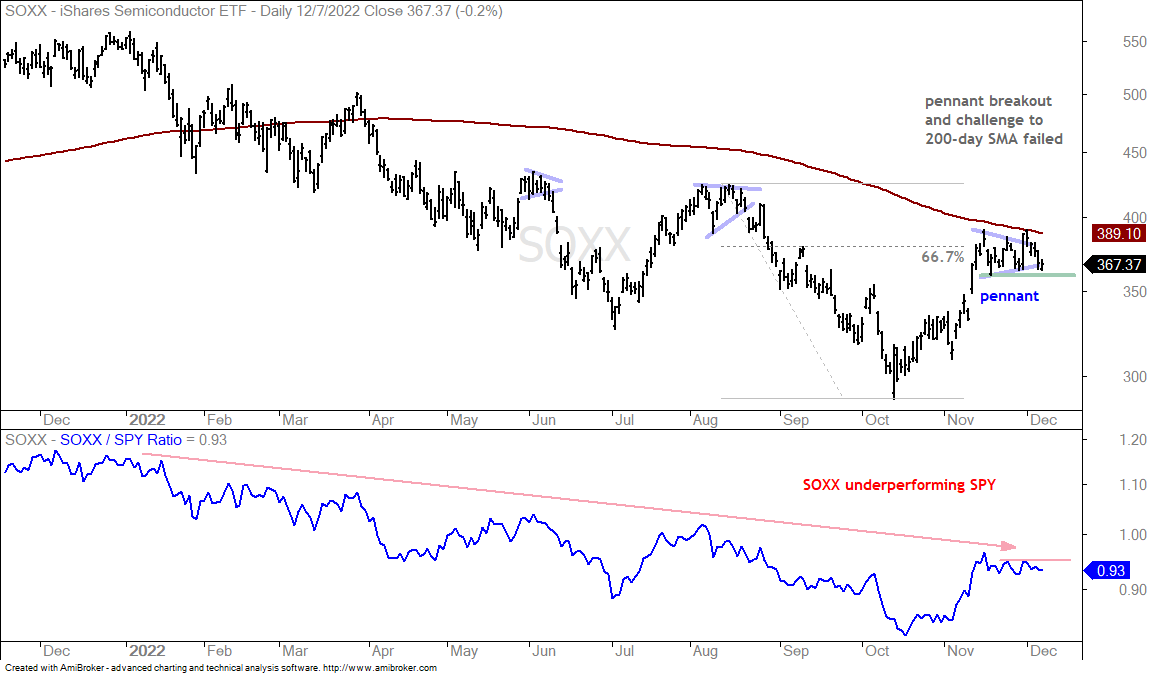
The first chart shows SOXX with a pennant breakout and 200-day SMA challenge that failed. SOXX is currently testing support from the mid November lows and a break at 360 would be short-term bearish. A surge off short-term support and short-term breakout in the price-relative (SOXX:SPY ratio) would be bullish.
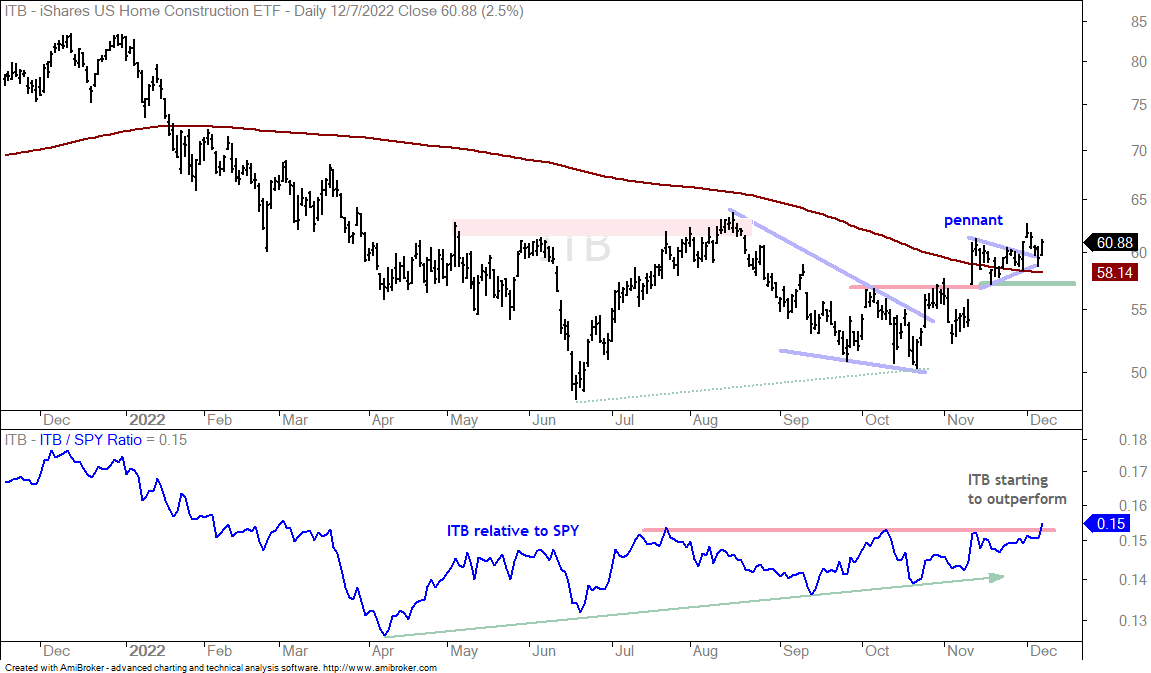
A correction in the 10-yr Treasury Yield and a surging stock market are positive for the Home Construction ETF (ITB). The next chart shows ITB breaking out of a triangle in late October and breaking the October highs with a surge in mid November. The ETF then consolidated with a pennant around the 200-day SMA and broke out of the pennant on Wednesday. The pennant lows mark support at 57.
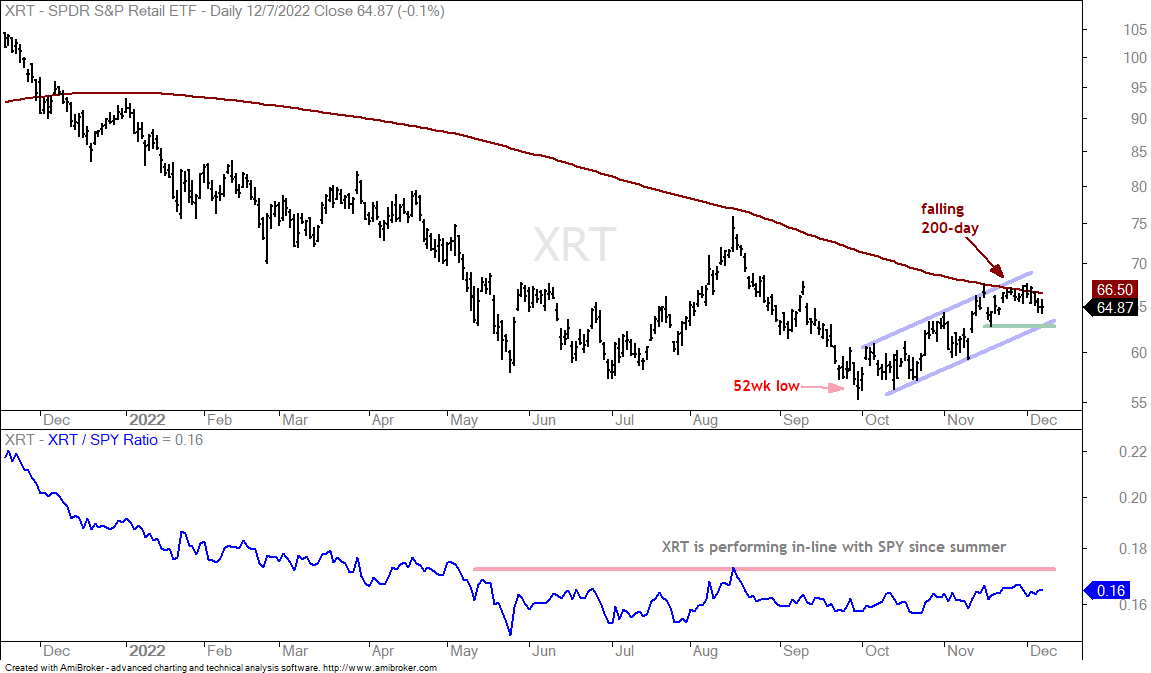
The next chart shows the Retail SPDR (XRT) advancing to its 200-day SMA and stalling the last few weeks. The blue trendlines define this advance and the green line marks support from the mid November low. The bigger trend is down so this bounce is considered a counter-trend move (bear market bounce). A support break would reverse the short-term uptrend and signal a continuation of the long-term downtrend.
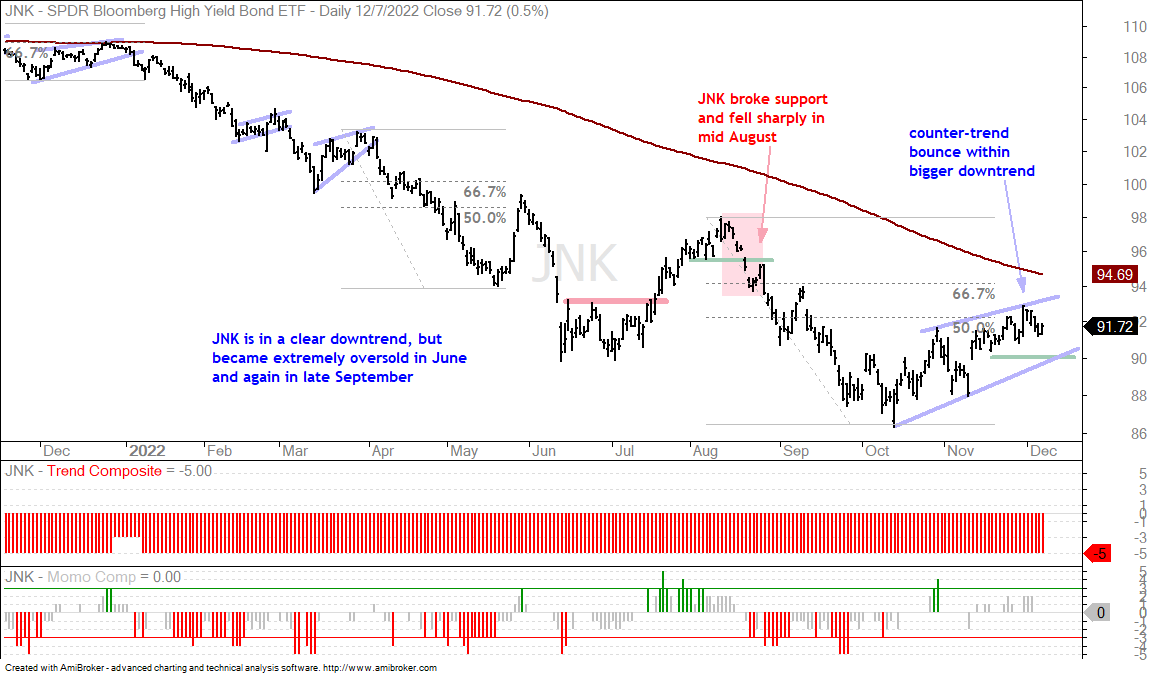
The next chart shows the Junk Bond ETF (JNK) participating in the risk-on advance as it retraced 50-67 percent of the prior decline with a rising wedge. The immediate trend is up as long as the wedge rises, but this uptrend is considered a counter-trend bounce within a bigger downtrend. A close below 90 would reverse this upswing.
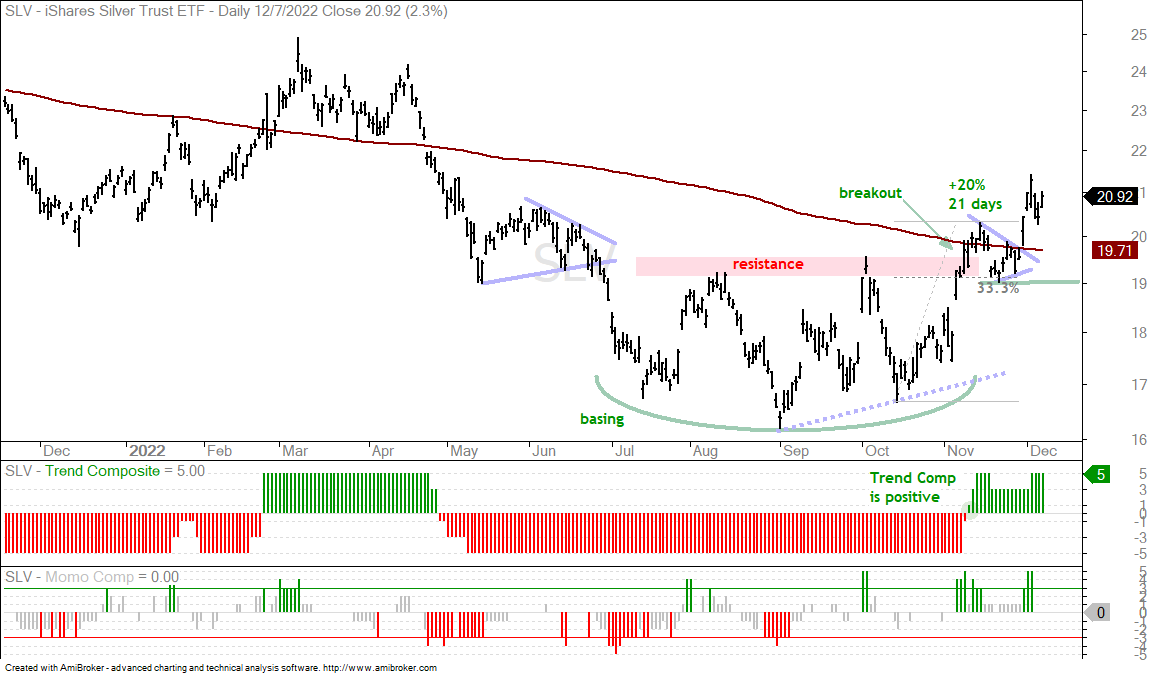
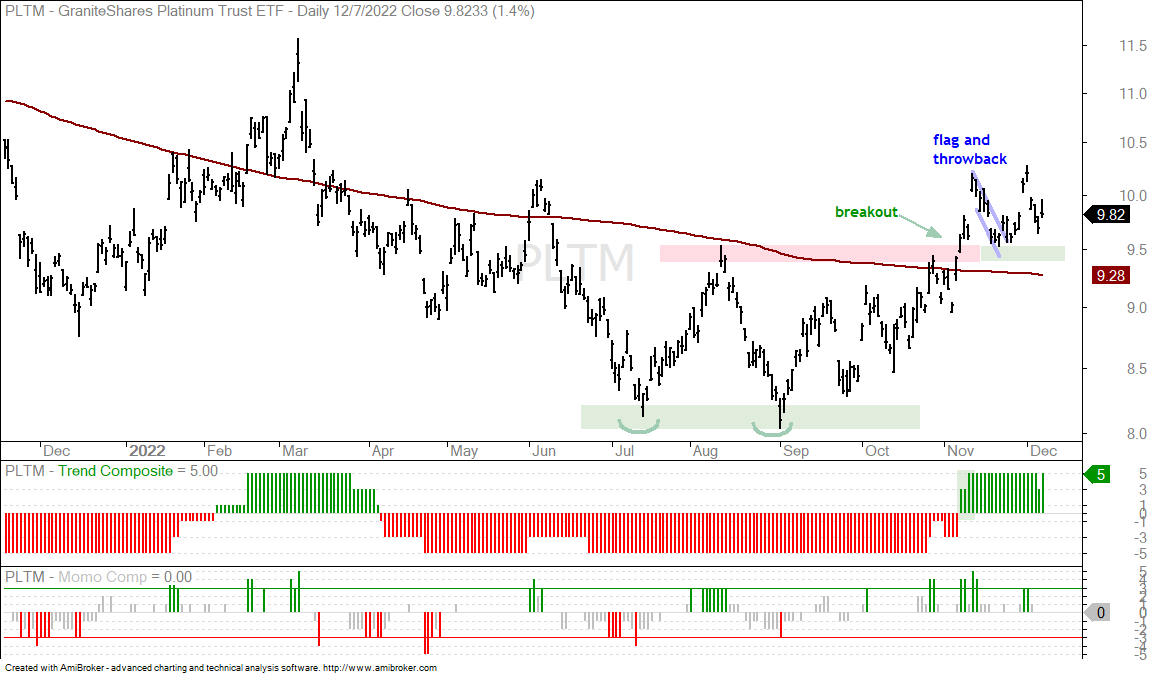
Silver and Platinum Channel Gold (SLV, PLTM)
The Silver ETF (SLV) and Platinum ETF (PLTM) are holding their breakouts and rising along with gold. The first chart shows SLV with a breakout, a pennant near the breakout zone and a pennant breakout last week. This surge reinforces the breakout and support is set at 19. A break below this level would negate the breakout.
The next chart shows PLTM breaking out, testing the breakout zone in mid November and holding above the breakout zone. Price action turned volatile the last few weeks, but the breakout is holding and bullish until proven otherwise. A close below the 200-day SMA would argue for a re-evaluation.
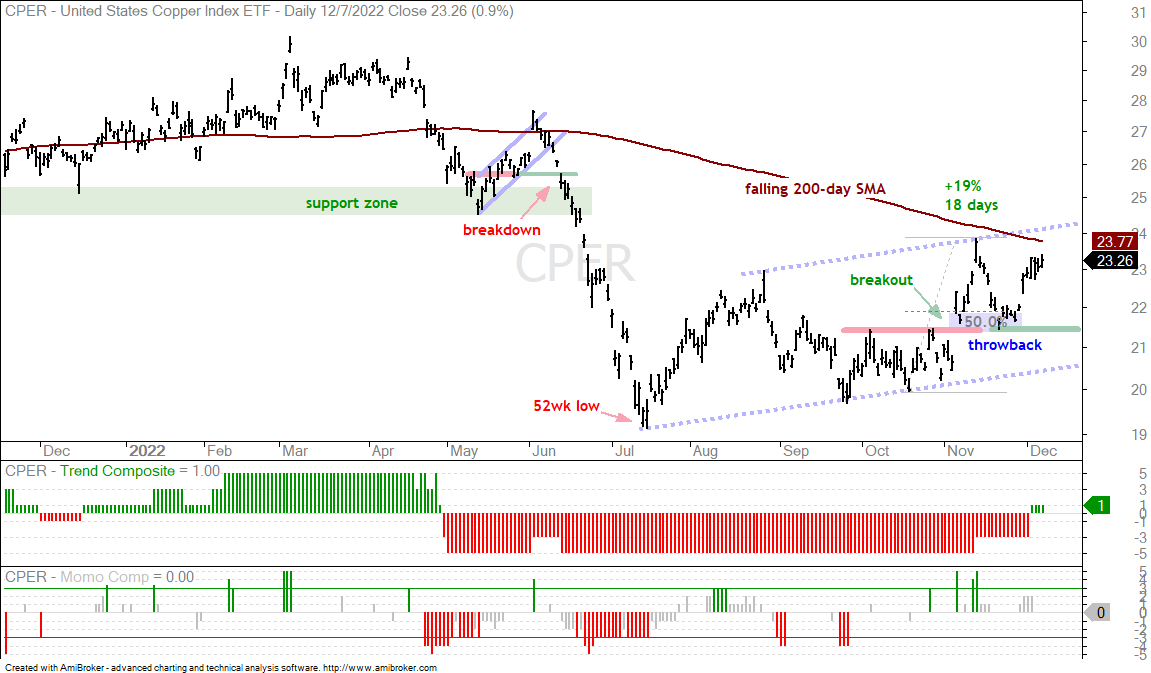
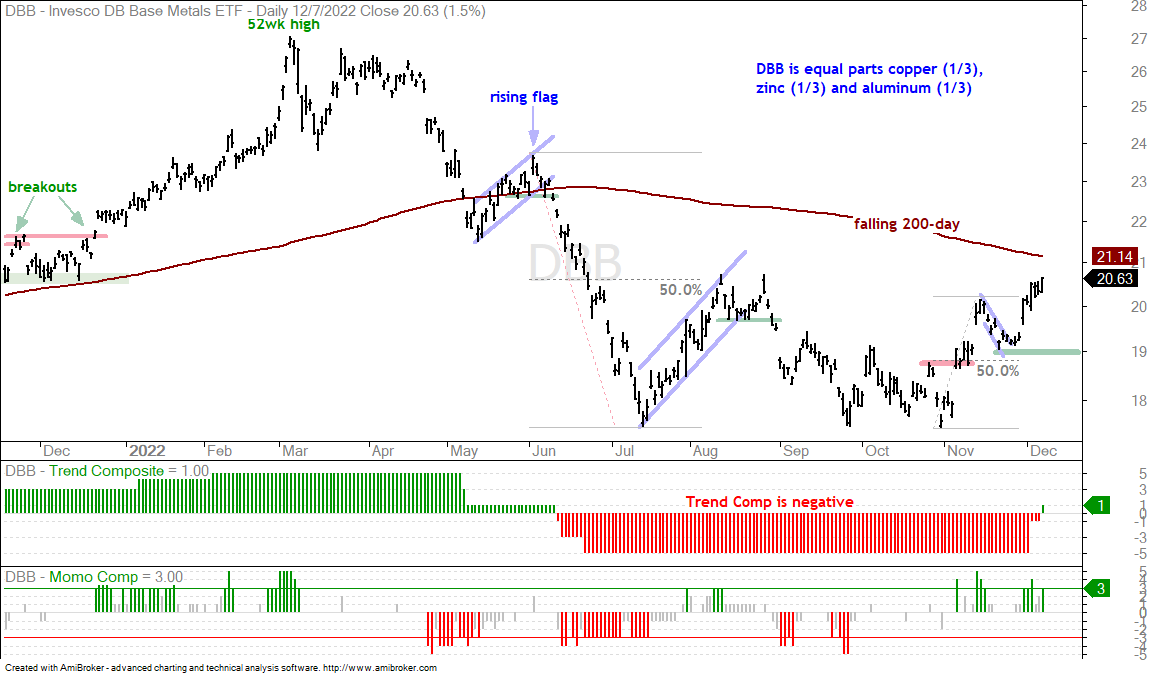
Copper and Base Metals Rise (CPER, DBB)
The Copper ETF (CPER) is in an uptrend since the higher low in September and breakout in early November. CPER fell back after the breakout, held the breakout zone and surged above 23. The blue dashed lines mark a rising channel and support is set at 21.50 for now. The indicator window shows the Trend Composite turning positive four days ago.
The DB Base Metals ETF (DBB) is equal parts (thirds) copper, zinc and aluminum. The chart below shows DBB with an early November breakout, a 50% retracement back to the breakout zone (throwback) and a surge above 20 last week. The move was enough to turn the Trend Composite bullish and I am setting support at 19.
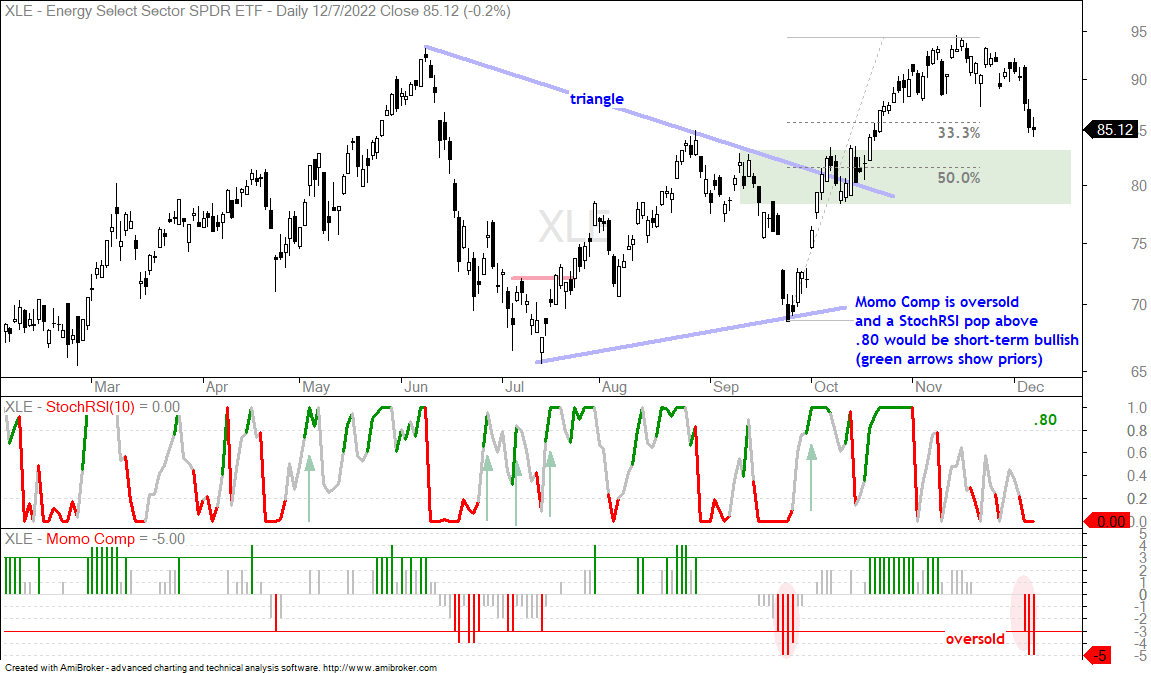
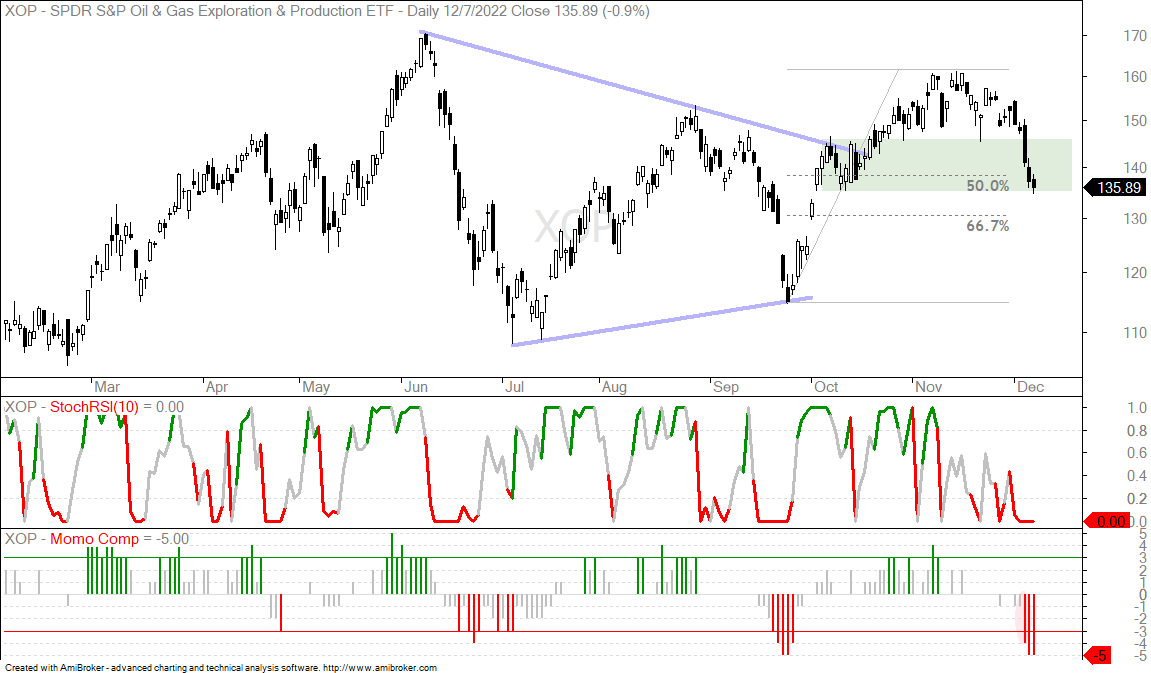
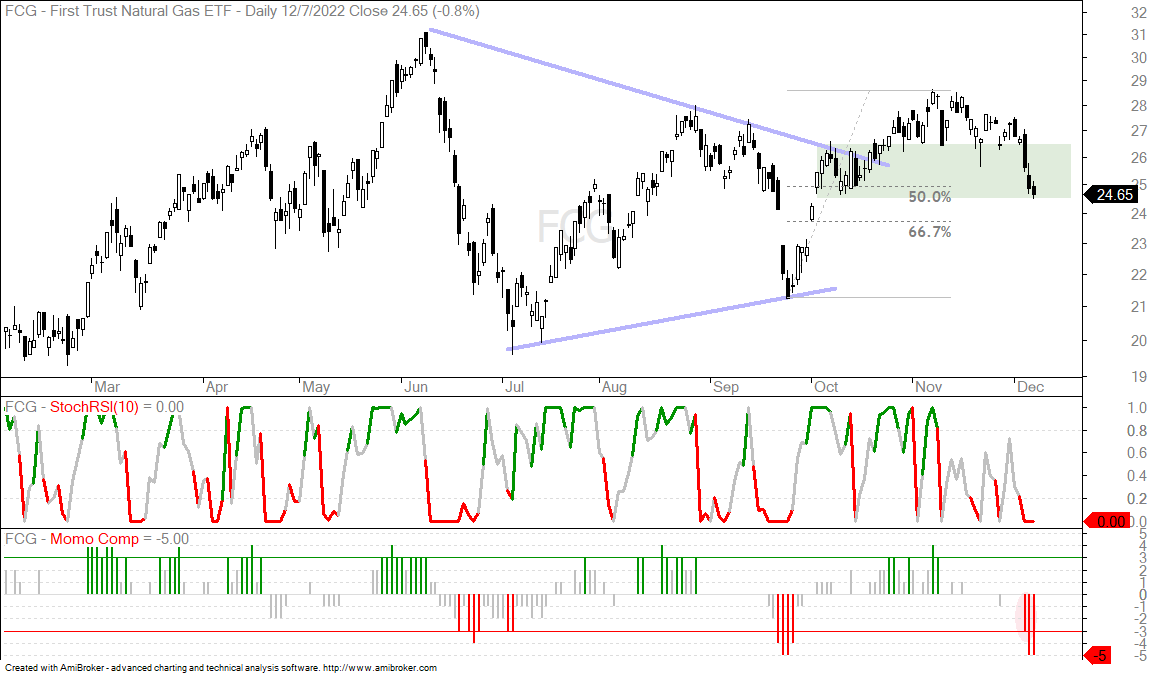
Energy ETFs Firm after Becoming Oversold
The energy ETFs are strongly correlated, which means they move in the same direction. What applies to the Energy SPDR (XLE) usually applies to the other ETFs in this sector (XOP, FCG, AMLP, XES, OIH). XLE represents the sector and is the base case for the group. The chart shows XLE falling sharply on Monday-Tuesday and then forming a spinning top. This candlestick has a small body (open-close range) and long shadows (high-low range). It shows indecision that can sometimes foreshadow a reversal or bounce.
The bottom indicator window shows the Momentum Composite dipping to -3, -5 and -5 the last three days. XLE is thus short-term oversold and in a long-term uptrend. Even though not every setup works, oversold conditions in uptrends are considered opportunities. There are three ways to play: buy when oversold (falling knife), wait for a sign of firmness (spinning top) or wait for StochRSI to pop above .80 (short-term upturn). The choice depends on your trading style. Classic mean-reversion strategies often use profit targets and exit on the first decent bounce. For XLE, this might be in the low 90s.
")