Finance and Industrials Capture the 2022 Mood (XLF, XLI)
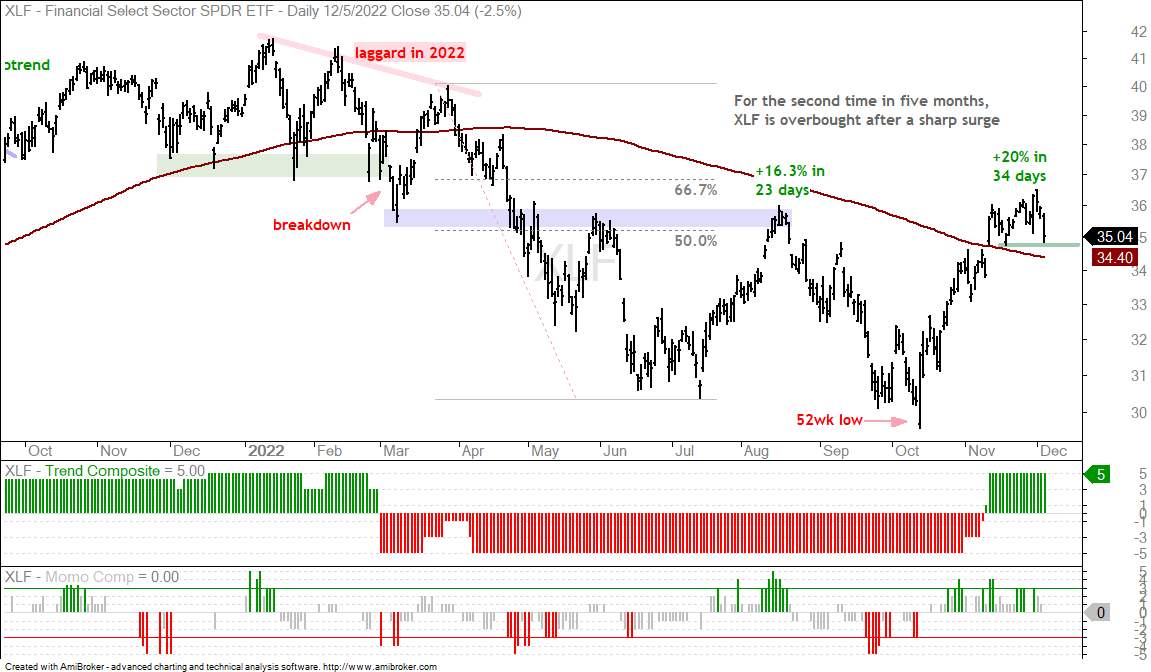
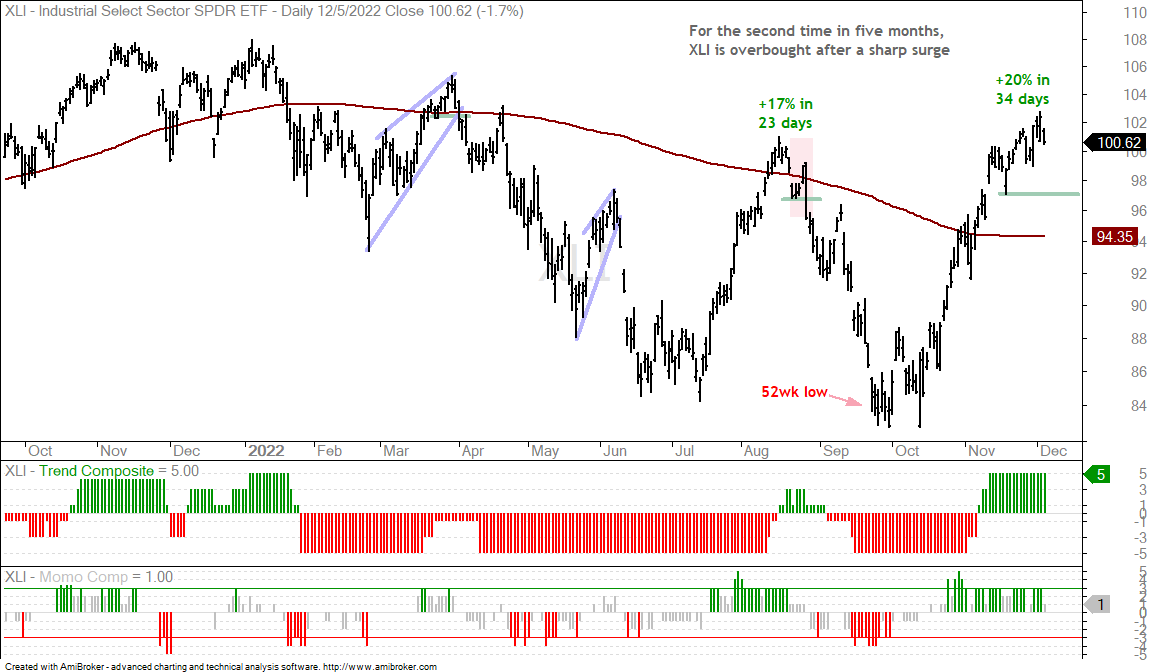
2022 is the year of big swings with the Finance SPDR (XLF) and Industrials SPDR (XLI) capturing this phenomenon. Both ETFs surged some 20% in 34 days and exceeded their August highs. They are leading because they broke their August highs, but these advances started from 52-week lows, which is not from a position of strength.
The charts show both becoming short-term overbought in mid August, reversing and moving sharply lower into late September. XLI and XLF are again extremely overbought after sharp advances in a short period. The green lines mark current support at the mid November low and breaks here would reverse the short-term upswings.
About the ETF Trends, Patterns and Setups Report
This report contains discretionary chart analysis based on my interpretation of the price charts. This is different from the fully systematic approach in the Trend Composite strategy series. In this ETF Trends, Patterns and Setups report, I am looking for leading uptrends and tradable setups within these uptrends. While I use indicators to help define the trend and identify oversold conditions within uptrends, the assessments are mostly based on price action and the price chart (higher highs, higher lows, patterns in play). Sometimes the chart assessment can be at odds with the indicators.
This Week's Publishing Schedule
Tuesday – 6 December: Broad Market Update
Tuesday – 6 December: ETF Report and Signal-Rank Table Update
Wednesday – 7 December Market-ETF Video and Market Regime Update
Thursday – 8 December: Market-ETF Report and Signal-Rank Table Update
Saturday – 10 December: ETF Signal and Rank Table
You can learn more about my chart strategy in this article covering the different timeframes, chart settings, StochClose, RSI and StochRSI.
Regional Bank ETF Breaks Down (KRE)
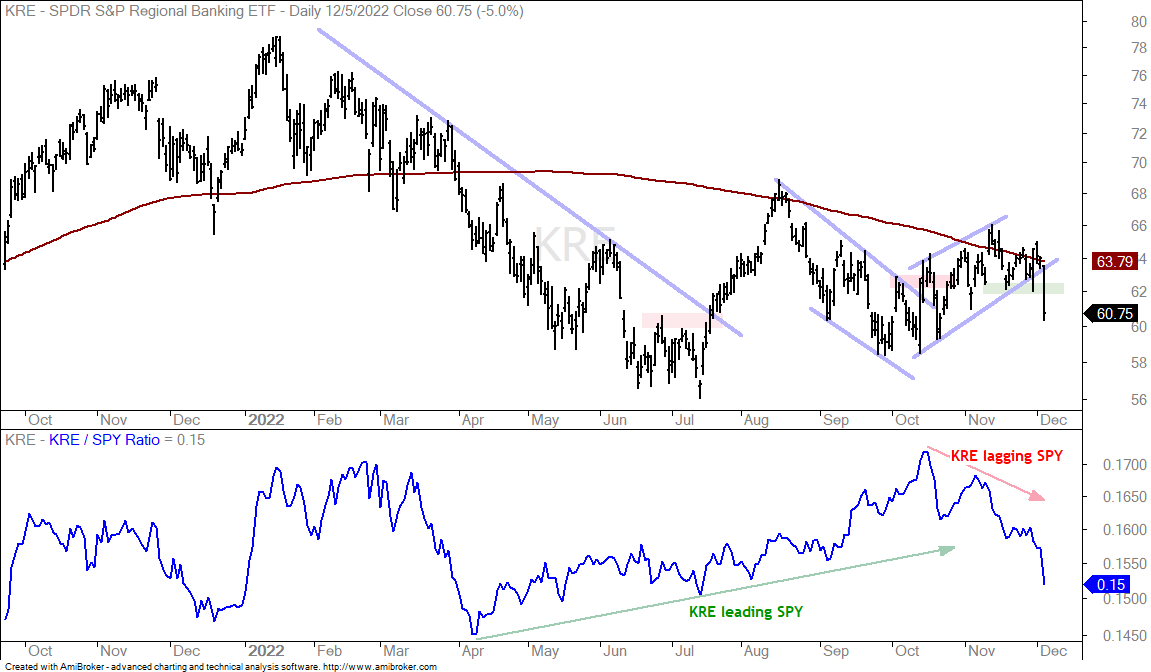
The Regional Bank ETF (KRE), which is part of the finance sector, could not hold above its falling 200-day and never even challenged its August high. The ETF appeared to break out of a falling wedge in late October, but hit resistance at the 200-day and lost its traction. The ETF broke the mid November low with a sharp decline on Monday and this reverses the short-term upswing. Note that financials is the biggest sector (17.27%) in the Russell 2000 ETF (IWM) and many of these are regional banks. A breakdown in KRE bodes ill for IWM.
Watching Semis, Housing and Retail (SOXX, ITB, XRT)
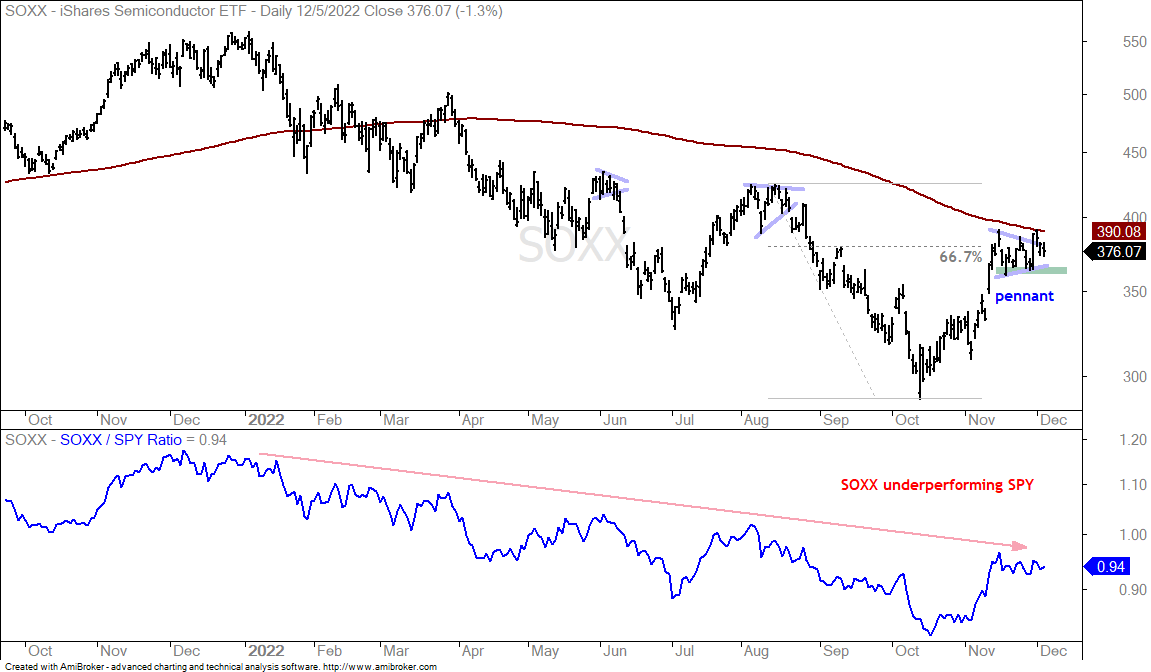
The Semiconductor ETF (SOXX) is trading near a make or break zone that could have ramifications for the tech sector and the market. Note that the tech sector overall is underperforming and several tech-related ETFs did not even break their October highs. These include SKYY, CIBR, FDN, FINX and IPAY. SOXX is one of the better performing tech ETFs, but it is trading in a resistance-reversal zone. Note that SOXX is just below the falling 200-day SMA and the October-December advance retraced around 2/3 of the prior decline. Short-term, SOXX broke out of a pennant last week and then fell back. The pennant breakout is still alive and we now need to see follow through above the 200-day. Failure and a break below the pennant lows would be short-term bearish.
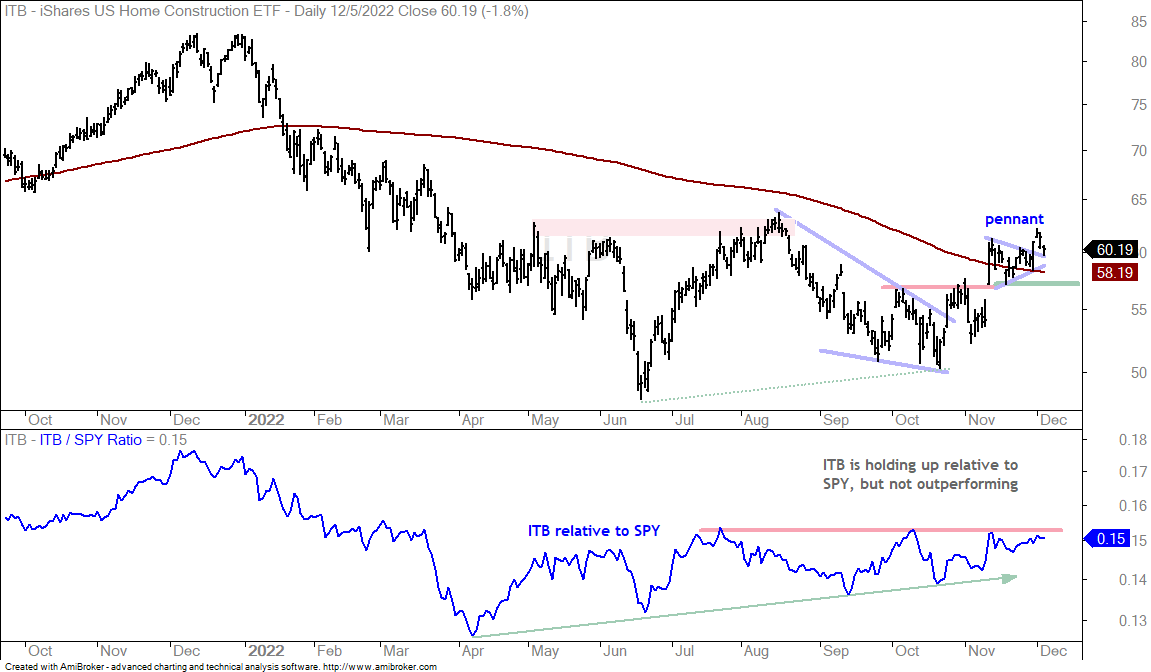
The Home Construction ETF (ITB) is holding up fairly well short-term. The ETF broke out with a big surge in mid November, stalled with a short-term pennant into early December and broke out of the pennant last week. This breakout is holding for the most part and ITB is just above its 200-day. Again, the mid November low holds the key. A break here would be short-term bearish.
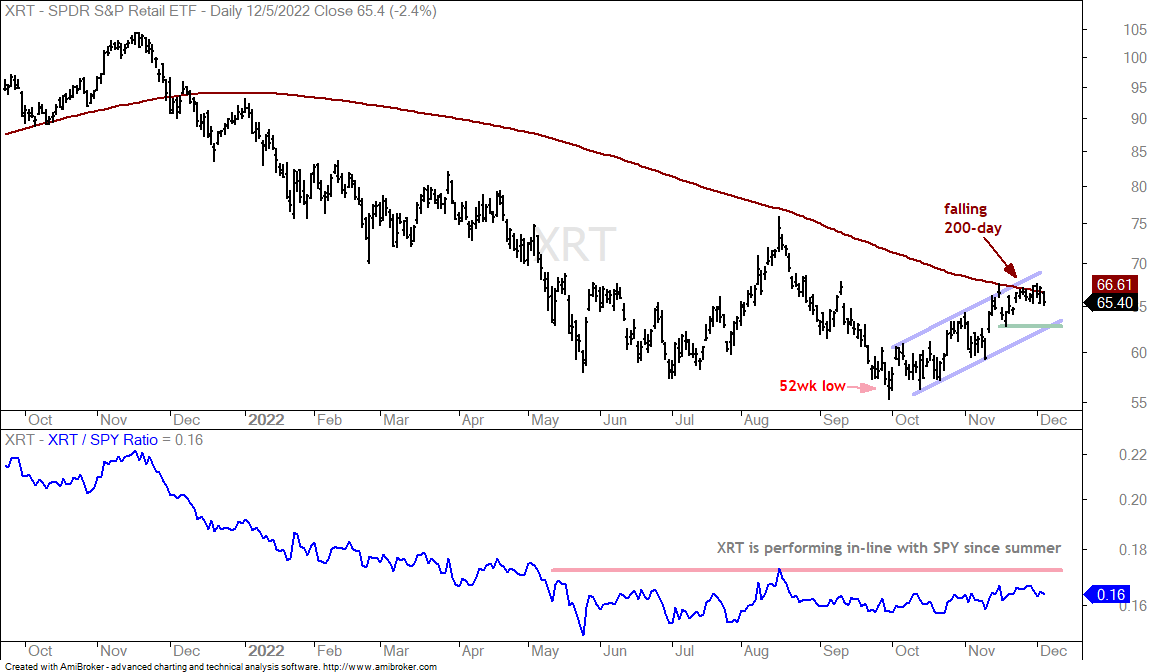
The next chart shows the Retail SPDR (XRT) participating in the advance since mid October, but with no out-performance or enthusiasm. The price-relative in the bottom window shows the XRT:SPY ratio flatlining since June, which means it is performing in line with SPY. On the price chart, XRT advanced to the falling 200-day and stalled. The short-term trend is up with the mid November low marking support. A break below this low would reverse the short-term uptrend and put the bigger downtrend back in play.
Healthcare, Biotech and Defense Lead (XLV, IHF, IBB, PPA)
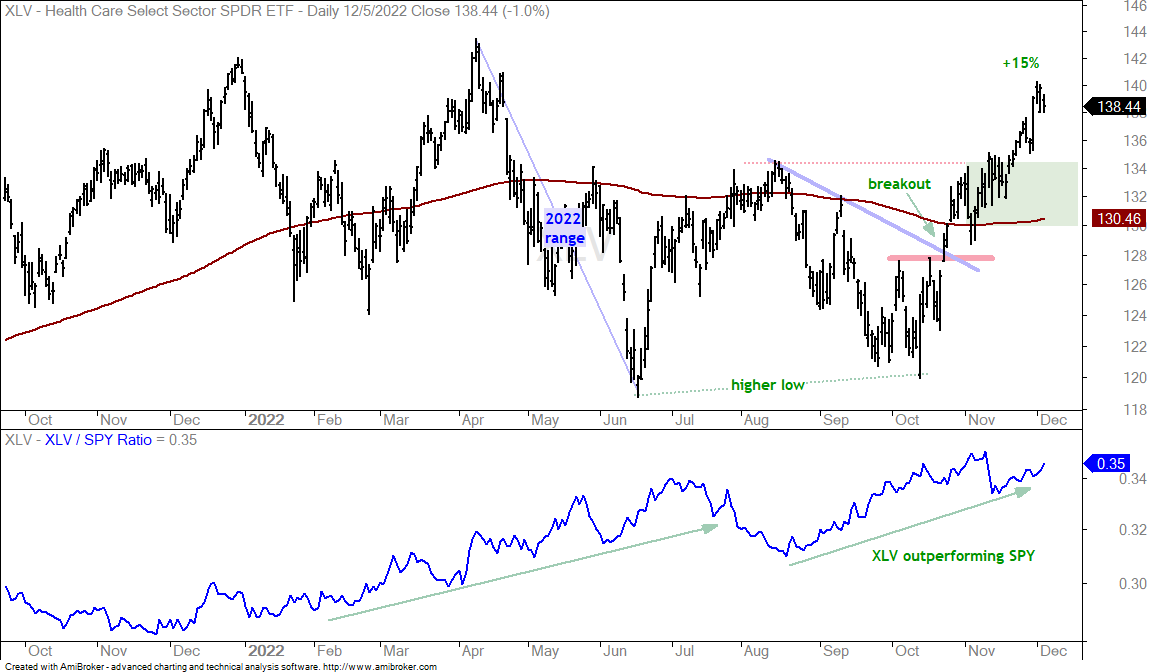
The Healthcare SPDR (XLV) is one of the leading sectors right now because it is above its 200-day SMA, the 200-day is turning up, the ETF exceeded its August high with ease and XLV is just 4% from a 52-week high. The indicator window shows the XLV:SPY ratio moving higher since mid August as XLV outperforms SPY. The out-performance path is not straight up because XLF has been range bound the entire year. It is now nearing the top of its range and getting short-term extended. The green shading marks a support-reversal zone to watch should we get a pullback.
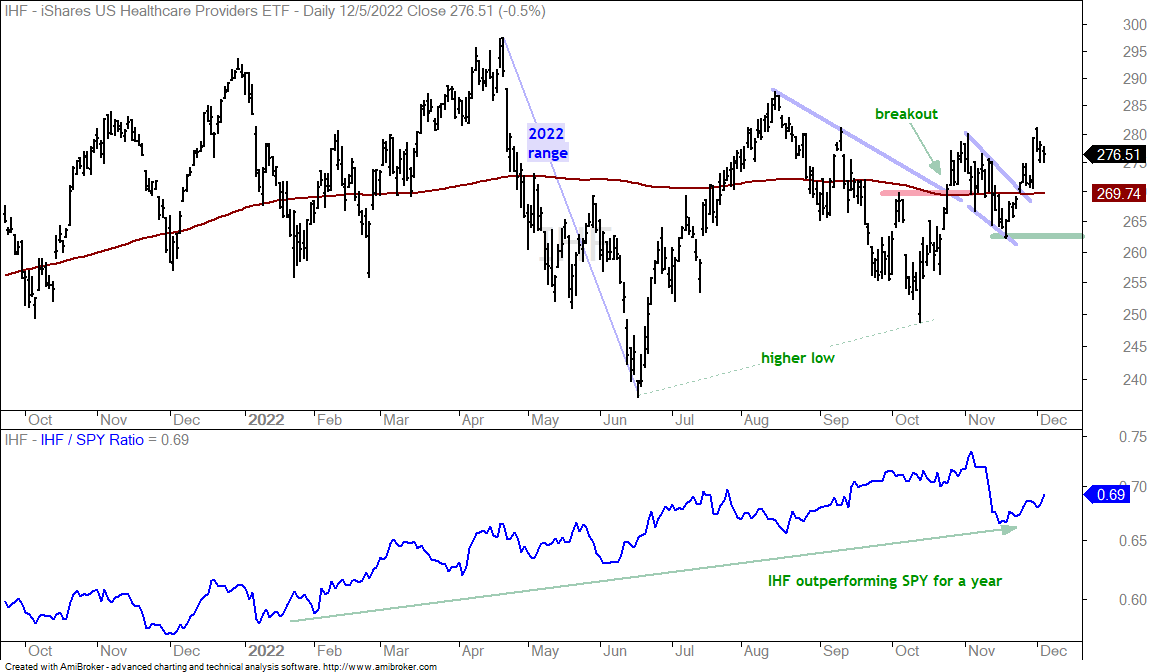
The next chart shows the Healthcare Providers ETF (IHF) outperforming SPY the entire year. This just reflects the fact that IHF is flat for the year and SPY is down. Hence, IHF is outperforming SPY. IHF broke out with a surge in late October, fell back with a small wedge and broke out in late November.
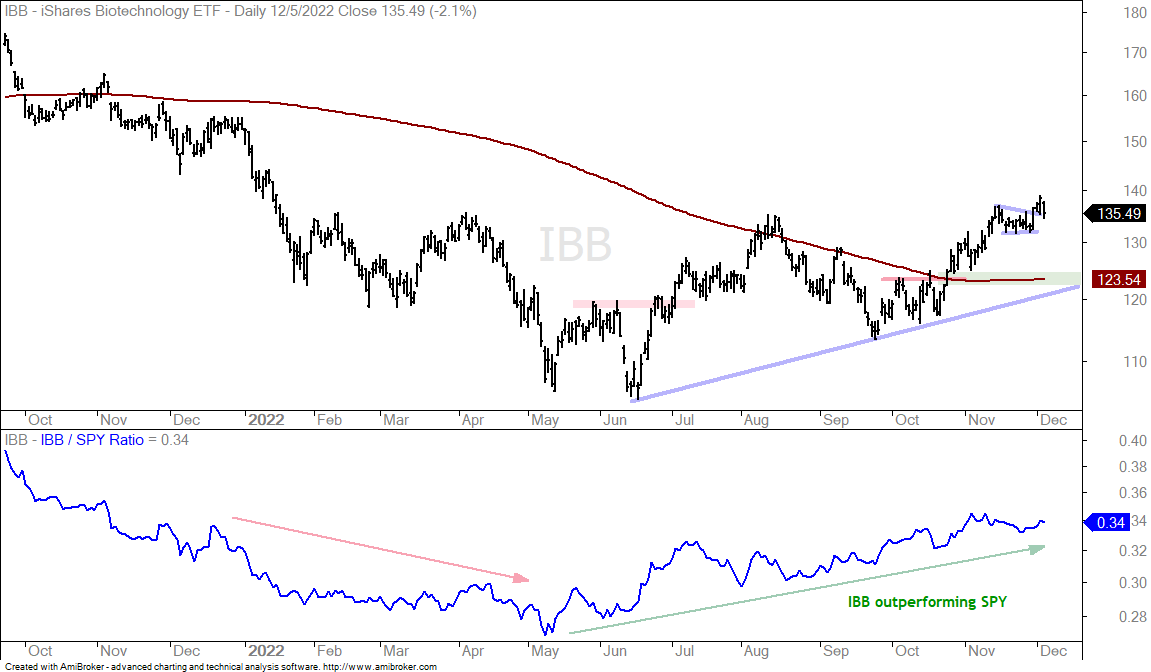
The next chart shows the Biotech ETF (IBB) breaking out in late October and exceeding its August high. The ETF also formed a small pennant and broke out last week. IBB is still tied to broad market performance so short-term support breaks in the broad market index ETFs would likely lead to weakness in IBB. The green shading marks a support zone to watch should IBB pull back (broken resistance, 200-day SMA and June trendline).
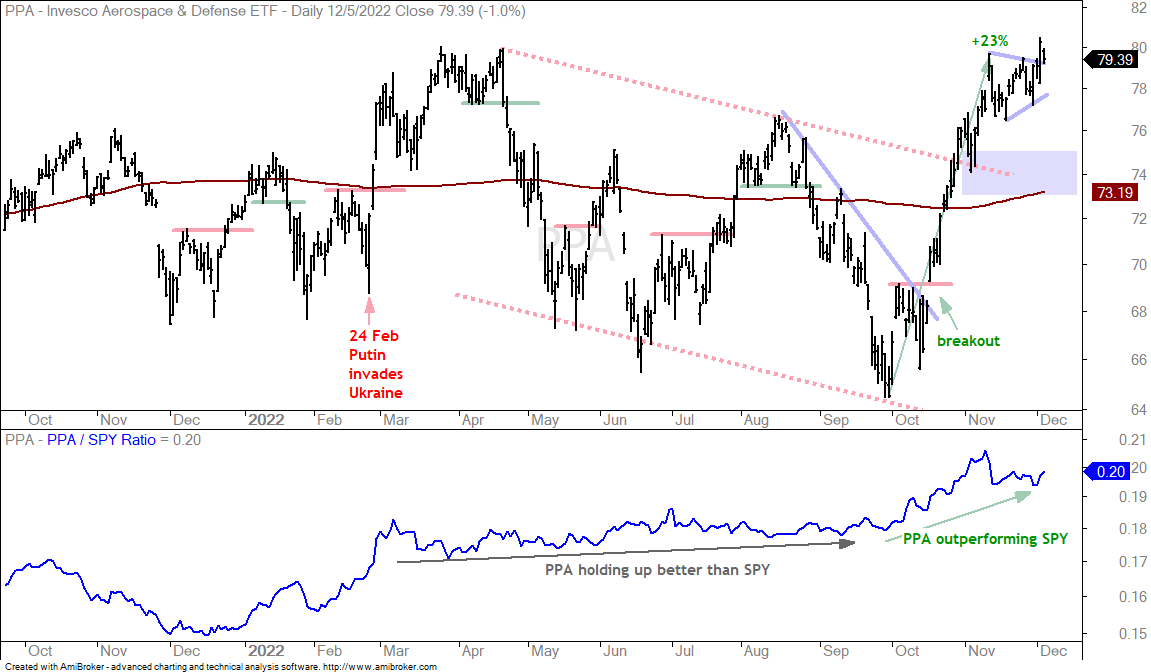
The next chart shows the Aerospace & Defense ETF (PPA) hitting a 52-week high with the close above 80 last week. As with the other leaders, the path to out-performance and the 52-week high was not steady. It was jagged with big swings that crosse the 200-day several times. Short-term, PPA is breaking out of a pennant, but I think it is still quite extended and do not see a setup. The blue shading marks a possible support-reversal zone in the 73-75 area to watch going forward.
You can learn more about exit strategies in this post, which includes a video and charting options for everyone.
US Oil Fund Turns Volatile after Break Down (USO)
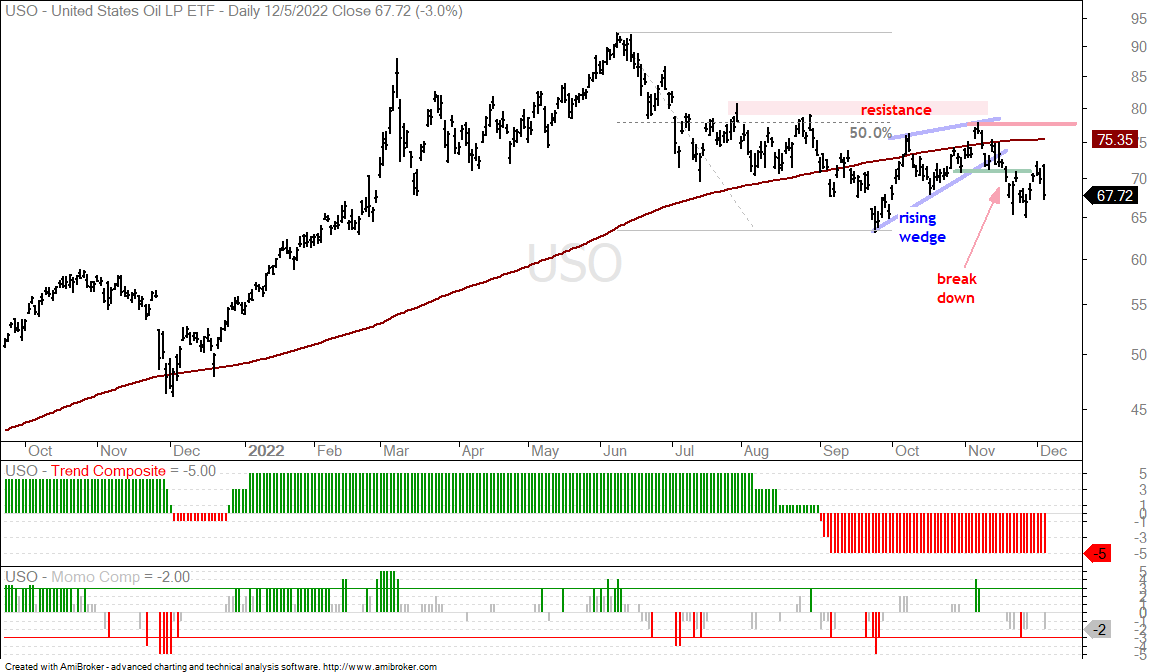
Oil and the US Oil Fund (USO) remain volatile with several geo-political factors influencing prices (OPEC, Price Cap, War in Ukraine, China). Overall, USO is in a downtrend and the rising wedge break is the most recent signal. I will leave resistance at the November high.
The Trend Composite aggregates signals in five trend indicators: Bollinger Bands (125,1), Keltner Channels (125,2), 5-day Rate-of-Change of 125-day SMA, StochClose (125,5) and CCI-Close (125). The Trend Composite and ten other indicators are part of the TIP Indicator Edge Plugin for StockCharts ACP
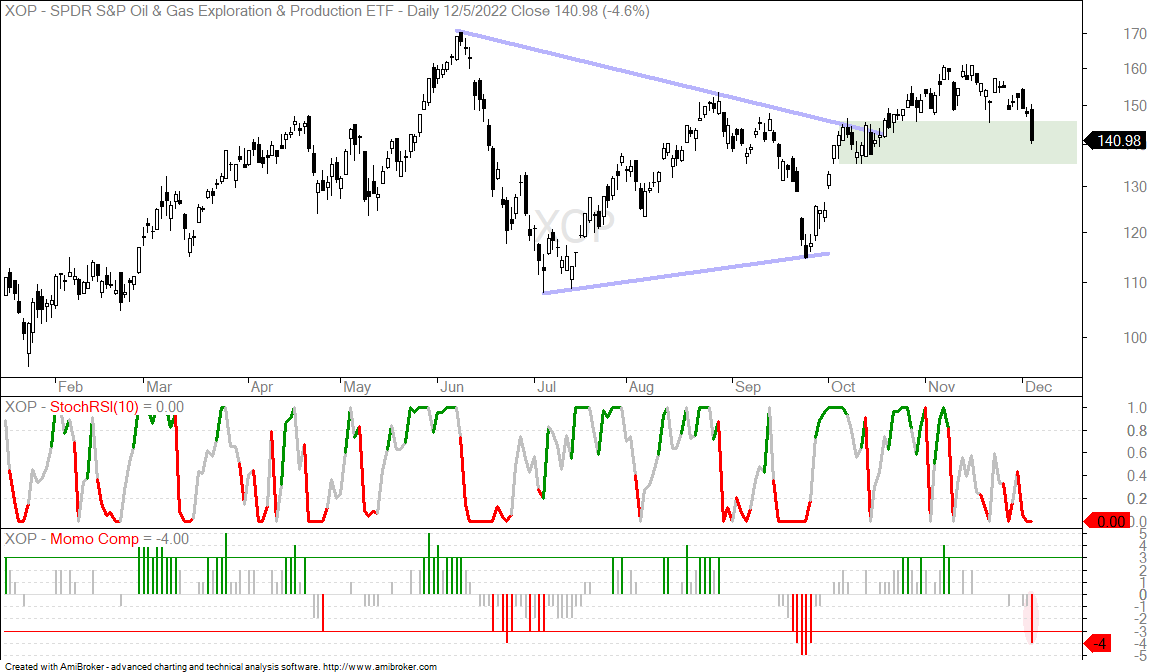
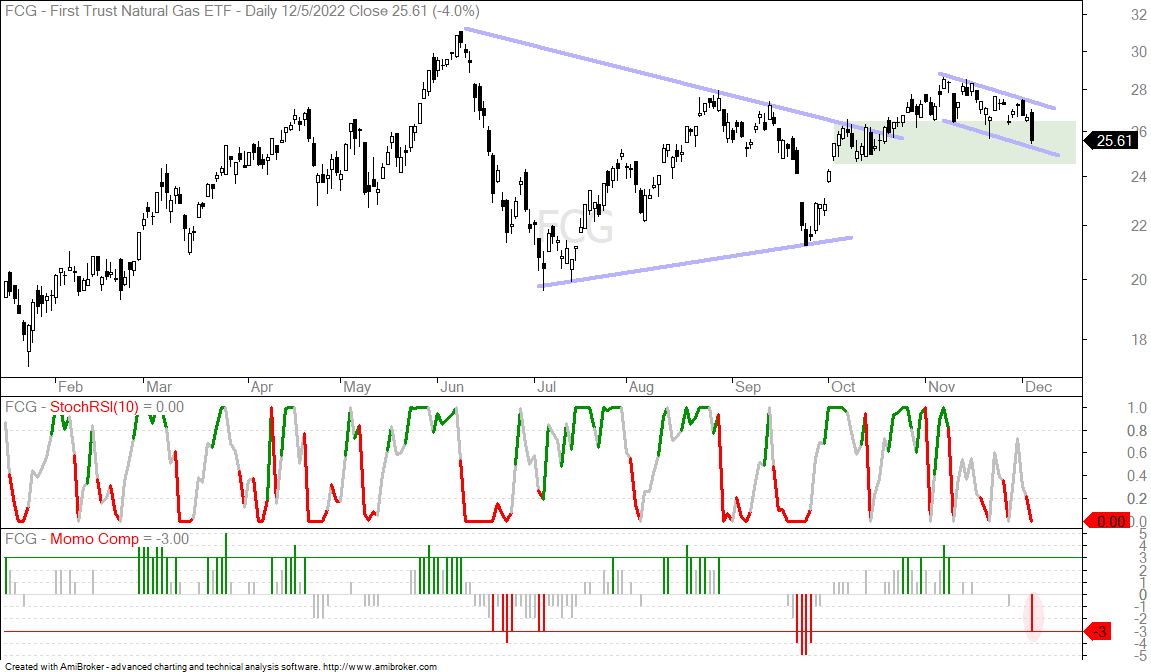
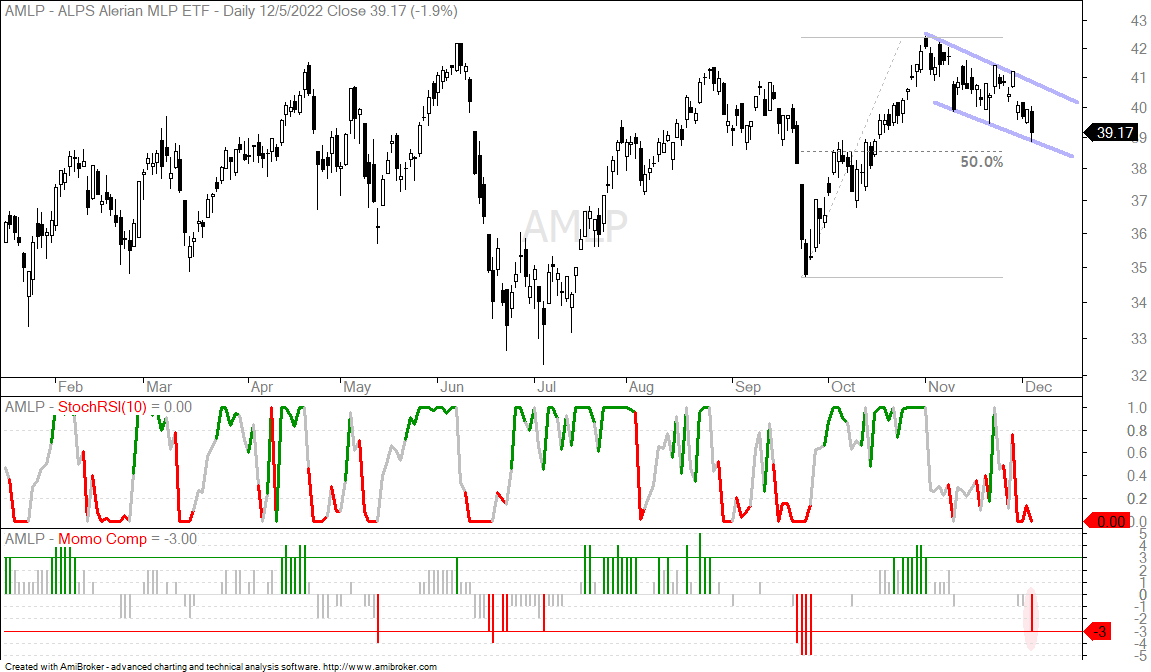
Energy ETFs Become Short-term Oversold
(XLE, XOP, FCG, AMLP)
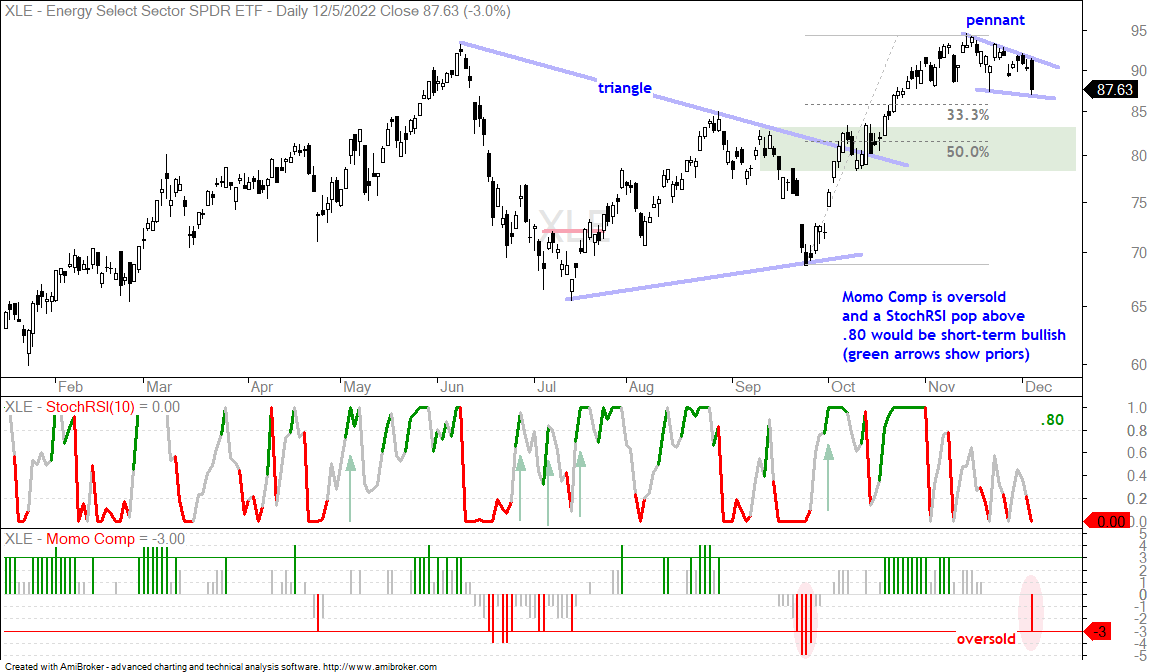
The energy-related ETFs were hit hard on Monday and many became short-term oversold as the Momentum Composite dipped to -3 or lower. I will cover the Energy SPDR (XLE) for this analysis and then show the other charts. On the price chart, XLE hit a new high in mid November and then corrected with a pennant the last few weeks. This pennant represents a short pullback that alleviates overbought conditions, which were present in mid November. A pennant breakout would be bullish and open the door to new highs.
The bottom window shows the Momentum Composite hitting -3 to become oversold. XLE is oversold and could become more oversold because we have yet to see signs of firming or a bounce. The middle window shows StochRSI (10) and a pop above .80 would provide the first signs of a bounce. Note that Pullbacks are tricky because we never know how far they will extend. XLE could correct to the breakout zone and retrace half of the prior advance (green shading).
You can learn more about my chart strategy in this article covering the different timeframes, chart settings, StochClose, RSI and StochRSI.
")