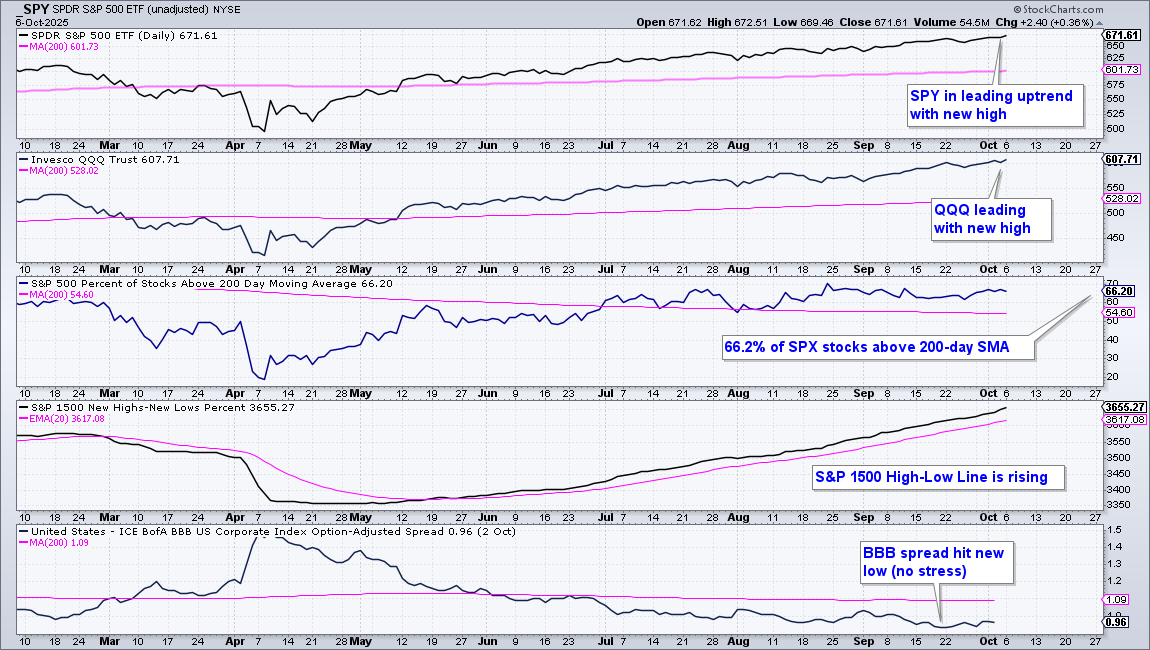
The weight of the evidence remains bullish for stocks. Large-caps (SPY) and QQQ (large techs) are leading with new highs on Monday. 66% of S&P 500 are above their 200-day SMAs, which means the vast majority of stocks are in long-term uptrends. The S&P 1500 High-Low Line hit new highs and remains above its 20-day EMA. This means new highs are consistently outpacing new lows (bullish). And finally, BBB Yield Spread ($$BBBOAS) hit new lows in late September, which means there are no signs of stress in the credit markets.
Big Tech and AI Groups Lead
The Technology SPDR (XLK) and many of the tech-related ETFs went on a tear in September with double digit advances the last 24 trading days. Leading ETFs include:
Technology SPDR (XLK) +10.70%
Mag7 ETF (MAGS) +10.57%
Global AI & Tech ETF (AIQ) 14.43%
Robotics AI ETF (ARTY) +15%
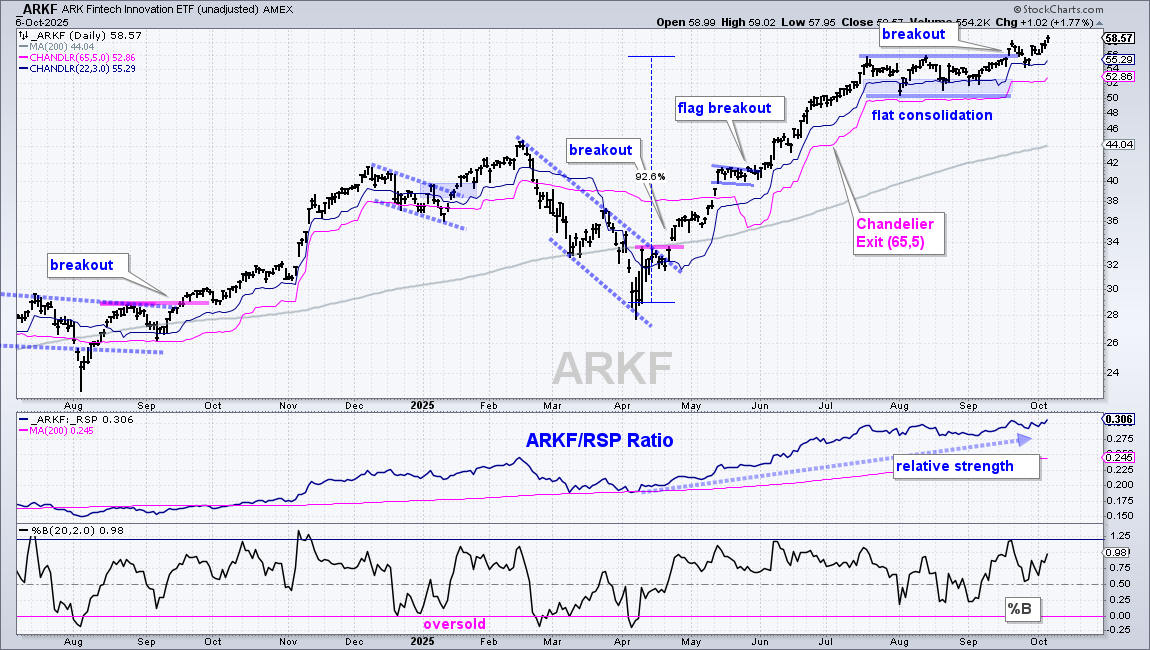
ARK Fintech Innovation ETF (ARKF) +10.89%
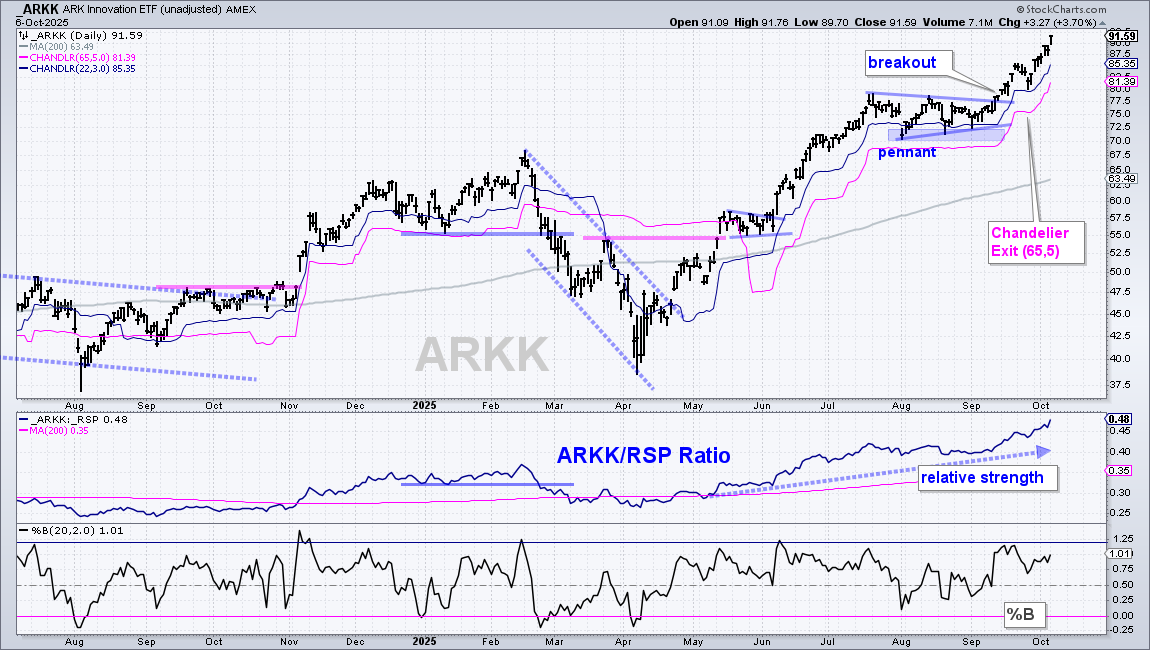
ARK Innovation ETF (ARKK) +23.09%
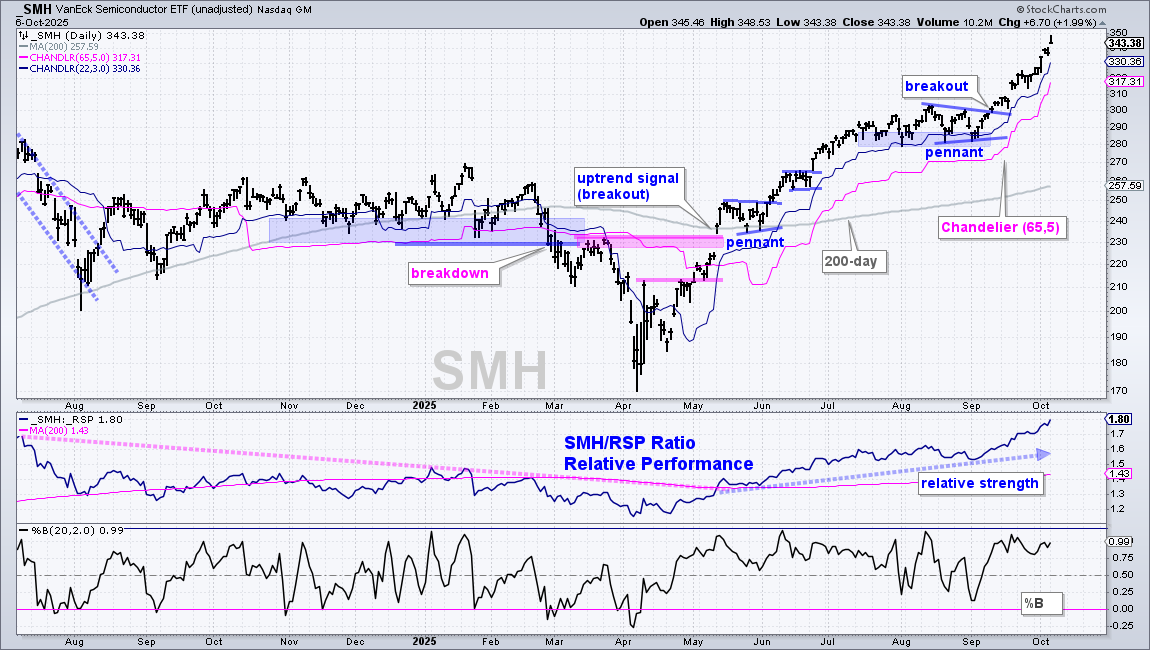
Semiconductor ETF (SMH) +19.86%
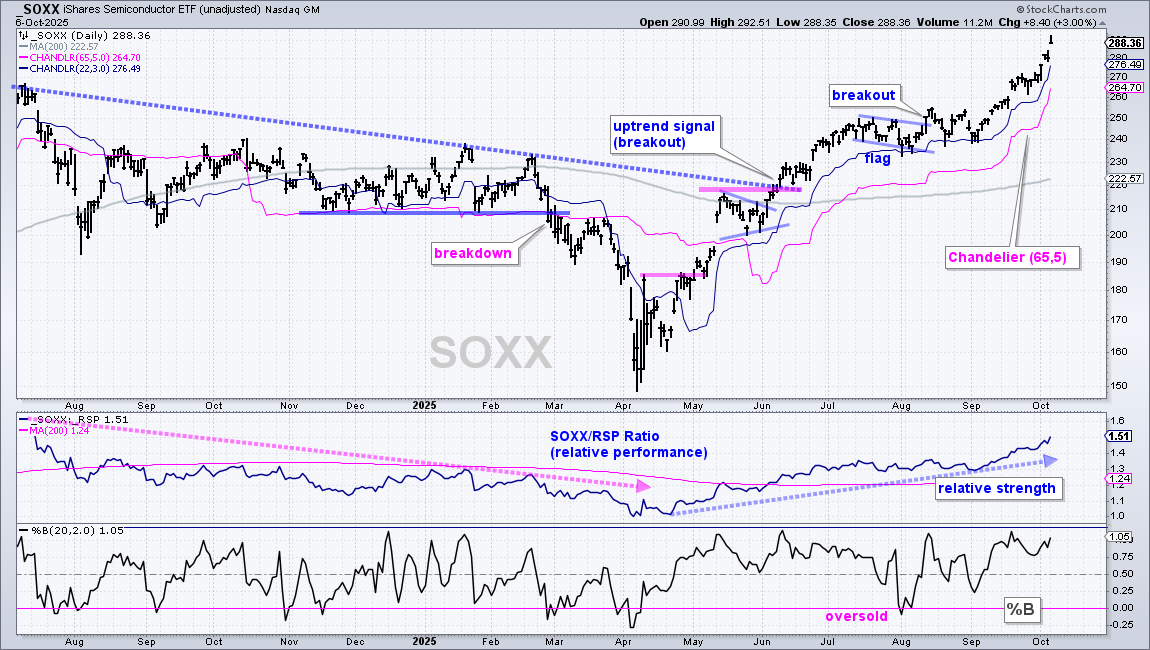
Semiconductor ETF (SOXX) 18.75%
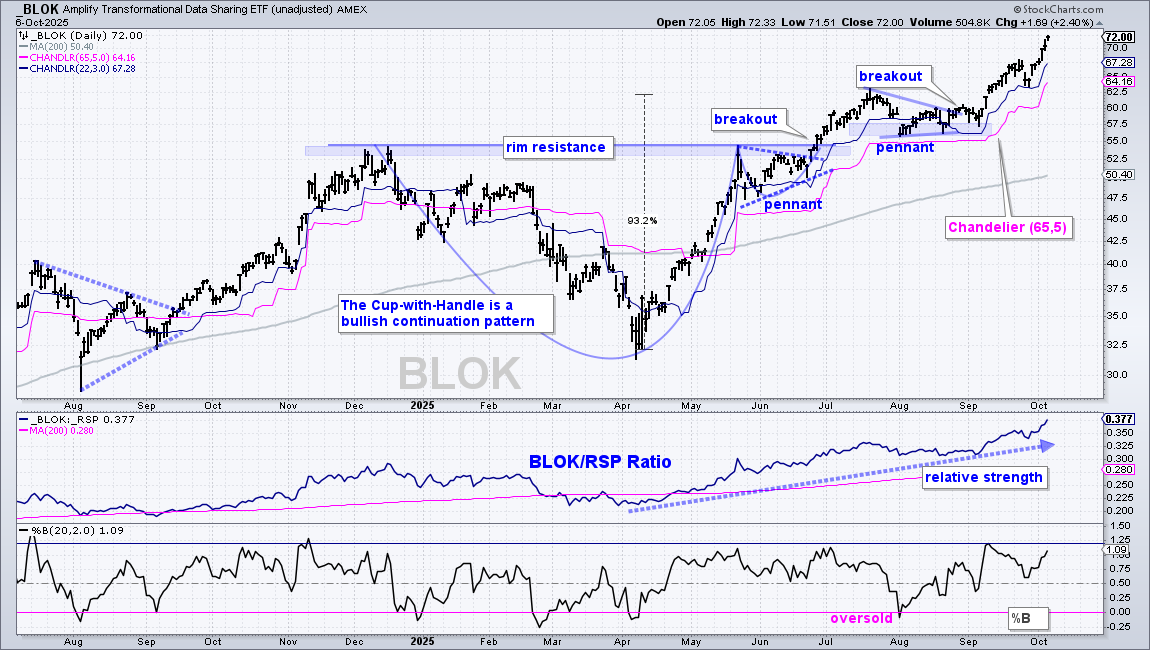
Transformational Data Sharing ETF (BLOK) +20.87%
Meanwhile, some “less sexy” groups without an AI focus fell the last 24 trading days (ROC(24)). These include:
Energy SPDR (XLE) -1.29%
Materials SPDR (XLB) -1.98%
Consumer Staples SPDR (XLP) -3.96%
Home Construction ETF (ITB) -2.89%
Homebuilders ETF (XHB) -2.81%
Regional Bank ETF (KRE) -1.52%
Part of the market is going to the moon, while other parts are trading flat/down and underperforming. It’s a bull market, but not a bull market that lifts all stocks because some 34% of S&P 500 stocks are below their 200-day SMAs. This makes it a stock/ETF picker’s market.
SPY and QQQ Keep Chugging Along
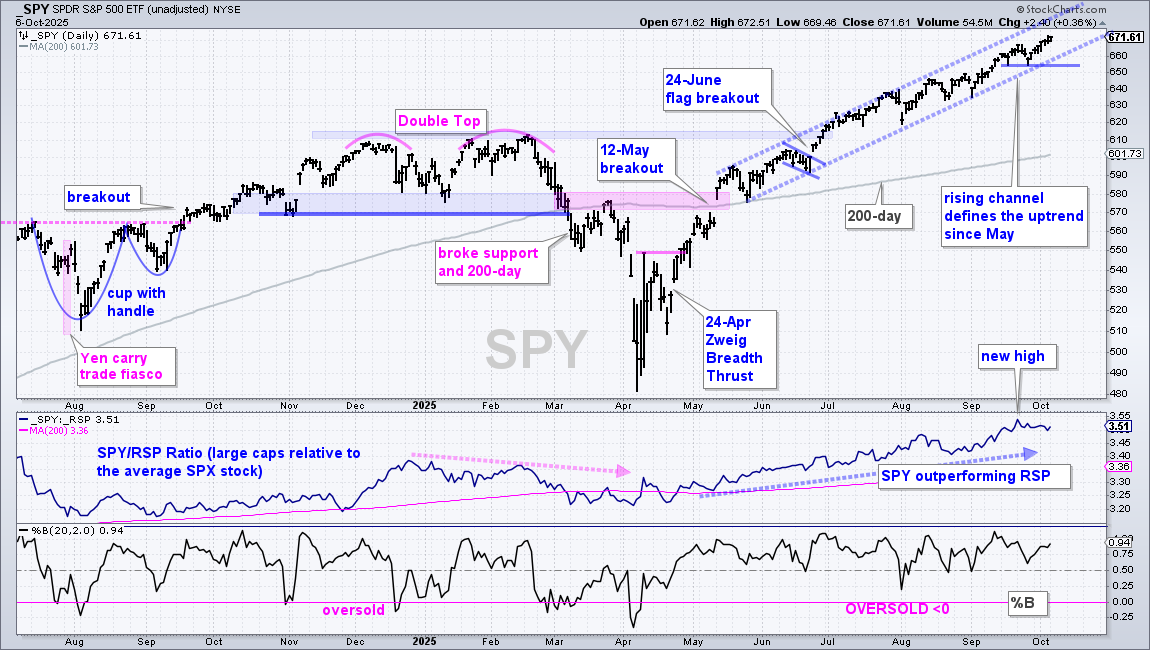
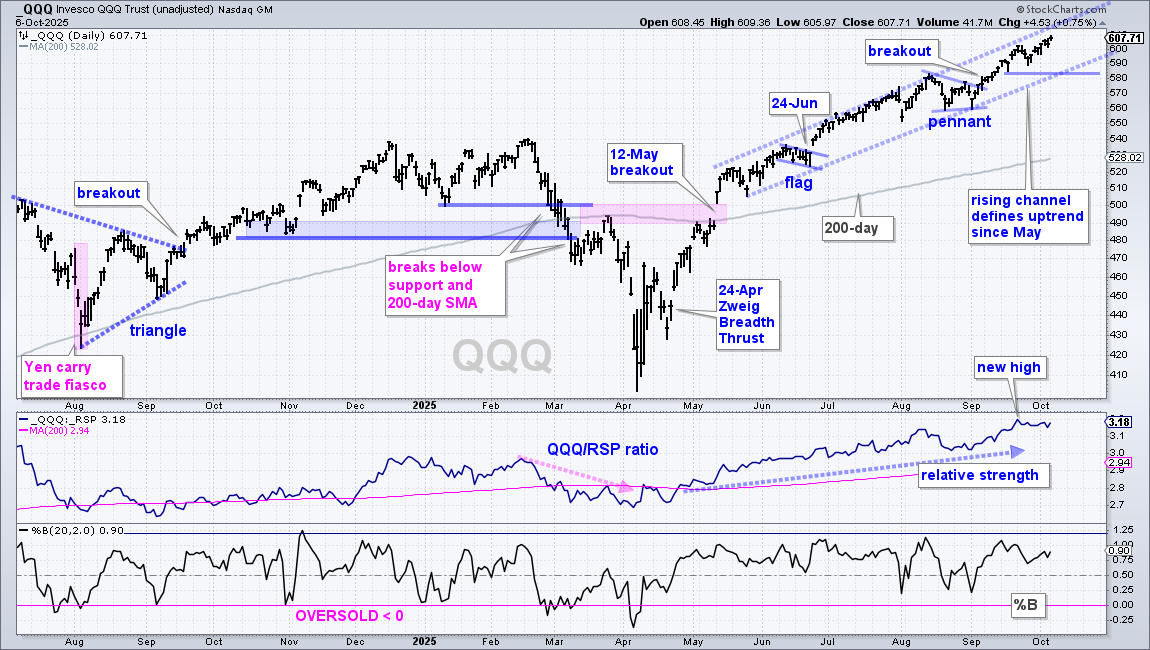
SPY and QQQ surged with steep advances from mid-April to mid-May and then embarked on a steady march higher. On the SPY chart, the blue dashed lines mark a rising channel that defines the upswing, which is five months and counting. Pullbacks within this upswing are short and shallow, and each pullback is followed by a new high. The mid-September lows mark first support. A break below these lows would reverse the five month uptrend and argue for a corrective period. So far, there are no signs of a correction.
The bottom window shows the SPY/RSP ratio hitting a new high in late September, which means large-caps are outperforming the average stock in the S&P 500. It is still a large-cap dominated world. The next chart shows QQQ with similar characteristics.
XLI Breaks Triangle Line and Hits New High
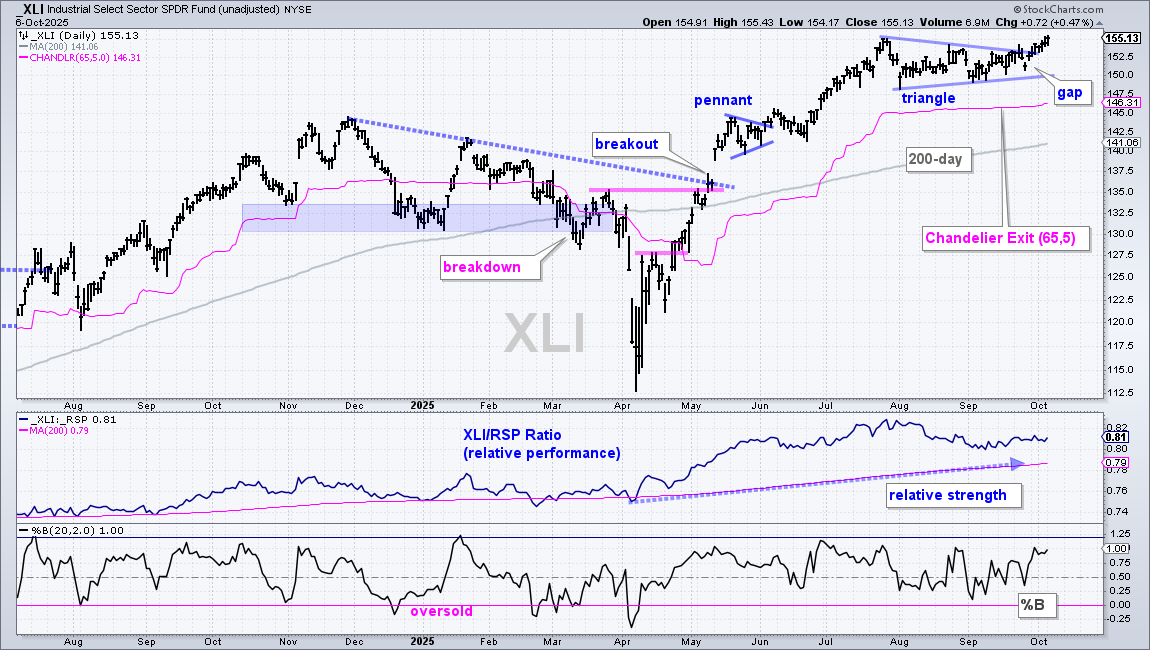
The Industrials SPDR (XLI) led the market with a strong advance from early April to late July and then moved into a narrowing consolidation. After a strong advance, a triangle is a bullish continuation pattern that marks a rest within the uptrend. I featured this pattern on September 23rd. XLI gapped up on September 26th and broke out a few days later. With a new high on Monday, XLI is again leading on the price charts.
The pink line shows the Chandelier Exit (65,5) at 146.31. This exit is 5 ATR(65) values below the 65-day high. Chandelier Exits rise as long as prices rise and flatten when prices fall or move sideways. A close below the Chandelier Exit (65,5) means prices fell more than 5 ATR(65) values from the 65-day high. Such a fall means there was an outsized decline that could destabilize the uptrend.
XLU Surges to New Highs
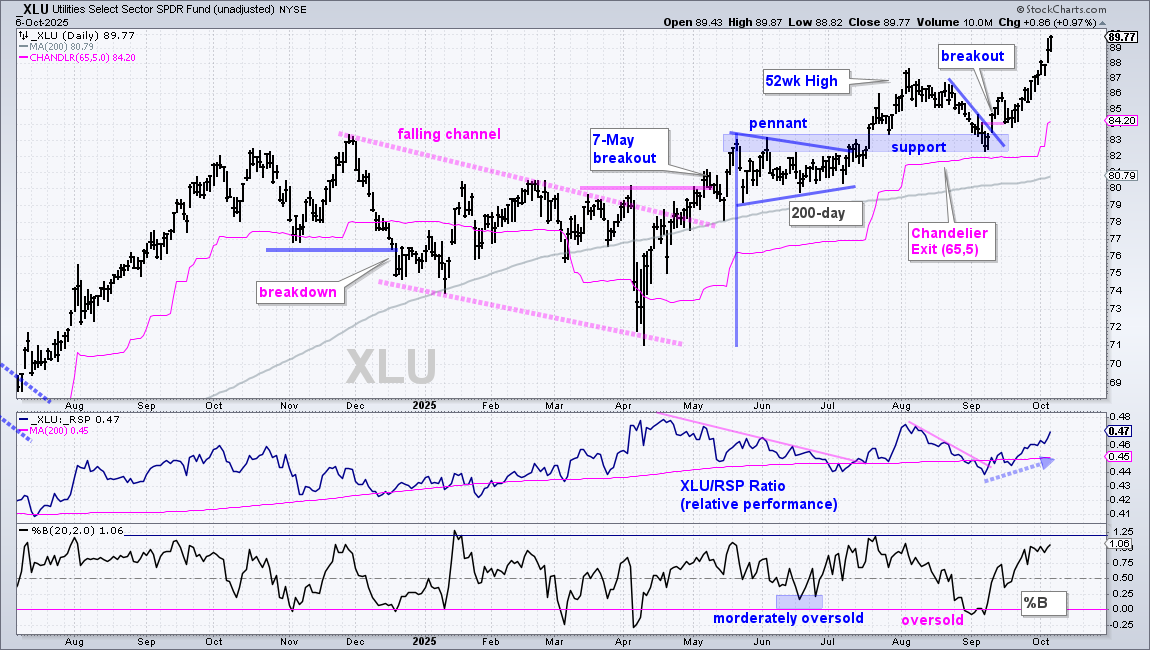
The Utilities SPDR (XLU) continues to lead the market as it follows through on the early September breakout, which was featured in the report on September 11th. The setup was classic: pullback within uptrend and oversold condition (%B<0). Follow through is strong and XLU is leading with fresh new highs. There is nothing to do here except monitor price action and consider exit strategies. XLU is in the trend-monitoring phase. The pink line shows the Chandelier Exit (65,5) for reference.
Infrastructure ETF Extends on Breakout
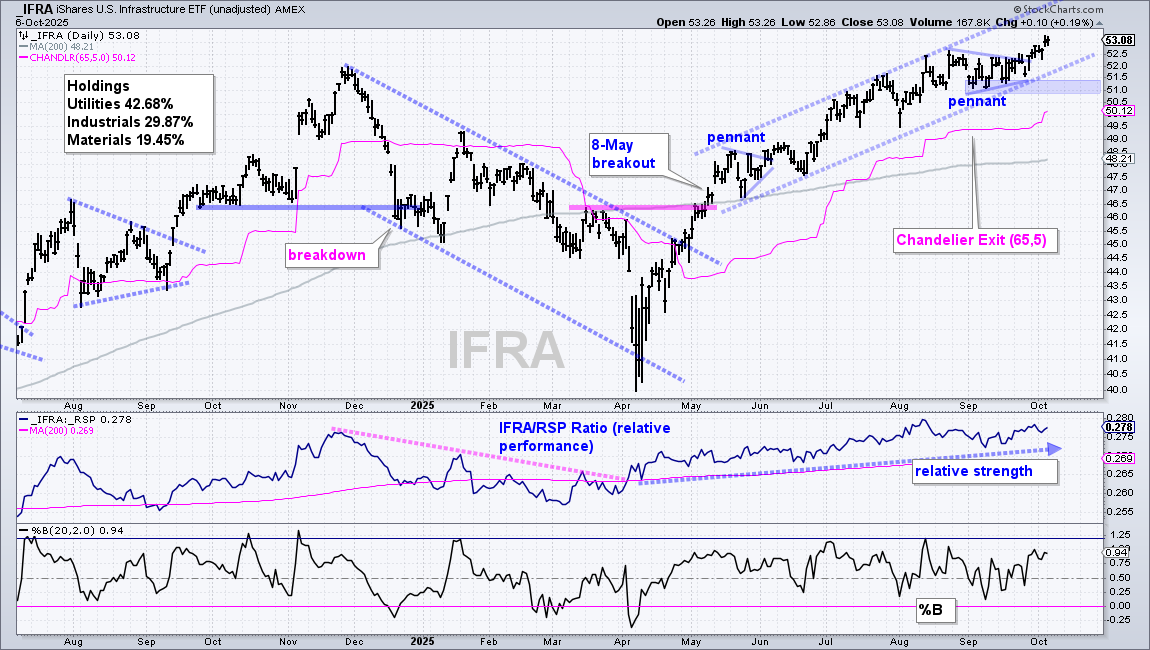
The next chart shows the Infrastructure ETF (IFRA) hitting new highs in August, correcting into September with a pennant and breaking out to new highs. IFRA benefits from strength in Utilities and Industrials, which account for over 70% of the ETF. As with other leaders, a rising channel defines the advance since mid May with a series of shallow pullbacks and higher highs. The September lows mark support at 51, a break of which would argue for a corrective period. For reference, the Chandelier Exit (65,5) is at 50.12. Now is the time to plan your exit strategy and pick a level.
XLV Moves into Trend-monitoring Phase
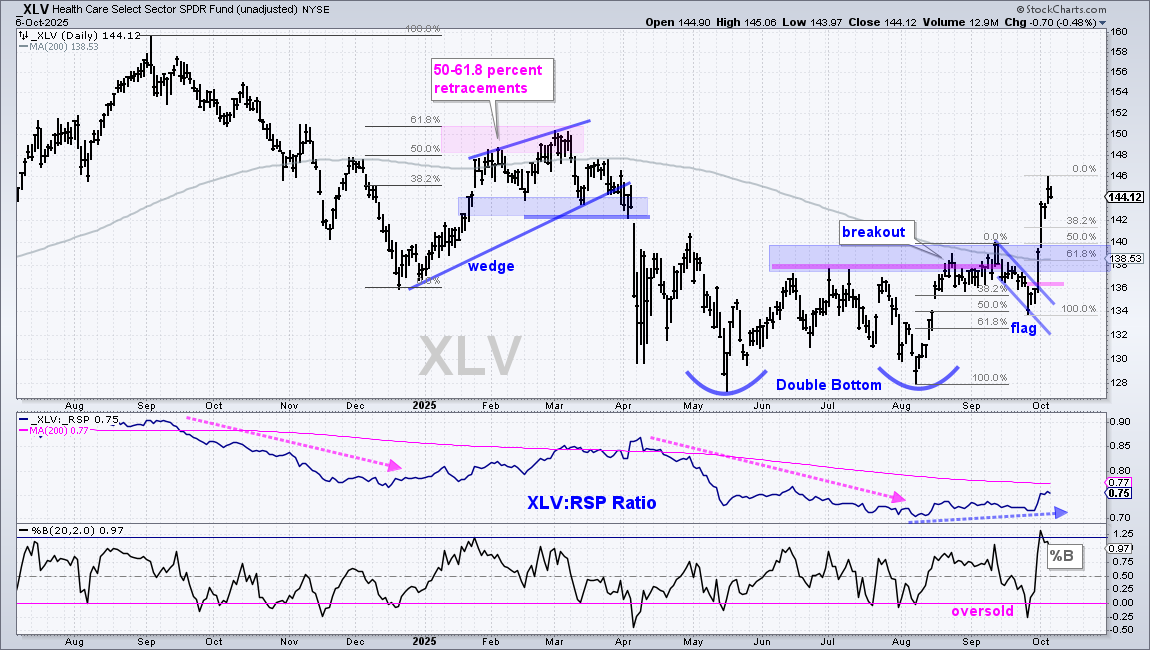
The Healthcare SPDR (XLV) was featured last week as it formed a falling flag after the Double Bottom breakout. XLV broke out with a big move last Tuesday and followed through with a move above 144. Note that this is the second big surge in the last ten weeks. The first occurred off the early August low and the second off the late September low. These are bullish thrusts that signal the beginning of a long-term uptrend. Short-term, XLV is getting extended and I do not see a setup, which means XLV is in the trend-monitoring phase (strong uptrend without a setup). Broken resistance levels turn into first supports (blue shading). The 50-61.8 percent retracements are also in the 139-140 area. Thus, a pullback to the 140 area could offer a second chance to partake in the breakout.
Insurance ETF Breaks Out
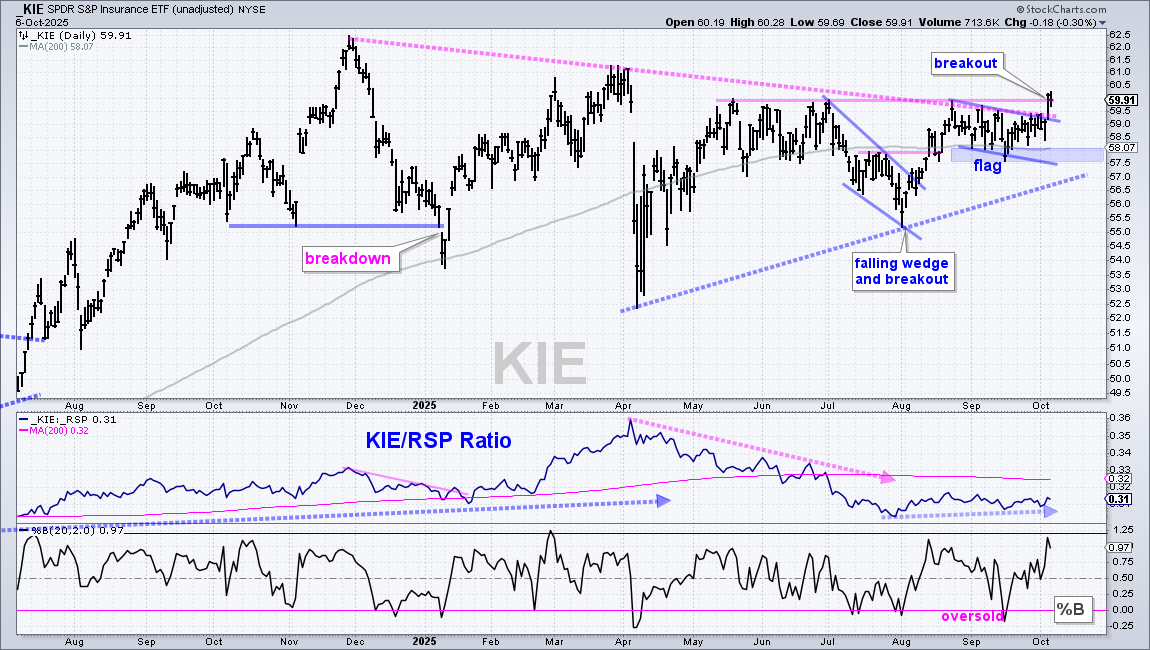
The Insurance ETF (KIE) sprang to life with a break above the May-June highs. Overall, KIE trended lower with lower lows and lower highs (pink dashed trendline). A higher low formed from April to early August as the ETF formed a falling wedge and broke out in mid-August. KIE then formed a falling flag into September and broke out with a surge last Friday. This breakout also reversed the long-term downtrend because KIE finally exceeded its May-June highs. The ETF defended the 57.5-58 area with bounces from mid-August to early October. This zone marks key support, and a break below 57.50 would call for a re-evaluation.
XLK and Tech ETFs in Trend-monitoring Phase
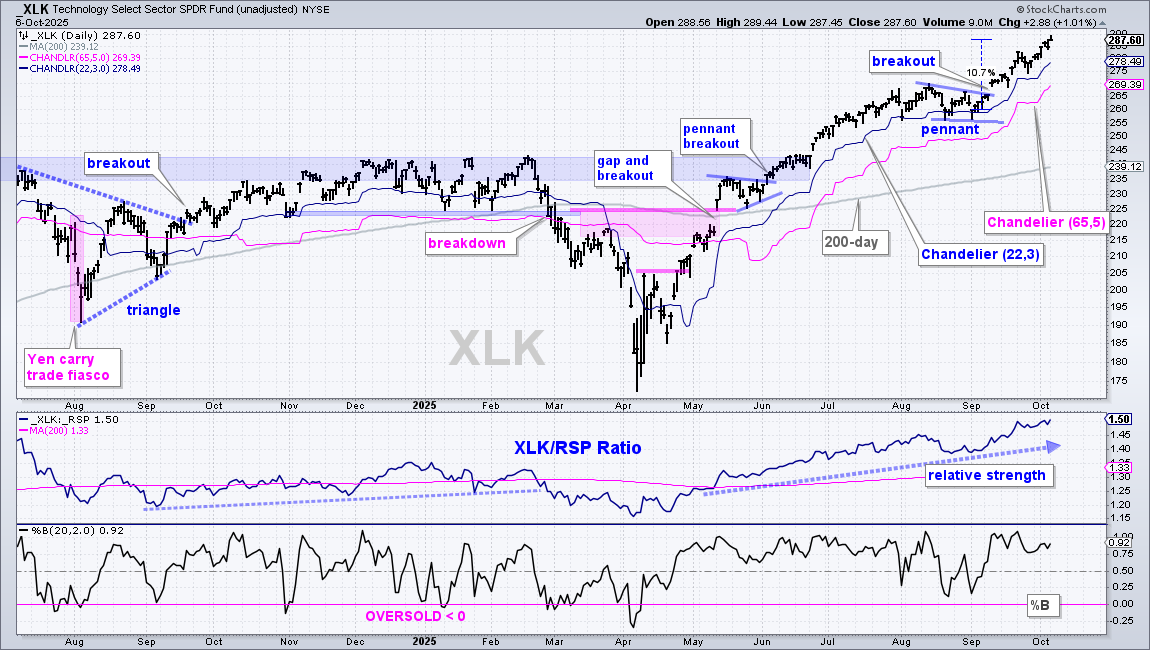
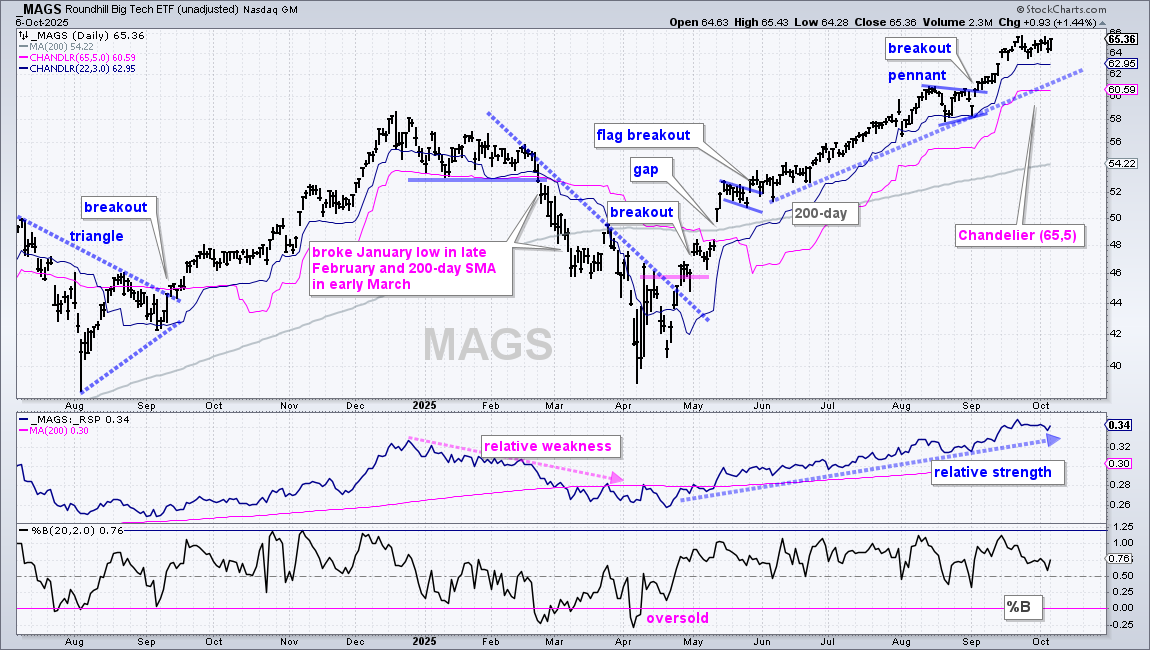
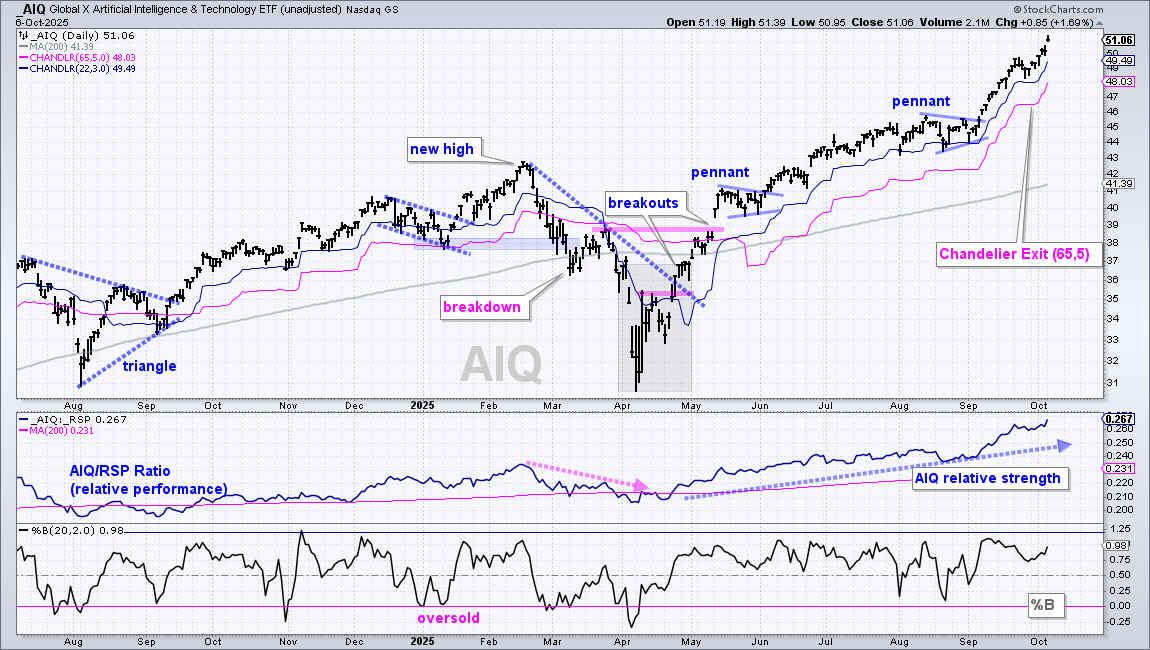
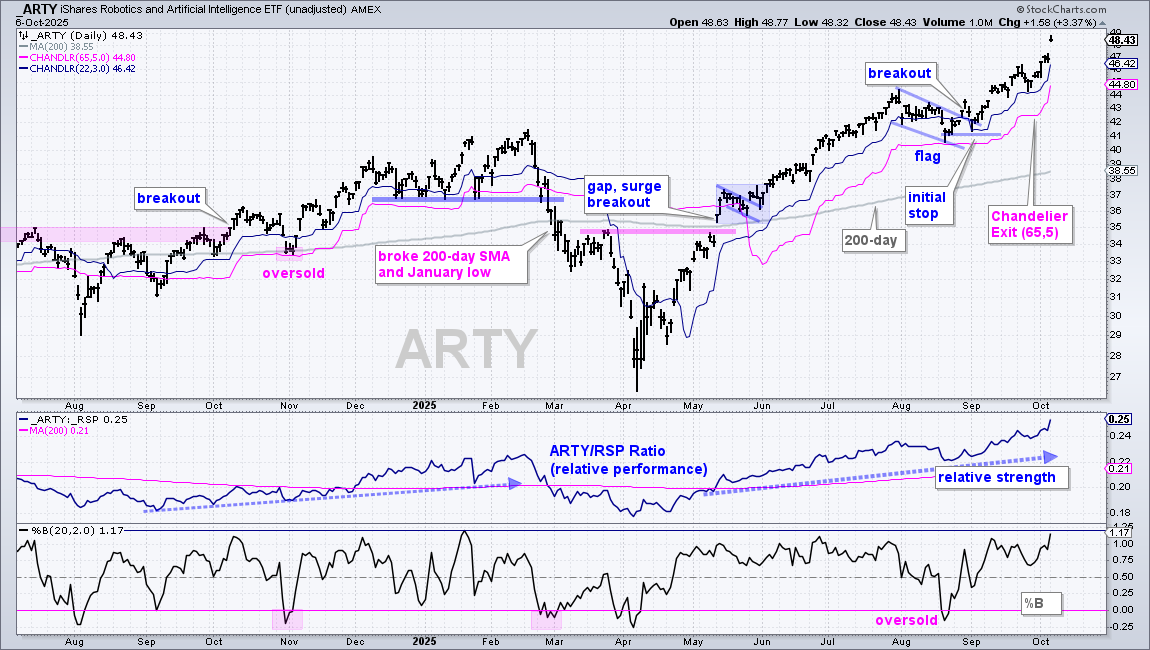
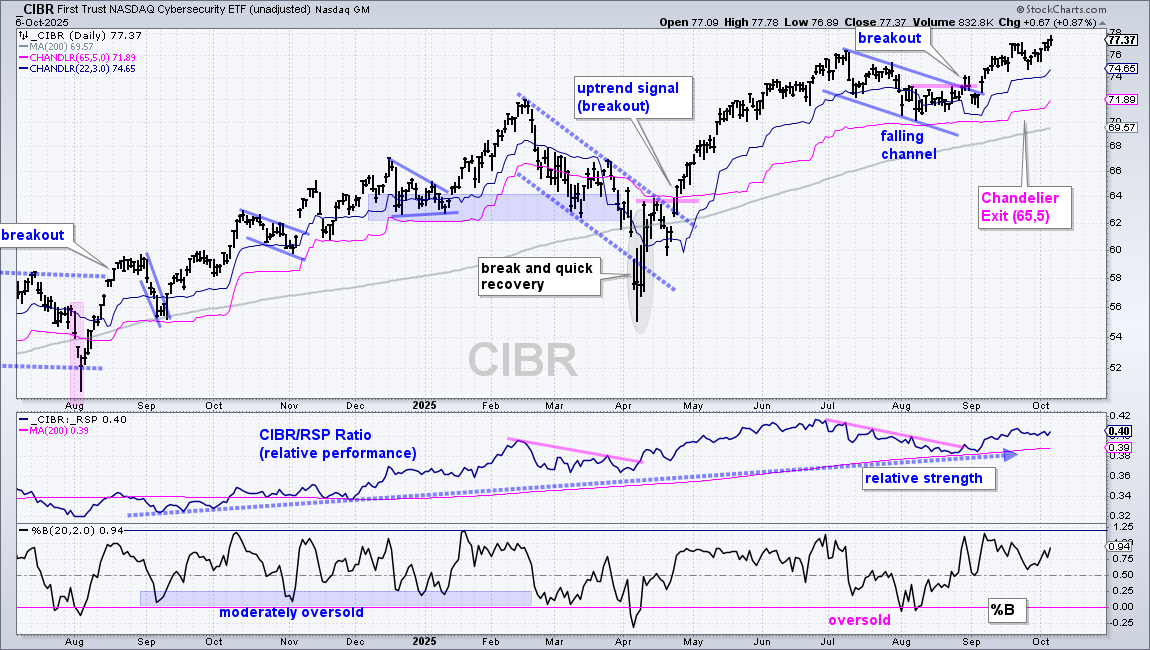
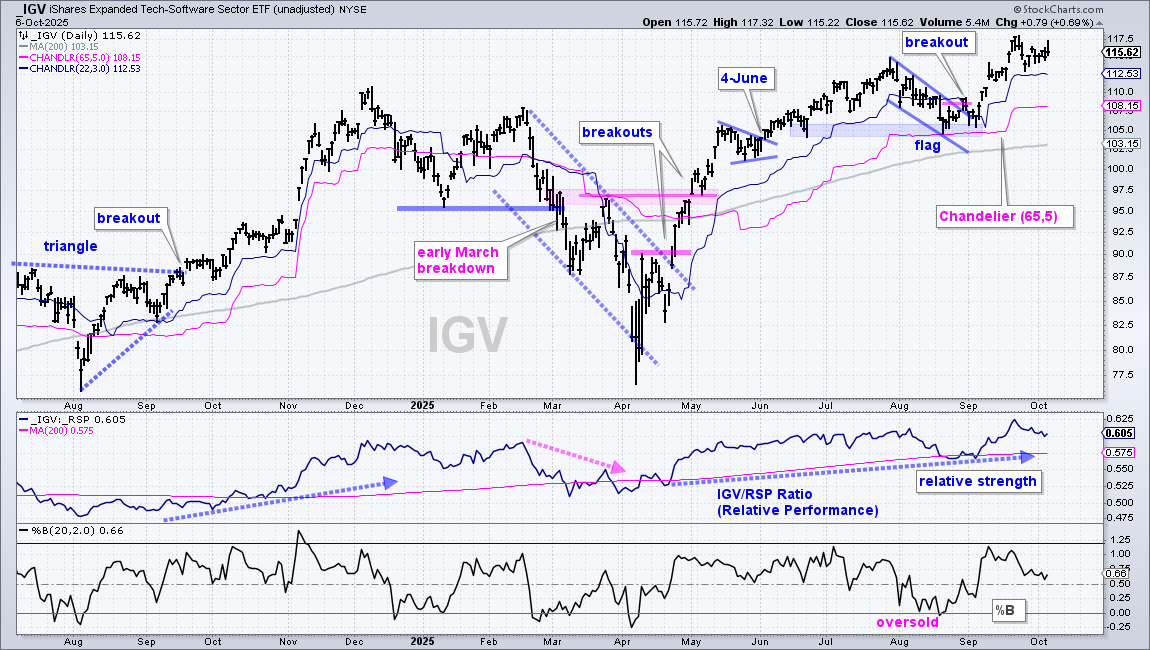
The Technology SPDR (XLK) and many tech-related ETFs are in the same boat. They consolidated into August, broke out in late August or early September and surged to new highs the last five weeks. They are in strong and leading uptrends, but I do not see any setups on the price charts. The setups were in August and the breakout signals have past. This means they are in the trend-monitoring phase. There is nothing to do here except monitor price action, wait for the next setups and consider an exit strategy.
The first chart shows the Technology SPDR (XLK) forming a pennant into August and breaking out in early September. XLK hit new highs the last few weeks and the price-relative (XLK/RSP ratio) also hit new highs (relative strength). There is nothing but uptrend and relative strength on this chart.
There are two Chandelier Exits on the price chart: one tight and one wide. Tight stops are for The Trader looking to lock in gains and exit on the first sign of weakness. The Chandelier Exit (22,3) represents the tight stop, which is 3 ATR(22) values below the 22-day high. Wide stops are for The Accumulator seeking to ride the trend and exit on an outsized decline. The Chandelier Exit (65,5) represents the wide stop, which is 5 ATR(65) values below the 65-day high.
The next charts show the leading tech ETFs with both Chandelier Exits for reference. The wide Chandelier Exit (65,5) is in pink and the tight Chandelier Exit (22,3) is in blue. As always, the key is the plan your exit ahead of time and then trade according to that plan. The choice of exit depends on your trading style.
DISCLAIMER: This content provided strictly for informational and educational purposes. It should not be interpreted as an offer to buy or sell any security, nor as a solicitation to engage in any investment activity. Nothing here constitutes a recommendation regarding any specific security, portfolio, transaction, or investment strategy.
At times, the author or affiliates may hold positions or interests in securities discussed. Any stocks or examples mentioned are not endorsements or suggestions to purchase. This material does not consider your individual financial goals or circumstances, and you should seek guidance from a qualified financial or investment adviser before making any trading or investment decisions.
Past performance does not guarantee future results.
Send feedback to support(at)trendinvestorpro.com or use the contact form.