")
The Industrials SPDR (XLI) and Finance SPDR (XLF) are two of the big six sectors in the S&P 500 and both are moving in the right direction: up.
The Industrials sector accounts for 9.32% of the S&P 500, while the Finance sector accounts for 13.02%. They are important sectors because of their size and because of what they represent. The Industrials sector represents the manufacturing side of the economy, while the Finance sector represent the banking system. Both are key parts of the economy and the S&P 500.
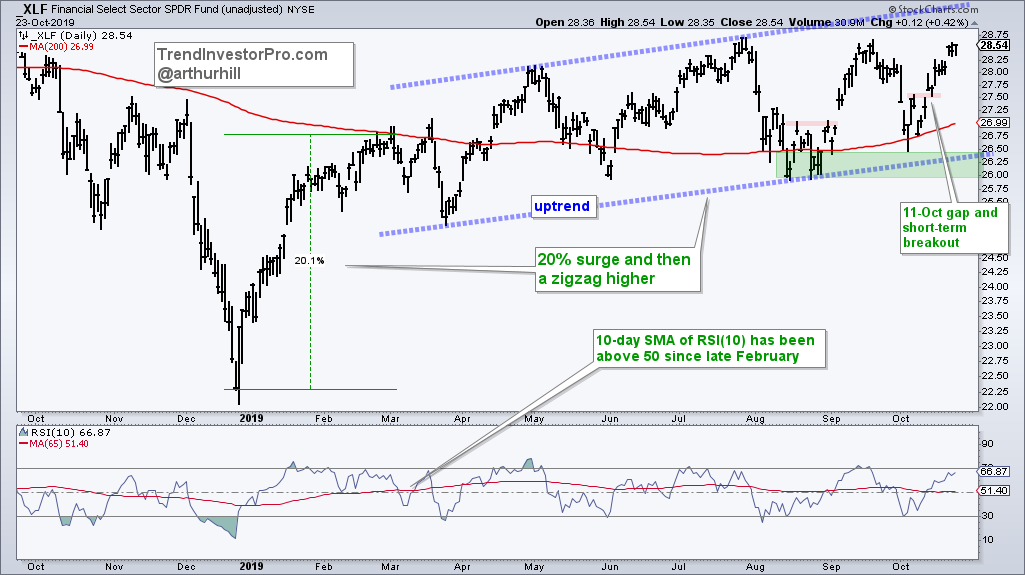
On the price charts, we can see both working their way higher since March. First, XLF surged some 20% from late December to late February. This was the rocket lifting off to start the uptrend. Prices have since moved higher in zigzag fashion with higher highs and higher lows. This, my friends, is what an uptrend is all about. Yes, I realize that XLF remains below its July high, but the blue channel lines are sloping up. In addition, price is above the 200-day and this moving average is turning up. The weight of the evidence is bullish.
The next chart shows XLI surging some 27% and then embarking on a zigzag higher. The ETF exceeded its spring high in September and has a series of higher lows over the last few months. The blue channel lines are not perfect, but they are sloping up and capturing this uptrend. In addition, price is above the 200-day SMA and the 200-day SMA turned up.

The short red horizontal lines mark short-term support levels, which were broken with the gap-surge off support on October 11th. These breakout gaps held, the short-term trend is up and the bigger trend is up. I, therefore, would expect higher highs from both in the coming days and weeks. A close below the 11-Oct gap zones (10-Oct close) would call for a re-evaluation.
Geared towards the weekend trader or investor,
our Premium content includes:
- Systematic ETF rankings for trend-momentum strategies (Thursdays)
- ChartBook with 60 core ETFs (Thursdays)
- Proprietary index and sector breadth models for market timing (Fridays)
- Stock setups and chart analysis (Saturdays)
- Weekly video analysis and commentary