Stocks moved sharply higher for the second straight week with broad participation. RSP, SPY and QQQ recorded 52-week highs, 8 of the 11 sector SPDRs recorded new highs and 8 of the 11 equal-weight sector ETFs hit new highs.
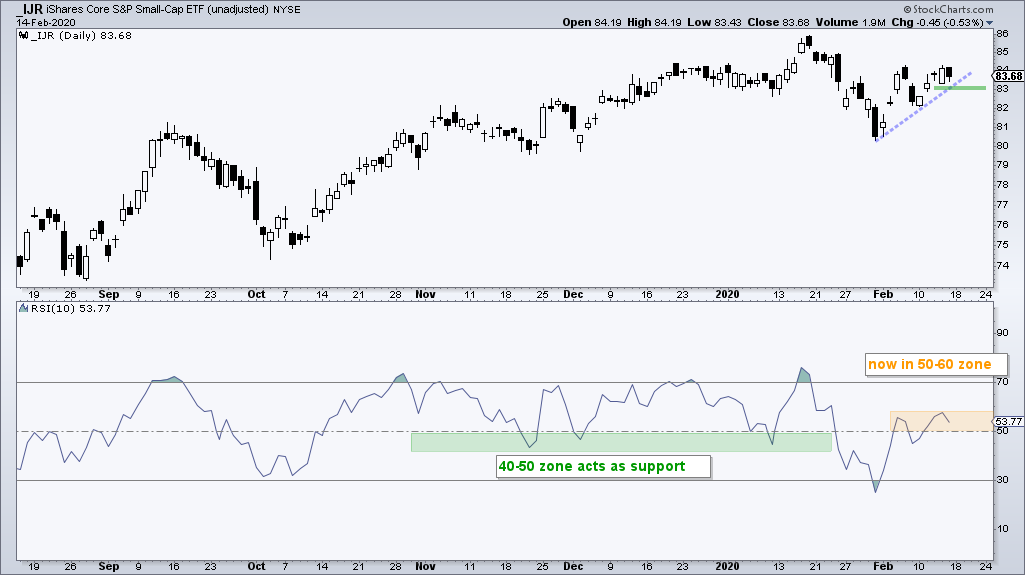
Small-caps are still lagging as IWM and IJR did not hit new highs and only one small-cap sector hit a new high (PSCU).
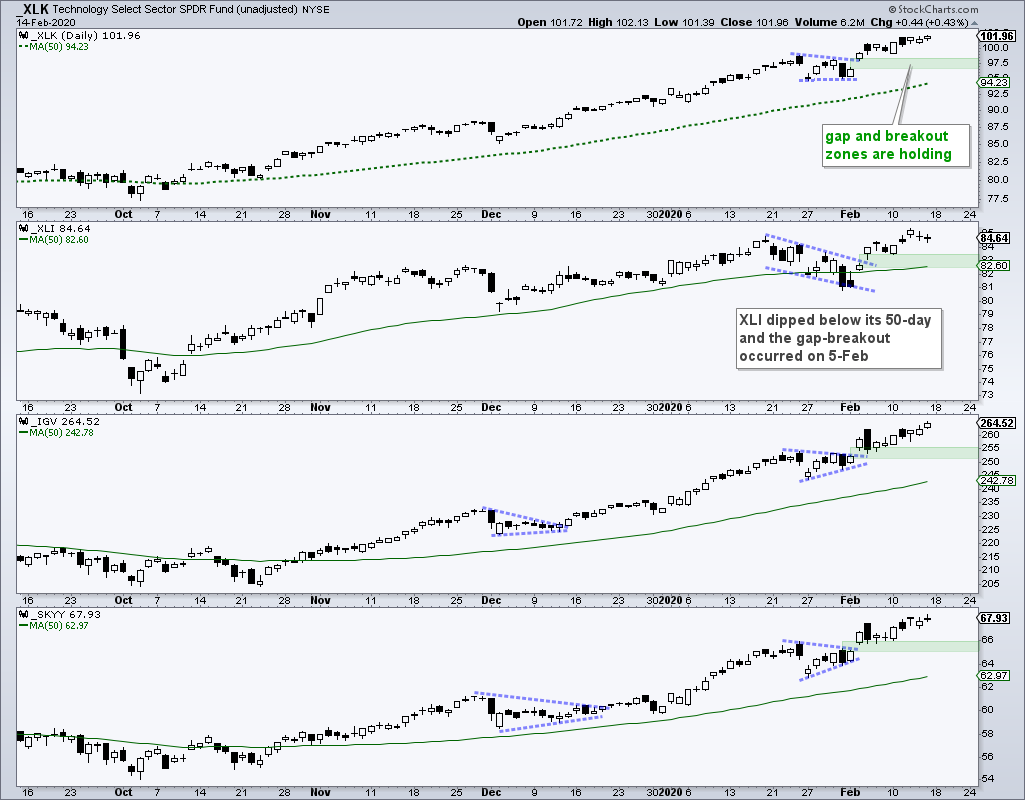
The tech-related ETFs extended further on their flag and pennant breakouts with new highs in QQQ, XLK, SKYY, FINX and IPAY. The gap and breakouts zones turn first support to watch on a throwback.
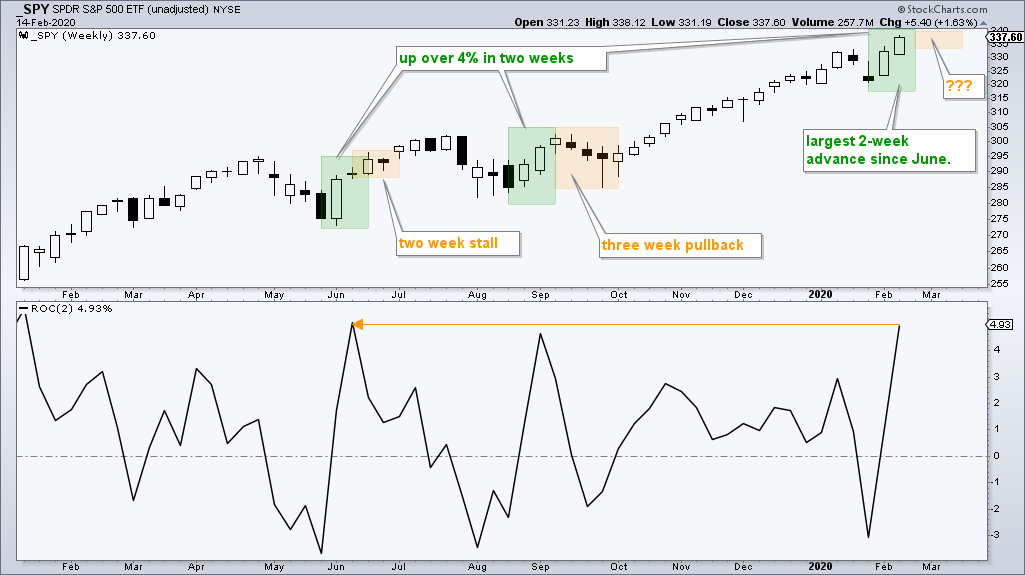
SPY is up 4.93% in the last two weeks and this is the largest two-week advance since the first half of June. The June surge ended the May correction and led to a new high. The current two week surge comes after a two week pullback. With this bounce, SPY established support in the 320 area. A break here would forge a lower low and signal the start of a corrective period.
Mind the Gaps
XLI, XLK, SKYY and IGV are holding their gap and breakout zones. These are the first levels to watch for support on a short pullback. A close below the green zones would be negative because the breakouts failed.
Careful with Bearish Thoughts, but....
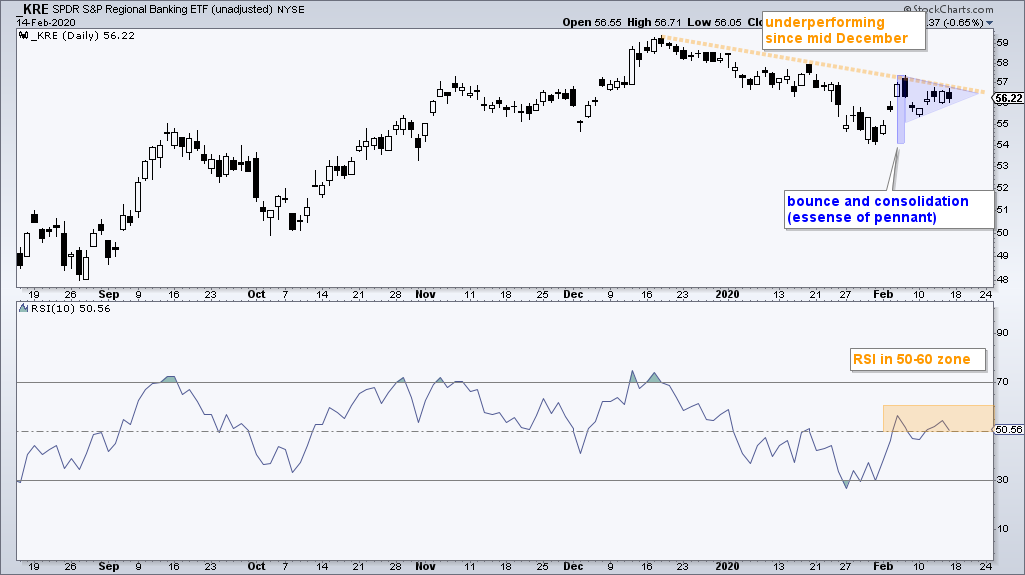
Thinking bearish thoughts in a bull market can be dangerous. Having said that, the S&P SmallCap 600 SPDR (IJR), Regional Bank ETF (KRE), Bank SPDR (KBE) and Retail SPDR (XRT) are hitting a moment of truth. First, they are all underperforming because they have yet to exceed their December-January highs. Second, RSI(10) is in the 50-60 zone, which could act as momentum resistance. On the chart below, notice how the 40-50 zone acted as momentum support from November to January. A break below 83 in IJR would be short-term negative.
Regional Bank ETFs Hits Moment of Truth
The Regional Bank ETF (KRE) looks like it could go either way. The ETF got a modest mean-reversion bounce in early February and then stalled the last seven days. This surge-stall formed a pennant type pattern and a breakout would be bullish. Finance is the second largest sector in IWM (17.5%) and in IJR (17.6%). Thus, the next directional move in smaller banks will affect small-caps.
The Finance SPDR (XLF) is also consolidating near its highs with a possible bull flag.
The Consumer Staples SPDR (XLP) and Dividend Appreciation ETF (VIG) extended their steady uptrends with new highs this week.
Rate-Sensitive ETFs Remain Strong
Bond proxies were strong this week with the Utilities SPDR (XLU) breaking out of a pennant and the Real Estate SPDR (XLRE) surging 6.76% the last two weeks. The Home Construction ETF (ITB), which is also rate-sensitive, moved sharply higher the last two weeks (+5%). ITB is also the fourth best performing ETF in the core list this year (+12.31%). The chart below shows TLT and AGG with pennants forming above the breakout zones.
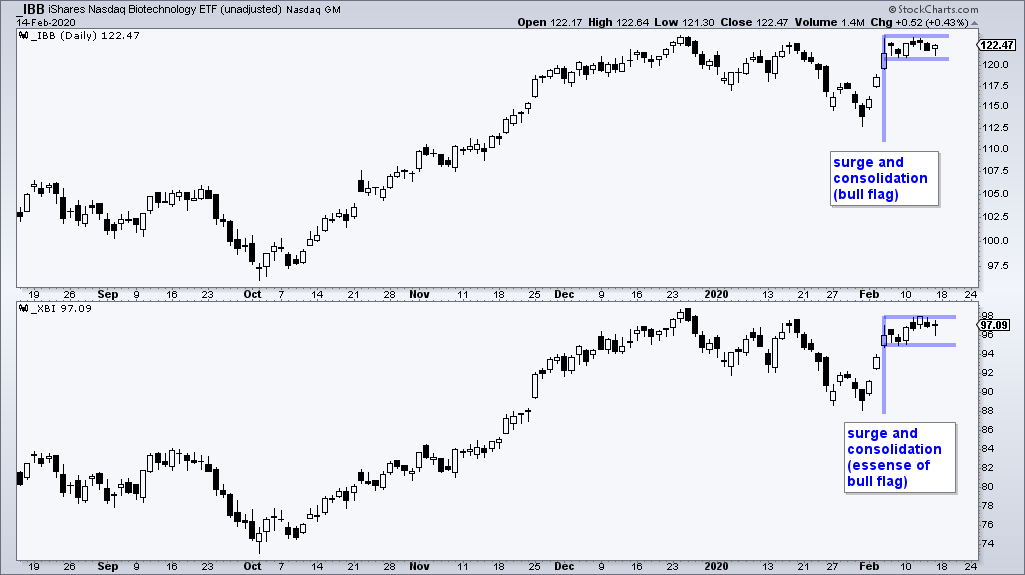
IBB Forms High and Tight Flag
The Biotech ETF (IBB) surged to its December-January highs and stalled the last seven days. A surge and flat consolidation is a bull flag, which is a bullish continuation pattern. Watch for a breakout.
The Medical Devices ETF (IHI) held its flag breakout and continued higher with a 2.5% bounce this week.
The Gold Miners ETF (GDX) broke out in late December and then moved into a trading range. A possible triangle is forming as the ETF finds support in the 27.5-28 area. Watch 28.7 for a breakout within the triangle.
Forget about Inter-market Relationships
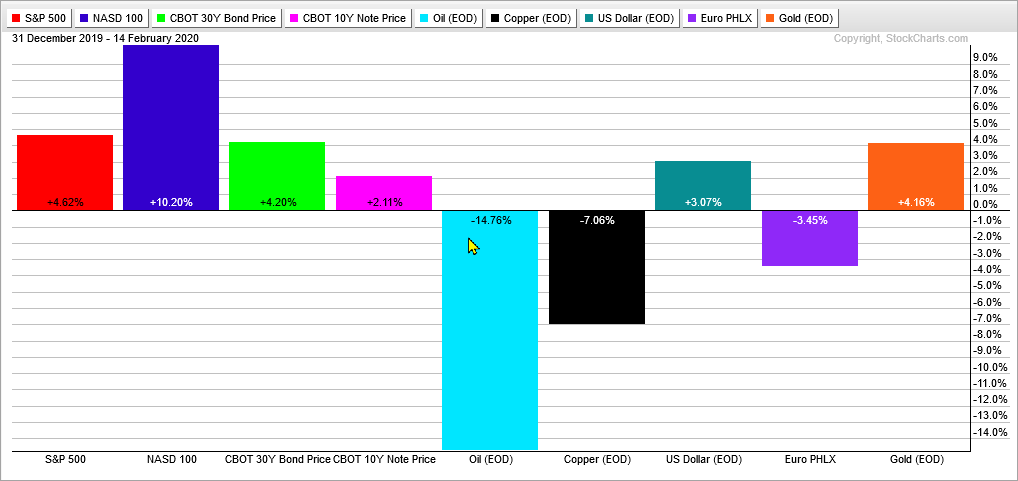
There are strange happenings in the inter-market arena. The US Dollar Index ($USD) is up 3% this year and Spot Gold ($GOLD) is up 4%. The S&P 500 SPDR (SPY) is up 4.89% and the 20+ Yr Treasury Bond ETF (TLT) is up 6.87%. Risk assets (stocks) and safe-haven assets (bonds) are moving higher. Mean-while, oil is down over 10% and copper is down around 7% this year. Inter-market stuff is “interesting”, but I gave up trying to trade based on correlations and connections a long time ago. It is usually best to simply watch the price chart of the asset of interest and forget about fickle relationships.
")