The major index ETFs are in clear uptrends with the big three hitting new highs again this week (SPY, QQQ, IWM). We also saw 52-week highs in three of the eleven sector SPDRs (XLK, XLC and XLY). These three were leading throughout 2020 and they continue to lead in 2021. XLI, XLV and XLF are close to 52-week highs so I will no read too much into this short-term non-confirmation. In any case, XLK, XLC and XLY account for well over 50% of the S&P 500.
The bulk of the evidence remains bullish for stocks. The only uncertainty is that stocks are looking extended and ripe for a corrective period. Price-wise, the major index ETFs surged the first week of February and then stalled this week. We have yet to see any kind of reversal on the charts, but I will show what to watch for next week. We are seeing some deterioration in short-term breadth (%Above 50 and 20 day SMAs). In addition, SPY ended its streak of RSI days above 50 and February is a coin flip when it comes to seasonal patterns. Note that February has been positive 55% of the time over the last twenty years and the average gain was a loss (-.6%). Click here for the report on seasonal patterns since 1950. Elsewhere, the Fed balance sheet ticked higher this week and junk bond spreads narrowed again as oil surged in February.
SPY, QQQ and IWM Hit New Highs
RSI: Consecutive Days Above 50
Trend and Thrust Breadth Models
Trend Models
Thrust Models
You can learn more about the methodology and historical performance for these breadth models in this article.
Do Sector Breadth Signals add Tangible Value?
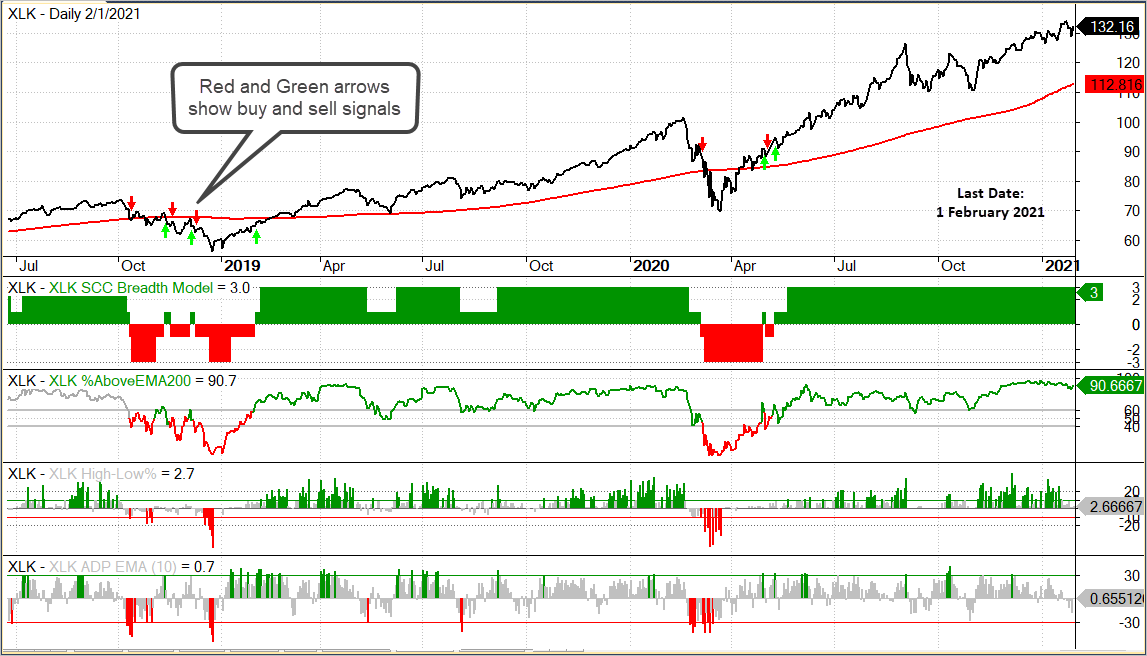
Before going through the signals, I will preview an upcoming article on the sector breadth models. I was able to recreate the sector breadth indicators in Amibroker (historical constituents) and backtest them over the last twenty years. The breadth indicator values are not exactly the same as those from StockCharts, but the indicator values/signals line up pretty well. The chart below shows XLK with its breadth model, the three indicators and the signals up to February 1st.
Breadth indicators and signals seem logical, and we can always find signals that worked well in the past. However, we never know the true value of a strategy until we actually quantify it with a backtest.
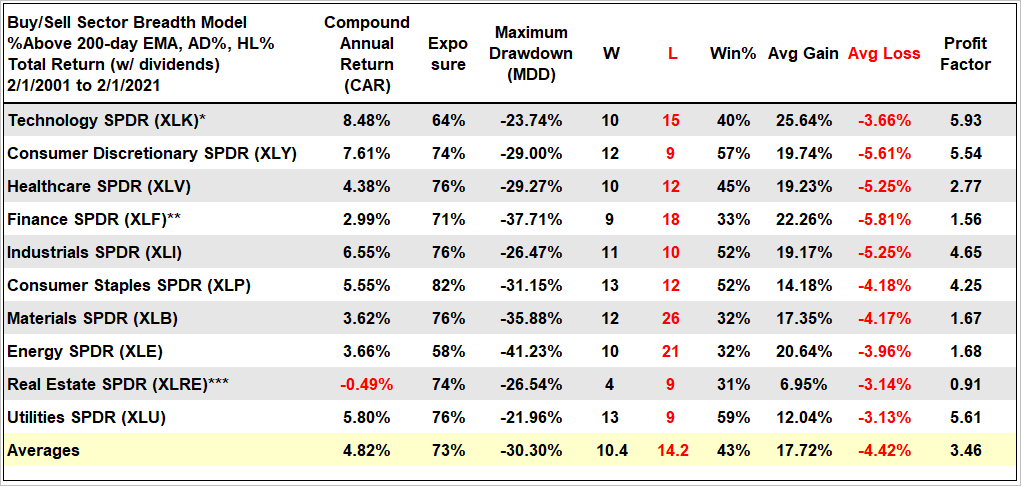
Overall, the results were less than inspiring and StochClose signals performed better overall. Results were best for the Technology, Consumer Discretionary, Industrials, Consumer Staples and Utilities sectors. Results were well below average for the Finance, Materials, Energy and REIT sectors. Thus, take these signals with a heap of salt. The table below details the results. Note that Profit Factor is the total Dollars from wins divided by the total Dollars from losses. A Profit Factor above 2 is the minimum.
In contrast to the broad market breadth indicators and signals, I have having serious doubts on the value of the sector breadth signals. Sure, they are interesting to analyze, but do they add tangible value to timing and profits? Put another way: can we generate better returns with simpler timing indicators that are based on price (StochClose signals, moving average crossovers, XX day highs)?
")