
")

SPY Hits Key Moment as Breadth Signal Triggers – Yield Spreads Channel March 2025
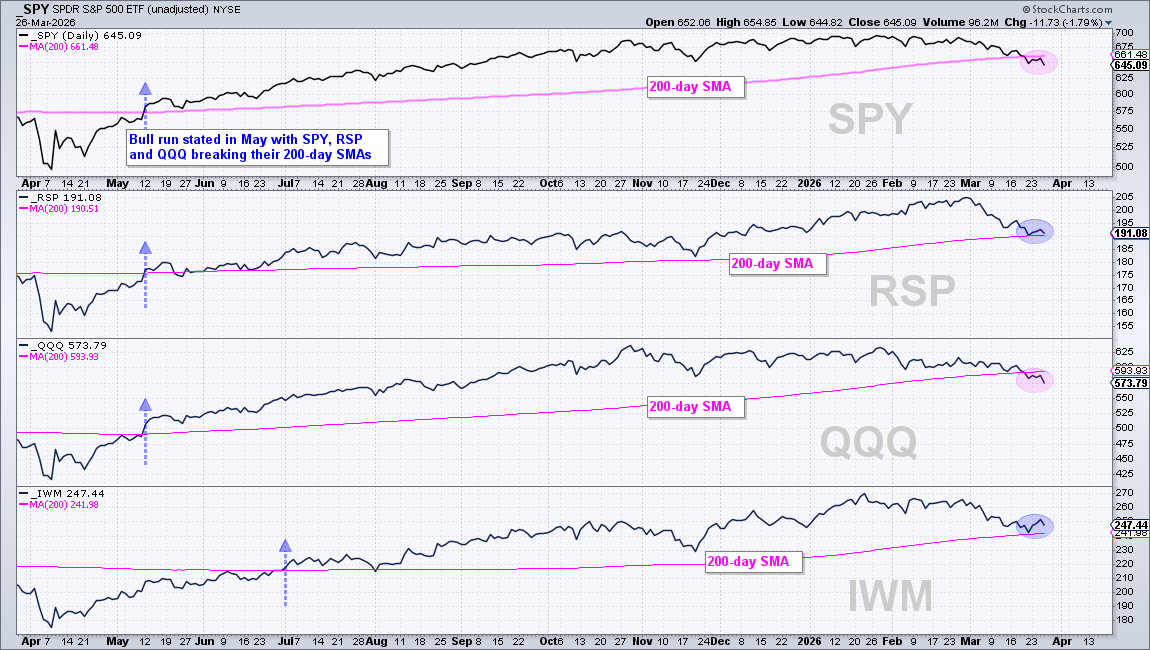
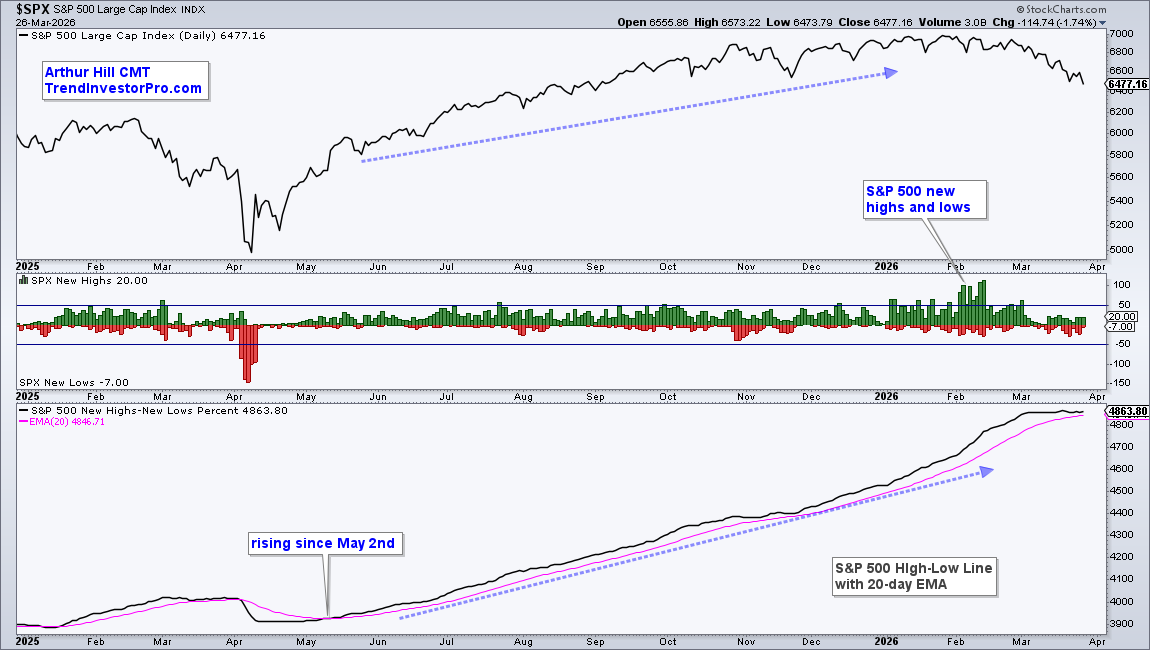
SPY is at a moment of truth as breadth deteriorates and stress increases in the credit markets. SPY, QQQ and IWM remain in long-term uptrends, but
SPY Hits Key Moment as Breadth Signal Triggers – Yield Spreads Channel March 2025 Read More »