Market and ETF Report – A Mixed Market Overall, Risk-On Groups Outperforming, 2022 Leaders a Correcting (Premium)

2023 is starting with a bang as the high-beta groups outperform. High-beta groups are the same as risk-on groups and offensive groups. The 2022 leaders, in contrast, are lagging this year. Defensive and risk-off ETFs are in this group. It is still early to suggest a major shift in the stock market and some key ETFs are nearing their make or break levels (SPY, QQQ, XLK). Elsewhere, the energy ETFs are holding their breakouts, XLV has a bullish pullback, Base Metals are looking extended and gold is still frothy.
About the ETF Trends, Patterns and Setups Report

This report contains discretionary chart analysis based on my interpretation of the price charts. This is different from the fully systematic approach in the Trend Composite strategy series. In this ETF Trends, Patterns and Setups report, I am looking for leading uptrends and tradable setups within these uptrends. While I use indicators to help define the trend and identify oversold conditions within uptrends, the assessments are mostly based on price action and the price chart (higher highs, higher lows, patterns in play). Sometimes the chart assessment can be at odds with the indicators.

Report Schedule

  • Tuesday – 24 Jan: Market/ETF Report and Signal/Rank Table
  • Wednesday – 25 Jan: Market/ETF Video and Signal/Rank Table Update
  • Thursday – 26-Jan: Mean-Reversion Setup Table and Signal Tracker
  • Thursday – 26 Jan: ETF Signal/Rank Tab

Mean-Reversion Strategy

I will publish part 4 of the mean-reversion strategy on Thursday. There were no new setups on Monday or Tuesday. Four of the five setups from Friday (XLI, PPA, SDY, PBJ) did not hit their buy limits. The S&P 500 Low Volatility ETF (SPLV) hit its buy limit on Friday. The Consumer Staples SPDR (XLP) had a setup on Wednesday and hit the buy limit on Thursday. An exit signal will trigger when RSI(2) crosses above 70, the eSlope crosses below 10 or the trade is five days old (stale exit). Here are the strategy articles for reference: Part 1, Part 2 and Part 3.

CBM is Negative

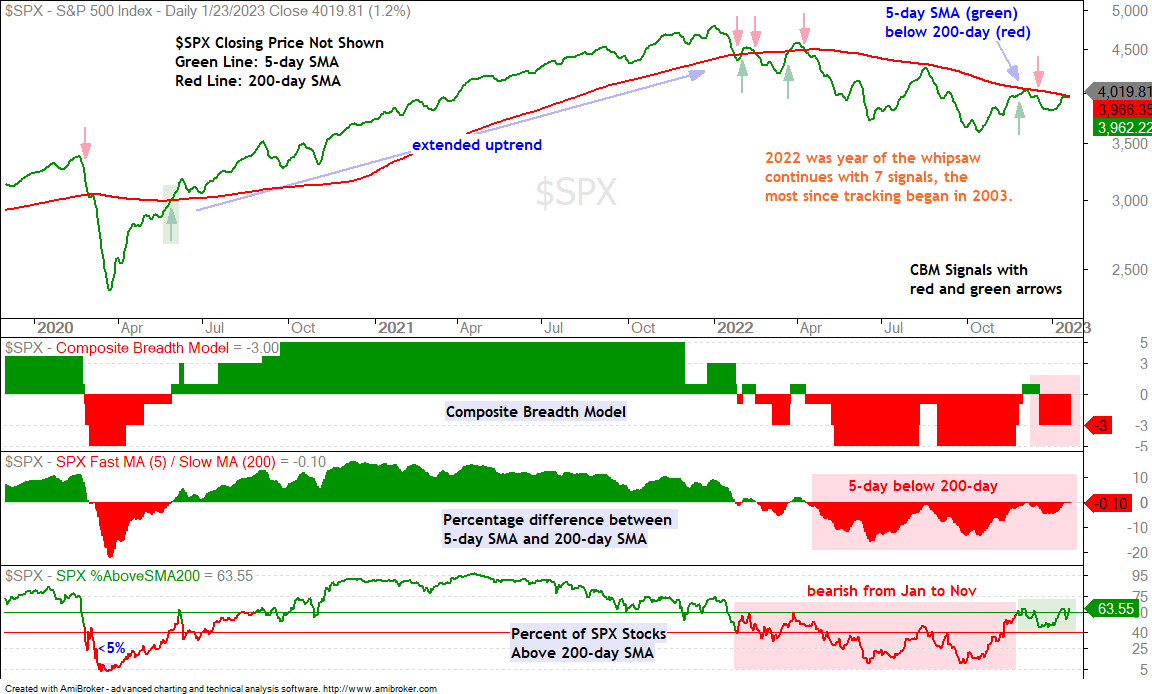
The Composite Breadth Model remains at -3 and bearish. Even so, the percentage of stocks above the 200-day SMA remains relatively strong for the major indexes (S&P 500 63.55%, Nasdaq 100 58.42%, MidCaps 68.08%, Small-Caps 56.86%). In addition, yield spreads peaked in mid October and narrowed the last few months. They remain narrow and we have yet to see signs of stress in the credit markets. The stock market is quite mixed at the moment. Note that I will update the Market Regime page tomorrow.

SPY Surges towards Resistance

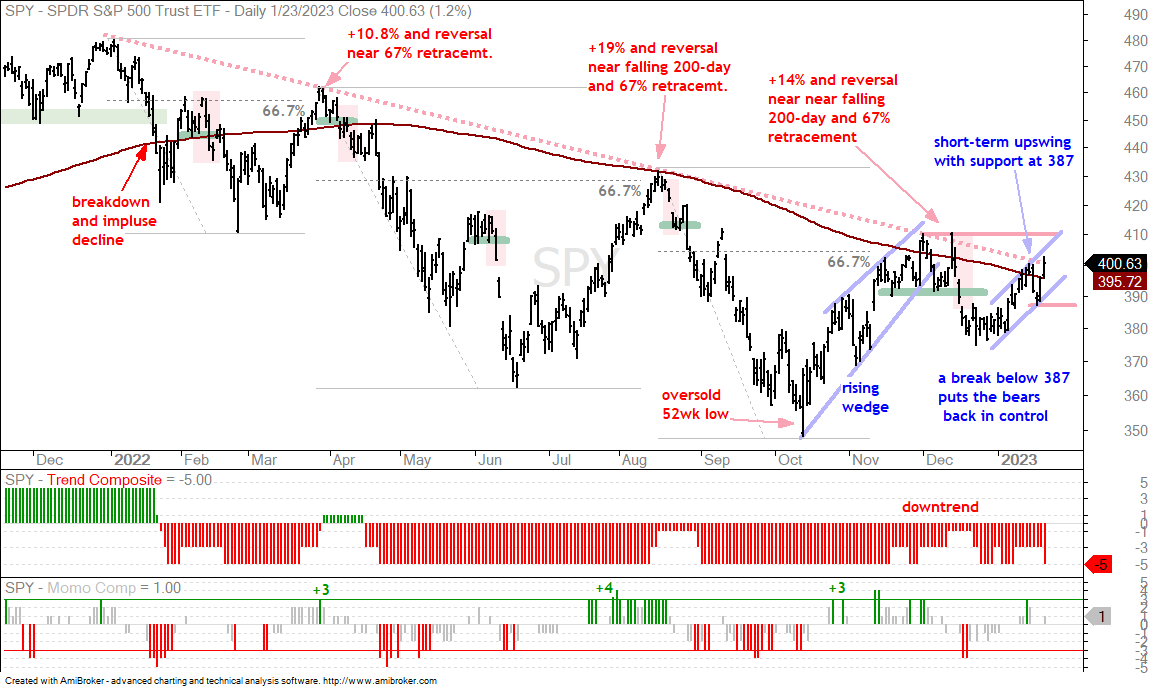
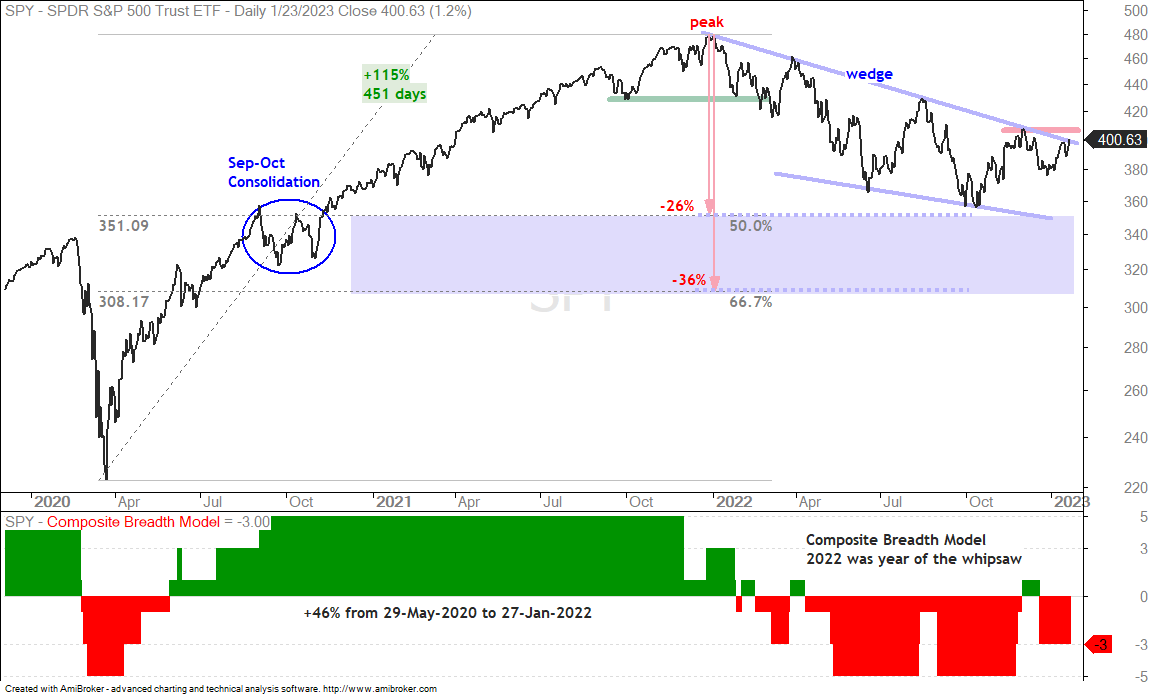
As noted last week, the S&P 500 SPDR (SPY) is at a moment of truth. Either it fails in the 400-410 area and continues its downtrend or it breaks through 410 and the Composite Breadth Model turns positive. Some indicators in the CBM are very close to turning bullish and a push above 410 would likely turn them bullish.

The chart below shows a massive advance into January 2022 (+115%) and an extended decline the rest of the year. The long-term trend is down with a big falling wedge taking shape. Technical analysis is fractal, which means patterns and setups are valid on any timeframe. A falling wedge that retraces one to two thirds of the prior advance is deemed a correction on any timeframe.

Notice that this wedge retraced around half of the prior advance. The falling wedge is typical for a corrective pattern and 50% is the base case for a retracement. Charles Dow noted that corrections retrace one to two thirds of the prior advance with half being the base case. Think of it as two steps forward and one step backward. A close above 410 would break wedge resistance and reverse the long-term downtrend.

SPX %Above 20 and 50 Day SMA

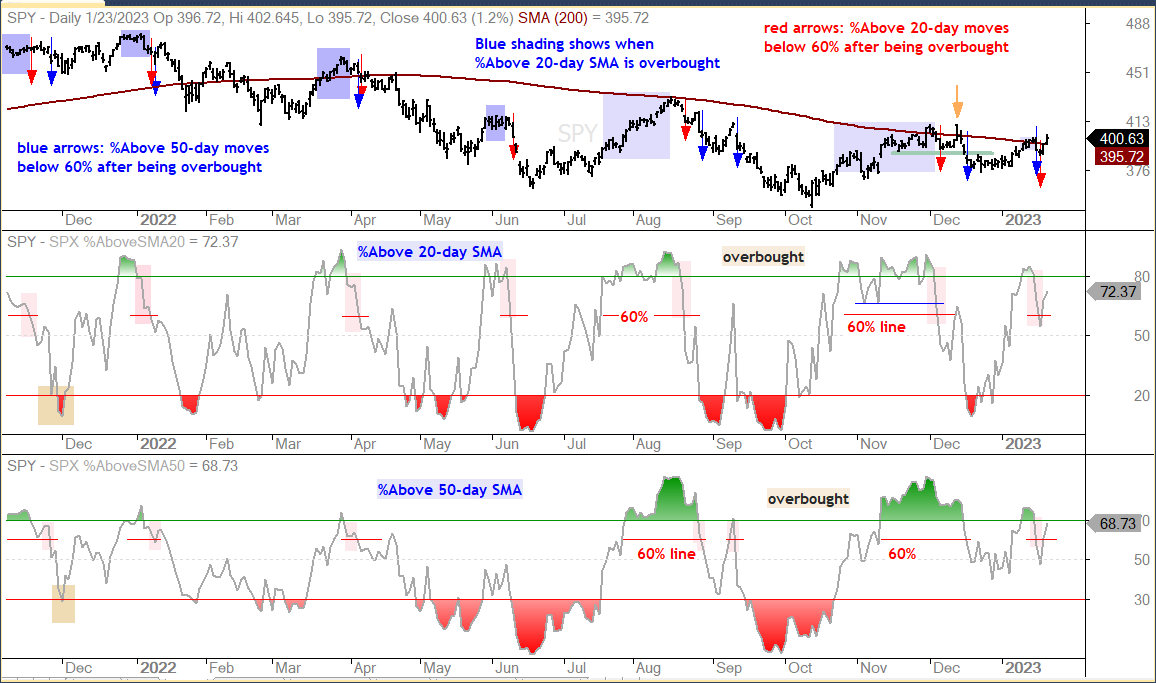
The percentage of S&P 500 stocks above the 50-day SMA and 20-day SMA became overbought in mid January and triggered bearish on the 18th (blue arrow) and 19th (red arrow), respectively. SPY promptly answered with a 3% surge the next two days. Betting against the bulls is a dangerous game.

Note that %Above 20-day SMA triggered bearish on December 6th and SPY surged back to its 200-day SMA a few days later (yellow arrow). I would consider the current signal valid as long as %Above 20-day SMA remains below 80% and %Above 50-day SMA remains below 70%. These are the overbought levels and a push back above these levels would show strength.

A Short-term Upswing for SPY

The Composite Breadth Model is negative, but the %Above 200-day SMA indicators are fairly strong and yield spreads are falling. Long-term, SPY is at its moment of truth with resistance from the falling wedge and November-December highs at hand. Short-term, I will be watching support at 387.

SPY broke wedge support in mid December and rebounded the last four weeks. The bulls have the edge as long as this short-term upswing holds. A break below 387 and lower high from December to January would show that this was a counter-trend bounce after the mid December breakdown. A breakdown at 387 would also align the short-term downtrend with the long-term downtrend. It has yet to happen, but this is what to watch.

Tech and Staples Tell the Story

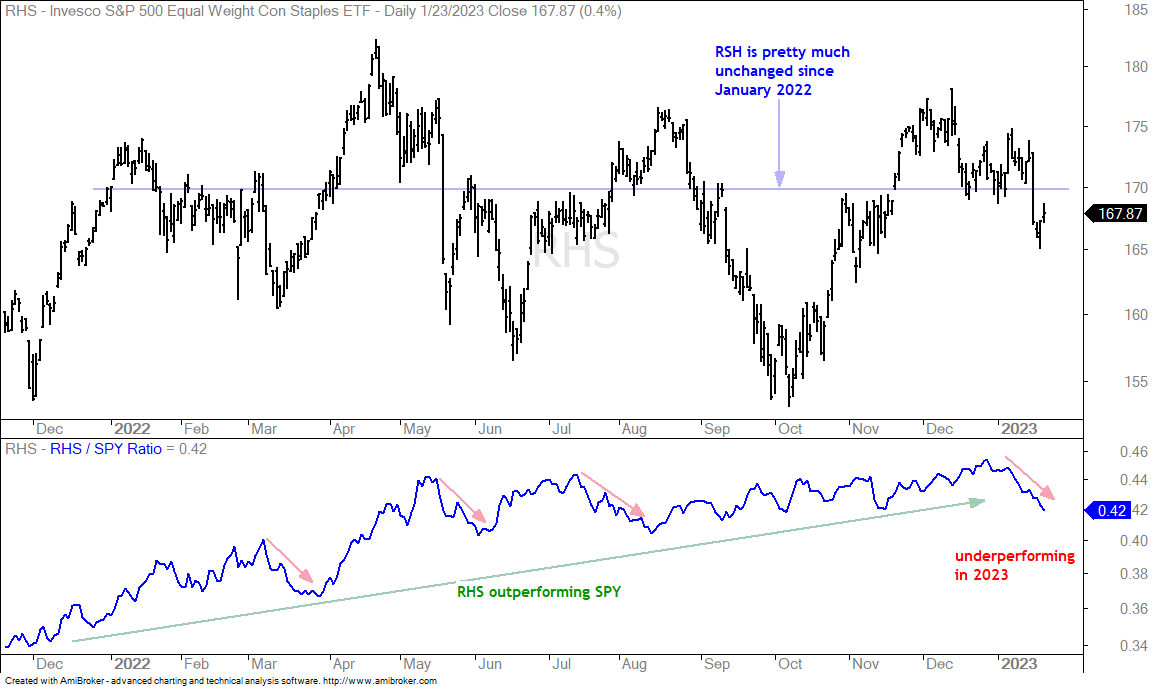
The EW Technology ETF (RYT) and the EW Consumer Staples ETF (RHS) reflect the market shift from risk-off to risk-on over the last four weeks. I prefer the equal weight sector ETFs when making sector and market assessments because they reflect performance for the “average” stock in the sector. The first chart shows RHS in a trading range the last 12 months. The indicator window shows RHS outperforming SPY because it traded flat when SPY decline (relative strength). There were some short-term bouts of underperformance along the way (red lines). Most recently, RSH peaked in mid December and fell sharply last week. This defensive (risk-off) sector is underperforming in 2023 as money moves out.

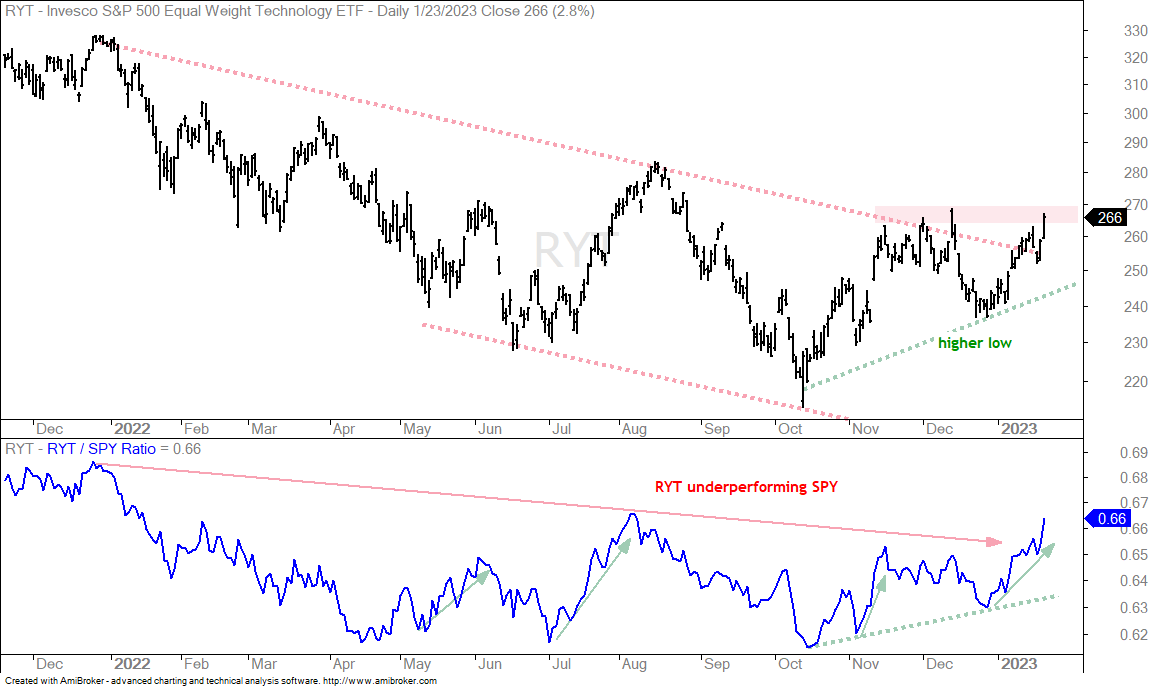
The next chart shows the RTY in a downtrend from late December 2021 to October 2022 (52-week low). This trend could reverse as a higher low formed from October to December. RYT is challenging the November-December resistance zone and a breakout here would forge a higher high. The indicator window shows the price-relative falling throughout 2022 with a few short-term bouts of relative strength (green arrows). The price-relative surged the last five weeks as RYT outperformed SPY and this shows a stronger risk appetite for stocks (risk on).

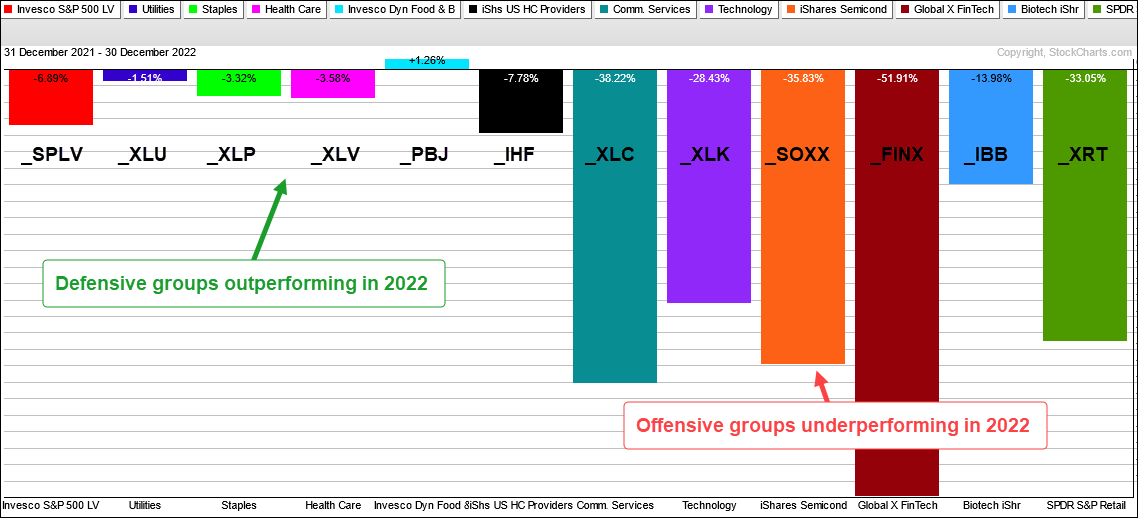
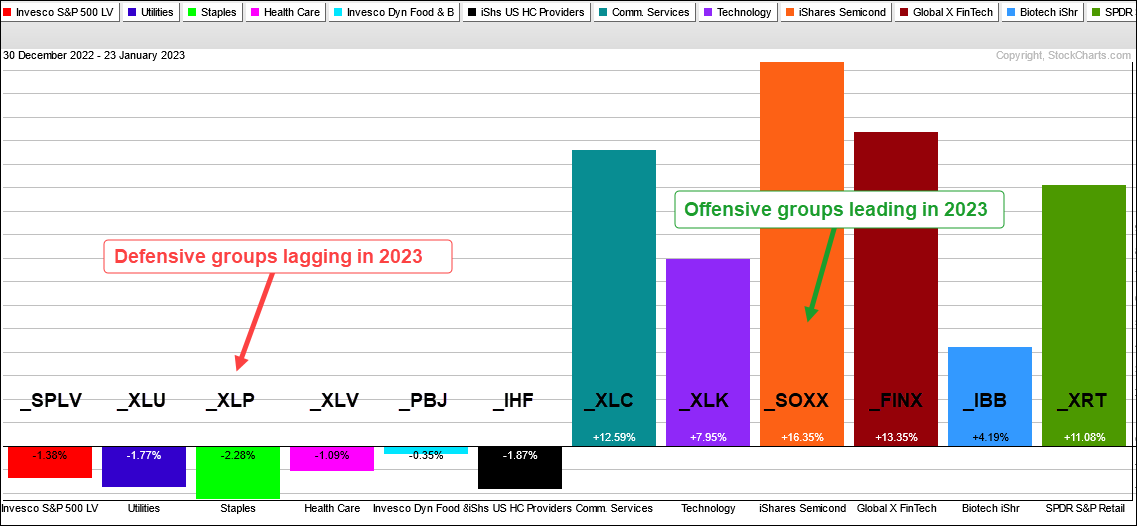
2023 Leaders were Laggards in 2022

The 2023 shift away from defense is noticeable when looking at other defensive groups. The S&P 500 Low Volatility ETF (SPLV), Utilities SPDR (XLU), Consumer Staples SPDR (XLP), Healthcare SPDR (XLV), Food & Beverage ETF (PBJ), Healthcare Providers ETF (IHF) and Aerospace & Defense ETF (PPA) are all down year-to-date.

These ETFs were leading at the end of 2022. On the flipside, the offensive groups are leading this year. These include the Communication Services SPDR (XLC), Technology SPDR (XLK), Semiconductor ETF (SOXX), FinTech ETF (FINX), Biotech ETF (IBB) and Retail SPDR (XRT).

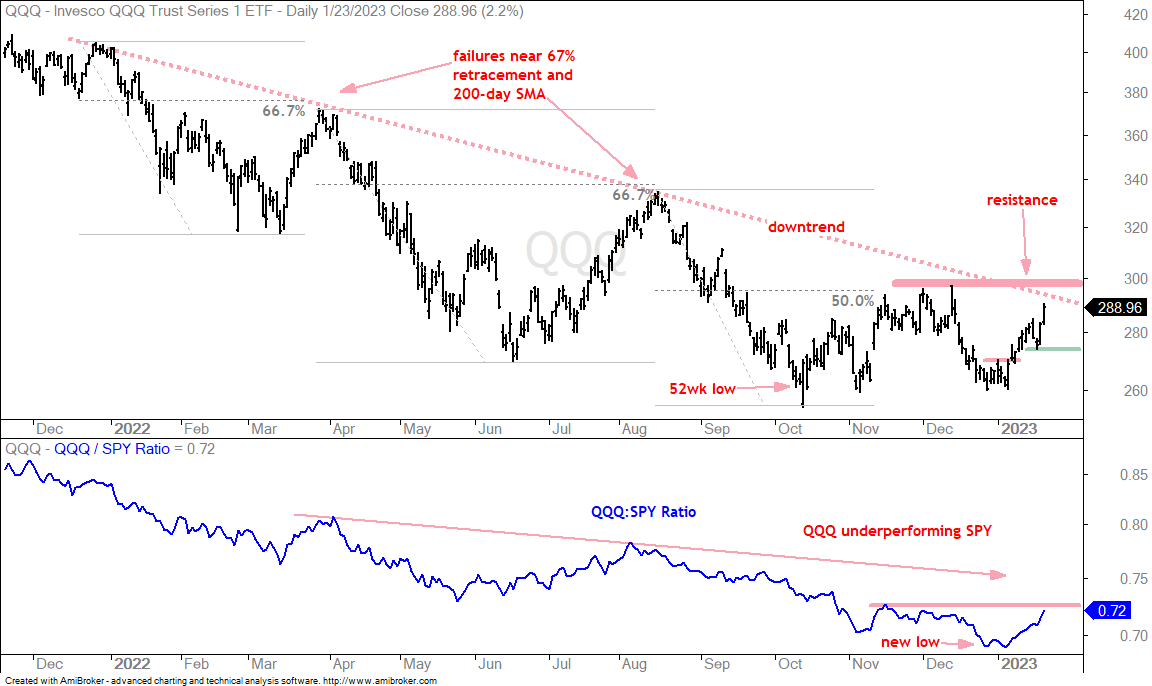
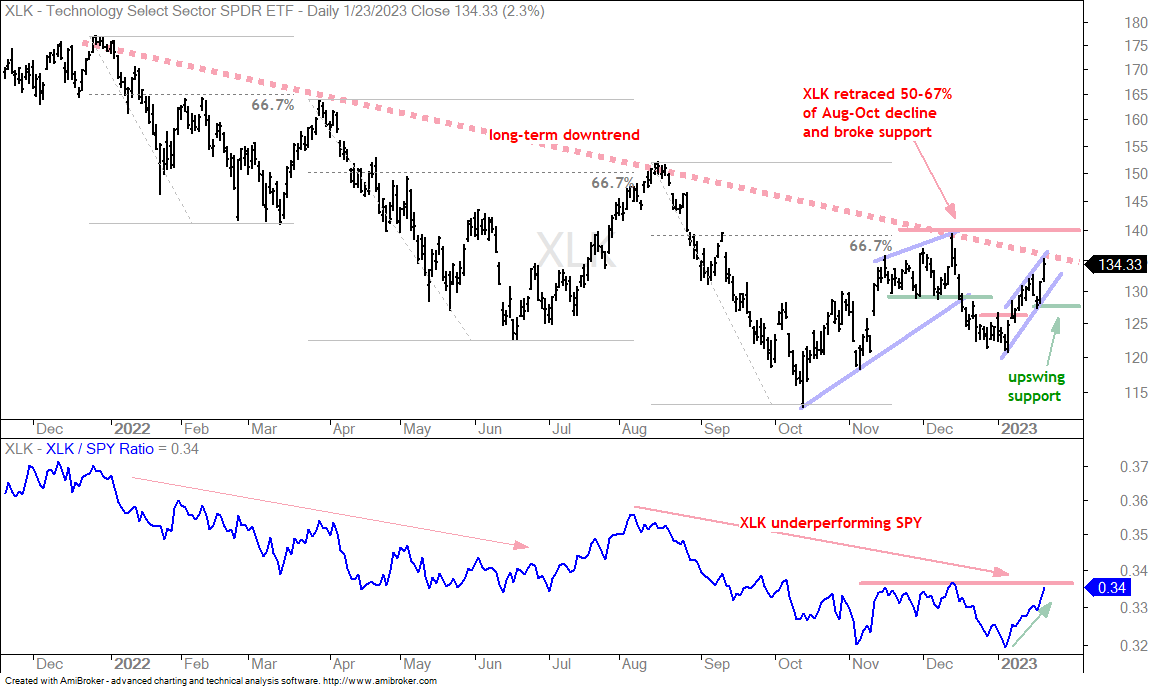
QQQ and XLK are Still in Long-term Downtrends

The next chart shows the Nasdaq 100 ETF (QQQ) in a long-term downtrend overall. The ETF found support in the 26 area from October to January and surged this month, but remains short of a trend-reversing breakout at 300. The ETF is up around 10% in 11 days and getting overextended. I would not chase an overbought bounce when the trend is still down. Show me the breakout first and I will then wait for a tradable pullback. The indicator window shows the price-relative in a downtrend and short of a breakout that would show a return to relative strength.

The next chart shows the Technology SPDR (XLK) in a downtrend with resistance marked at 140. The price-relative is also in a downtrend and nearing the December high, a break of which would show relative strength. I am watching upswing support at 127, a break of which would signal a reversal.

Semiconductor ETF Breaks December High (SOXX)

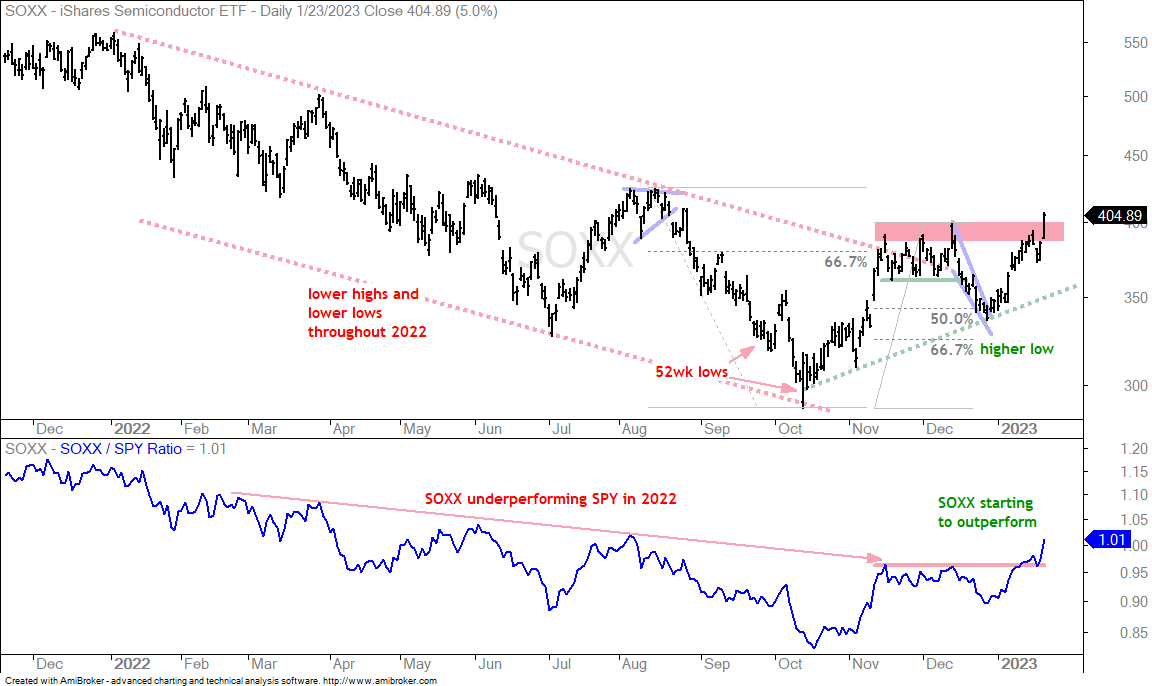
The Semiconductor ETF (SOXX) is leading with a break above the December high and a breakout in the price-relative. The chart shows SOXX with a higher low from October to December and now a higher high with the surge above 400 (red shading). The SOXX:SPY ratio also broke above its November-December highs. SOXX is leading since October and showing relative strength.

Wedge Breakout within Downtrend for Cybersecurity ETF (CIBR)

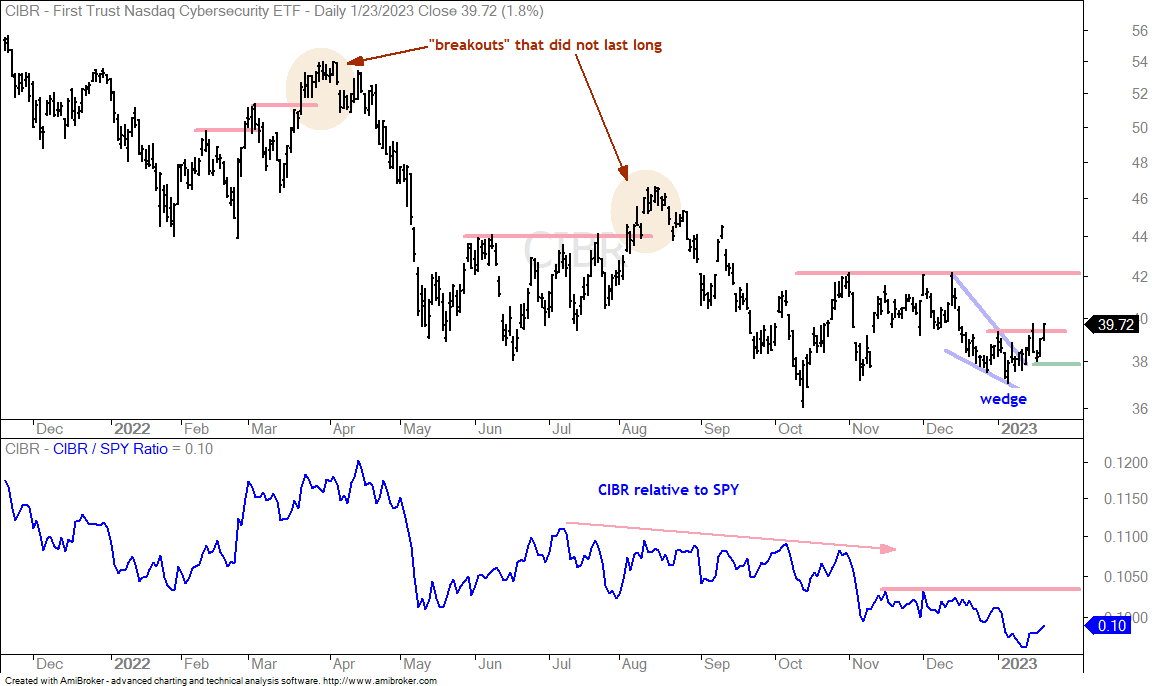
The next chart shows the Cybersecurity ETF (CIBR) with a falling wedge into early January and a breakout on Monday. This is a breakout within a bigger downtrend and its success depends on continued leadership from risk-on ETFs, Risk is well defined because a close below 38 would negate the breakout.

Software ETF Challenges December High (IGV)

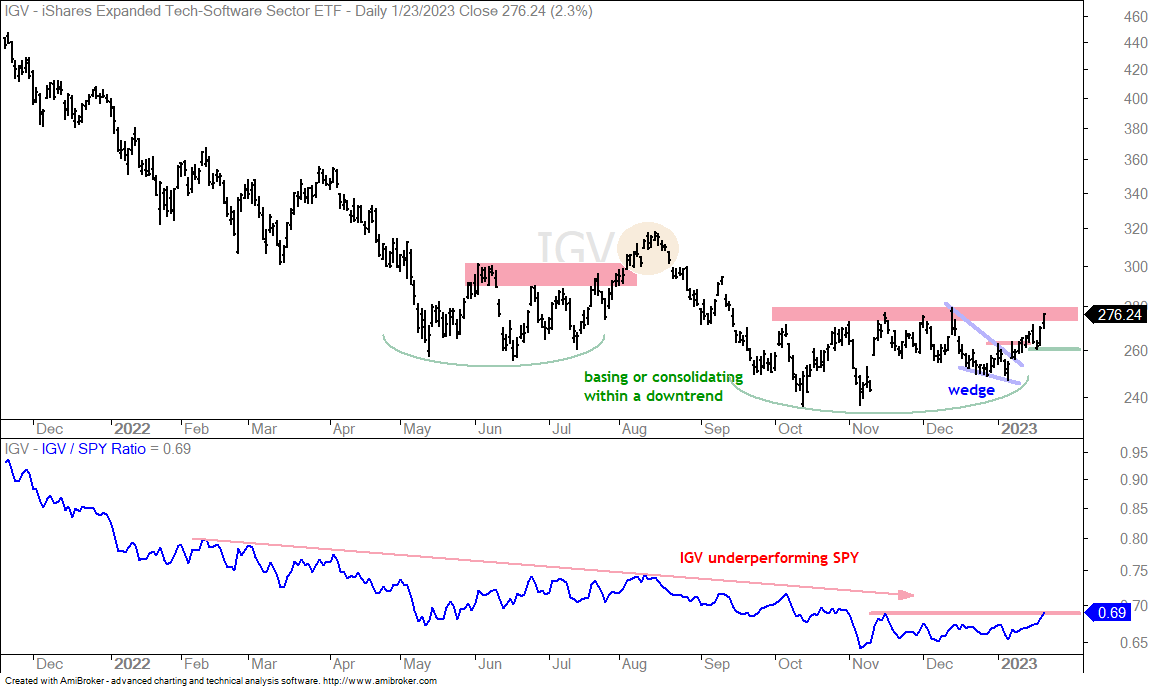
The next chart shows IGV with a wedge breakout on January 12th and follow through towards the resistance zone. The wedge was the tradable setup and the breakout was the signal. IGV is now near a bigger resistance zone and I do not see a setup with well-defined risk. As with many tech-related ETFs, the ETF firmed from October to December and turned up in January. We saw something similar from May to July, but the August breakout did not hold (yellow shading).

Wedge Correction for the Healthcare SPDR (XLV)

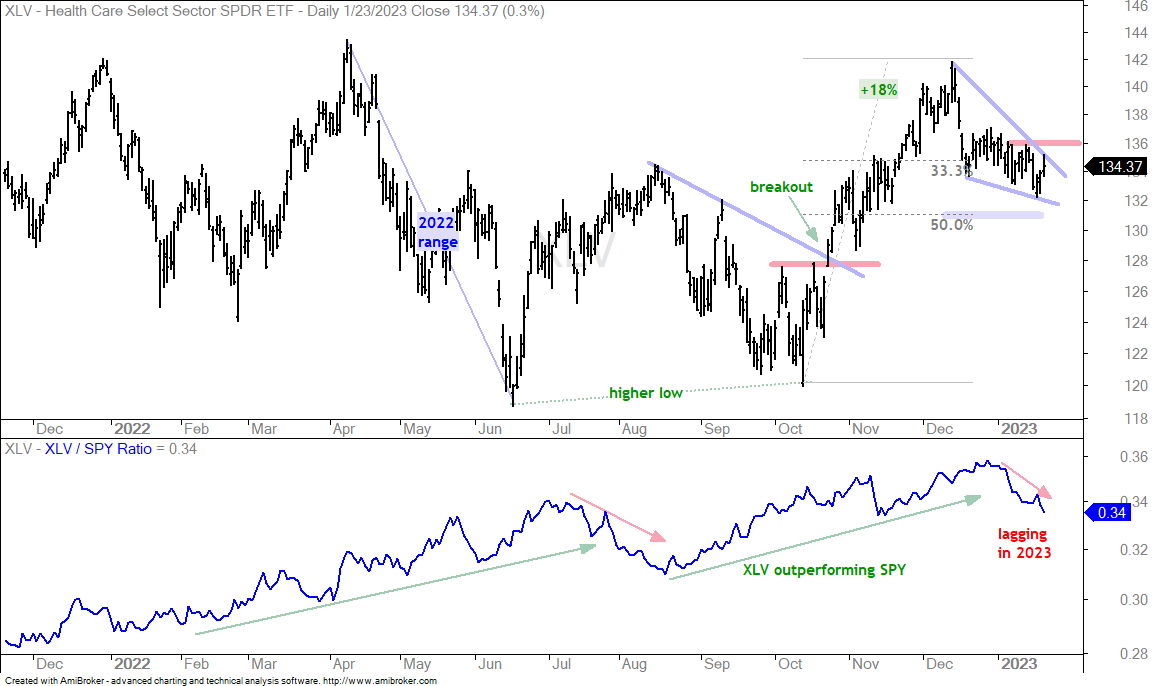
The Healthcare SPDR (XLV) is part of the risk-off group and underperforming here in January. Even so, the falling wedge since early December is considered a pullback within a bigger uptrend. XLV was overbought after the 18% surge and this wedge worked off these overbought conditions. A breakout at 136 would signal an end to the correction and a resumption of the uptrend.

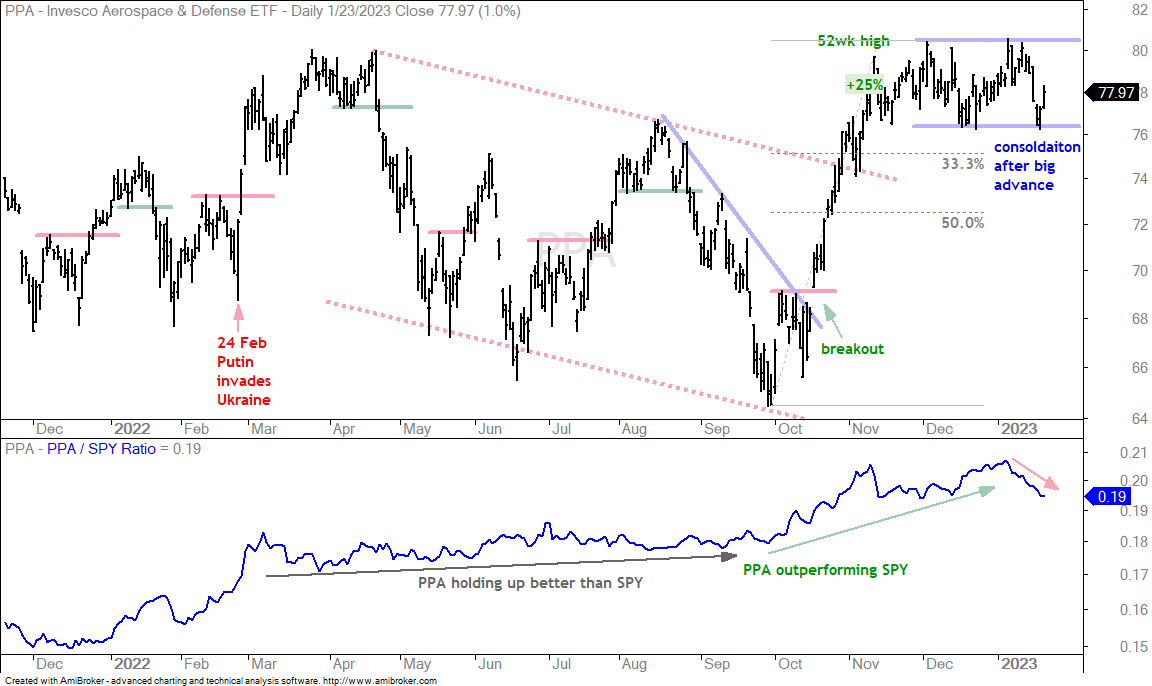
Surge and Consolidation for the Aerospace & Defense ETF (PPA)

Note that XLU, PPA, XLP, KIE and PHO are in similar situations. They were leaders in 2022, but they are lagging here in 2023 as money moves elsewhere. These ETFs surged into December and then corrected the last five weeks. As with XLV, I view recent weakness as a corrective process after the October-December advance.

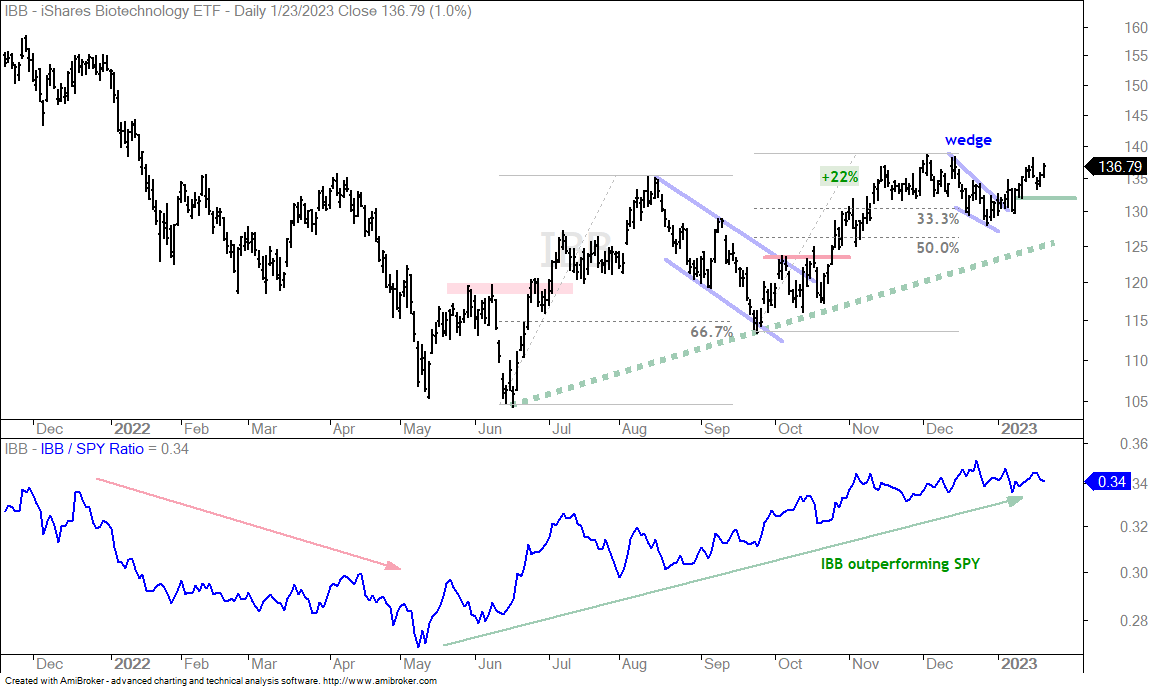
Biotech ETF Extends on Wedge Breakout (IBB,  plus XBI)

The Biotech ETF (IBB) is fairing better than XLV because it has a wedge breakout in early January and follow through the last two weeks. Short-term, a close below 132 would negate the wedge breakout.

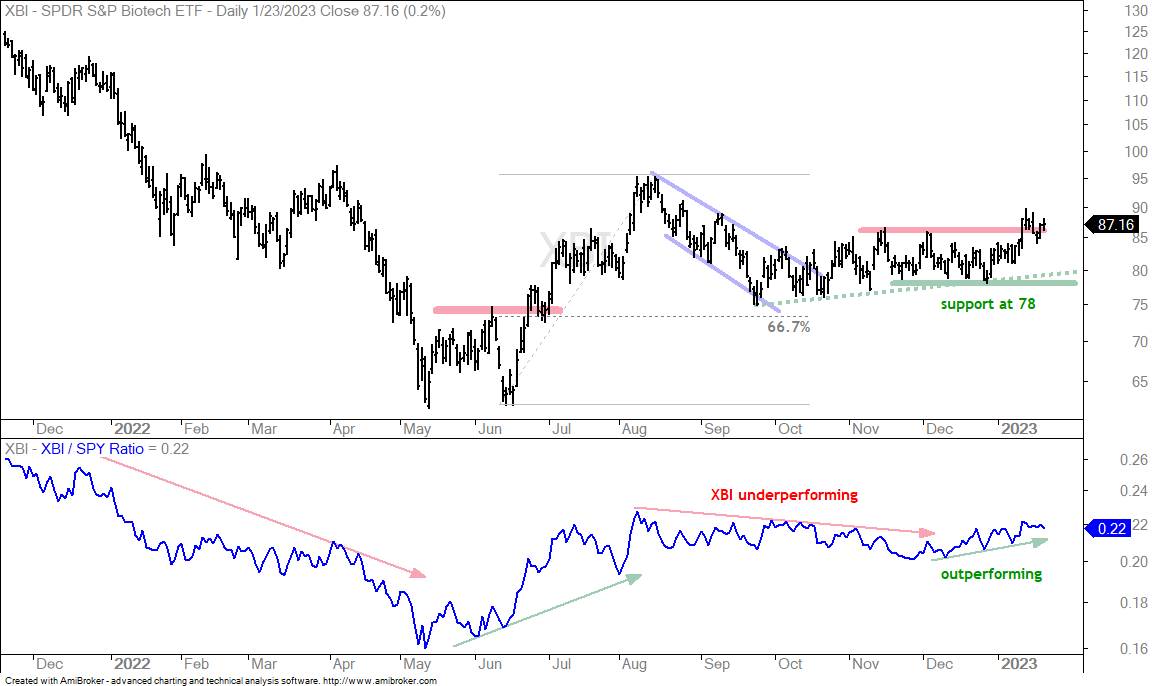
The next chart shows the Biotech SPDR (XBI) attempting to break out of its November-December range with a surge last week. The overall trend is up since October, but the rate of ascent is not very steep. Key support is set at 78 and a close below this level would call for a re-evaluation.

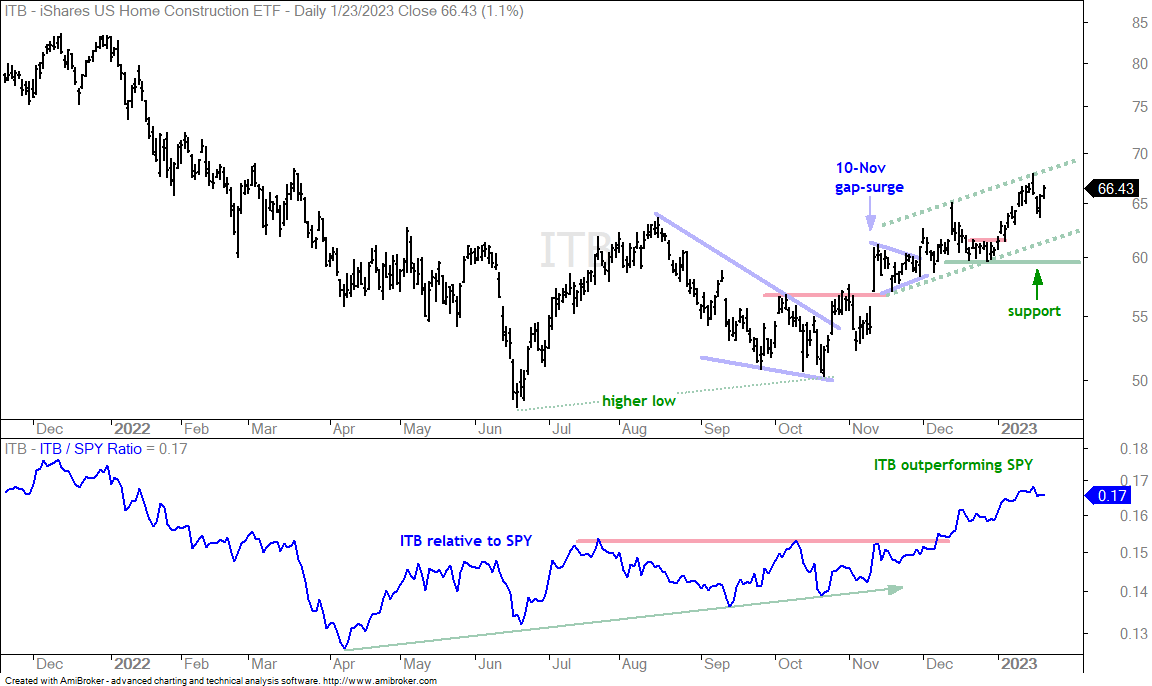
Home Construction ETF Continues to Lead (ITB)

The next chart shows the Home Construction ETF (ITB) getting a breakout surge on November 10th and working its way higher since. There is no setup on this chart, just a leading uptrend. The late December low marks support at 60. The indicator window shows the price-relative with a breakout in early December and continued strength into January.

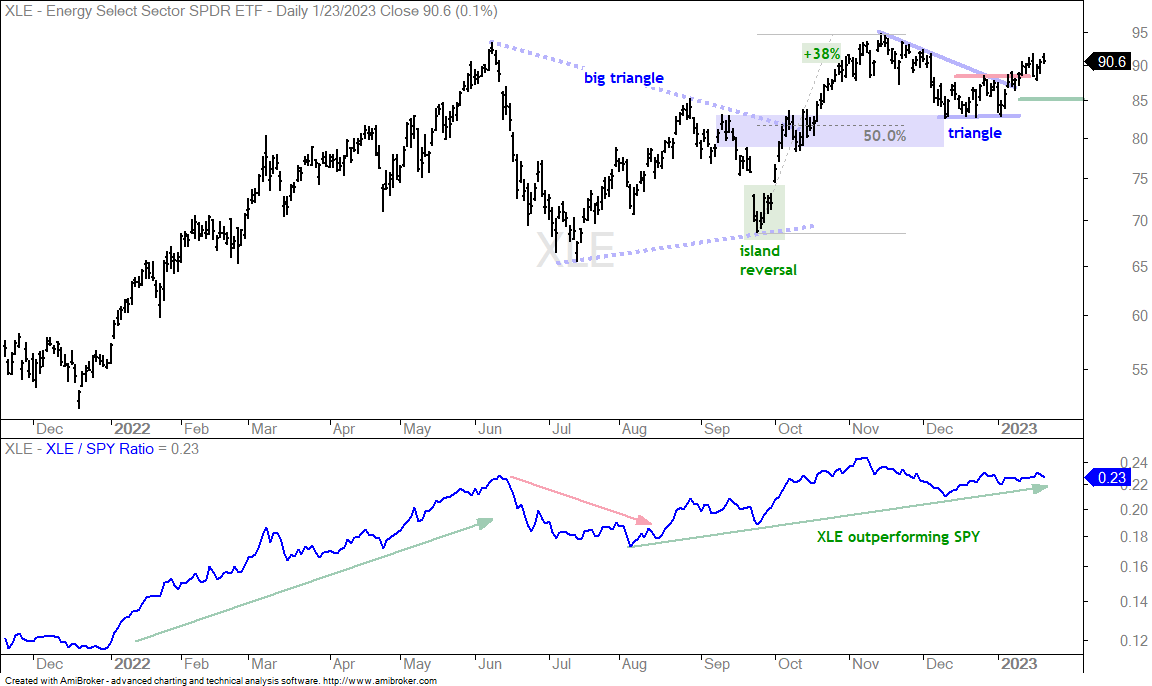
Energy SPDR Holds Triangle Breakout (XLE)

The Energy SPDR (XLE) is holding its own in 2023 with a triangle breakout and this breakout is holding. There was not much follow through after the breakout, but the breakout is bullish nonetheless. A triangle after a 38% surge is a bullish continuation pattern. The breakout is valid as long as XLE holds 85.

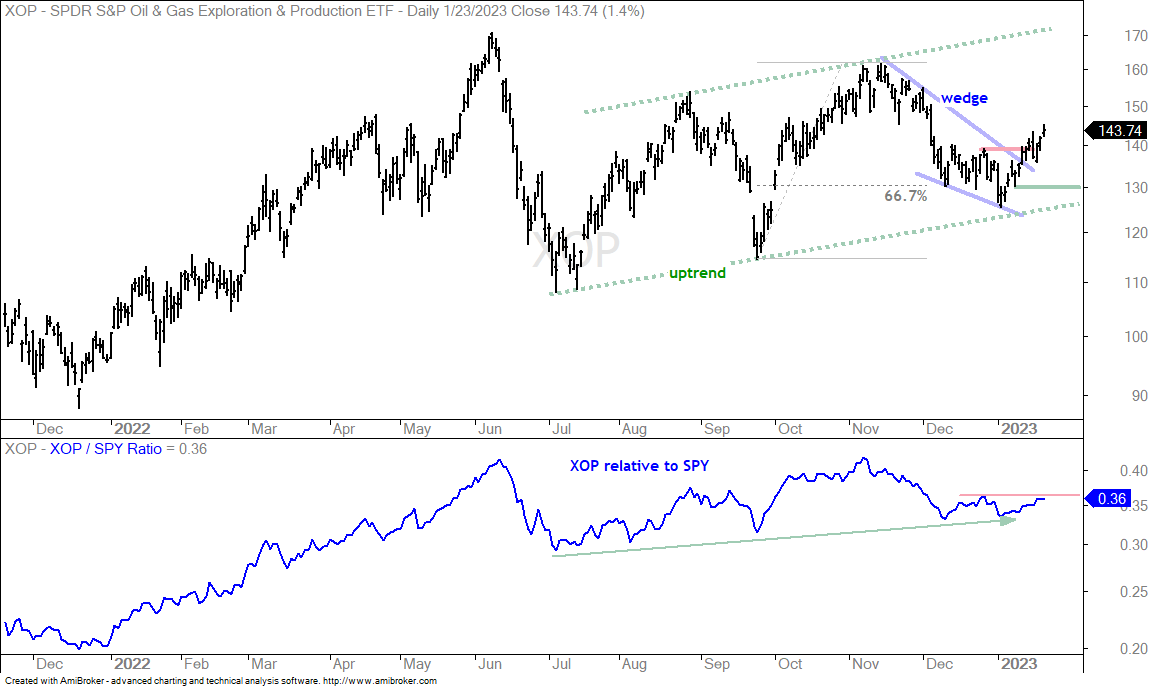
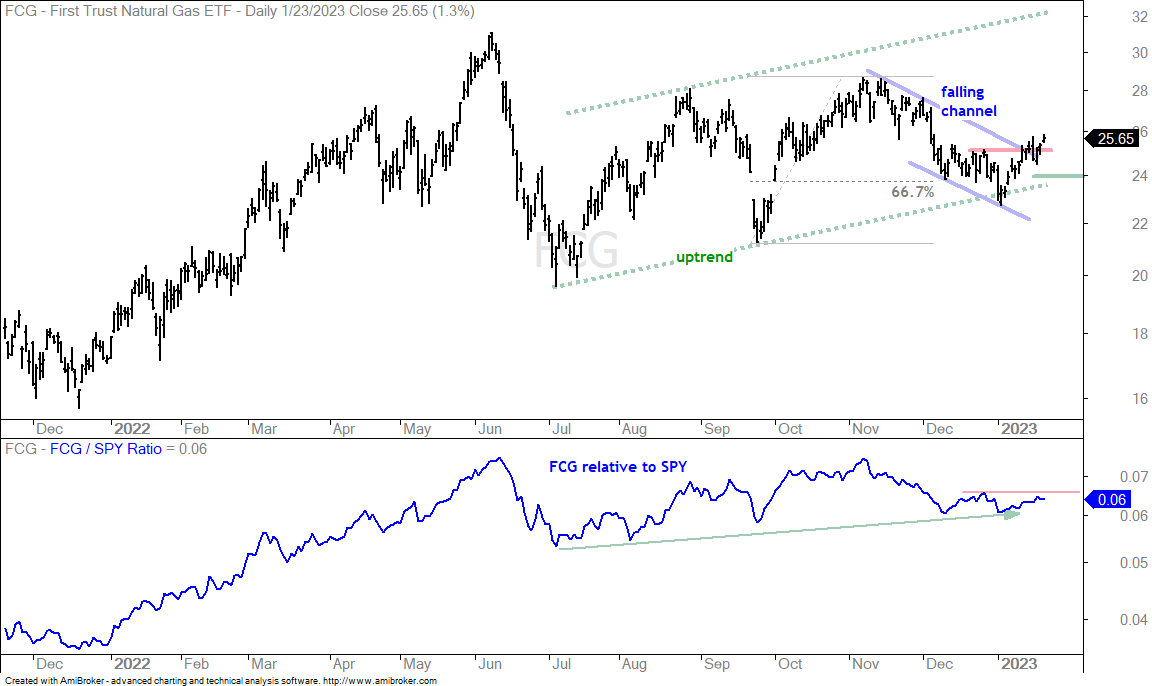
XOP and FCG Break Out of Wedges (plus AMLP)

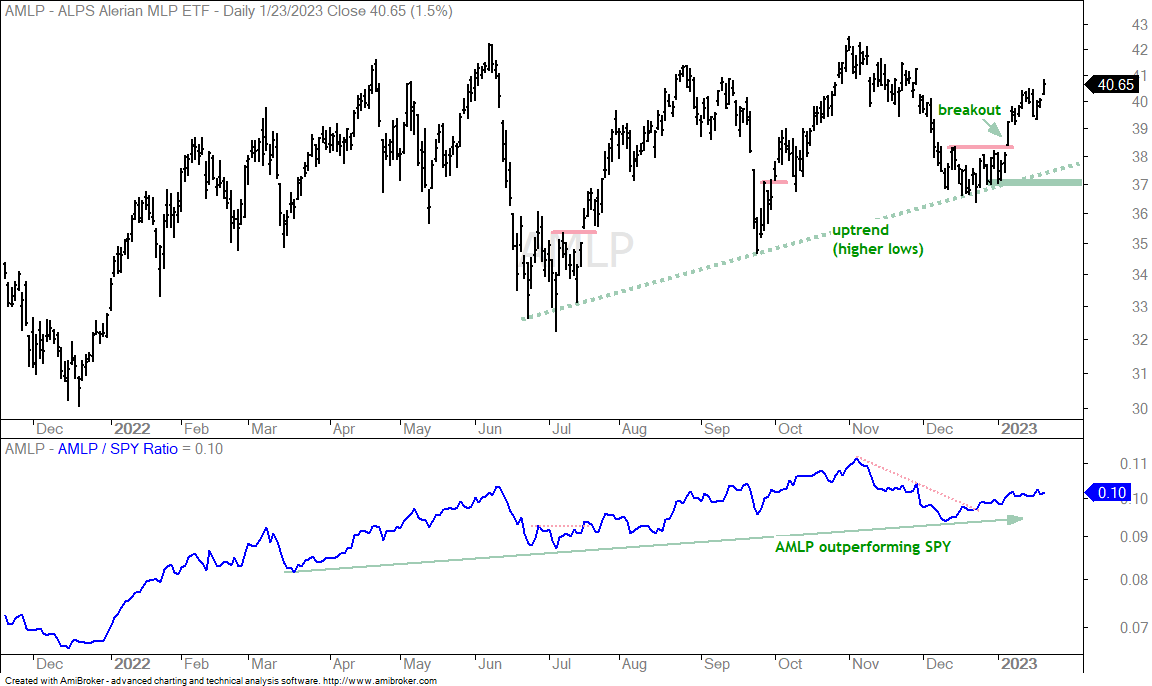
The next charts show the Oil & Gas Exploration & Production ETF (XOP), Natural Gas ETF (FCG) and MLP ETF (AMLP) with breakouts in January. XOP and FCG broke out of falling wedge/channel patterns that retraced around two thirds of the prior advance. The green lines mark my re-evaluation levels. A close below these levels would negate the breakout and call for a re-evaluation.

The next chart shows AMLP with the strongest breakout of the group. AMLP broke out in early January and followed through with further strength above 40.

Gold Shrugs off Overbought Conditions

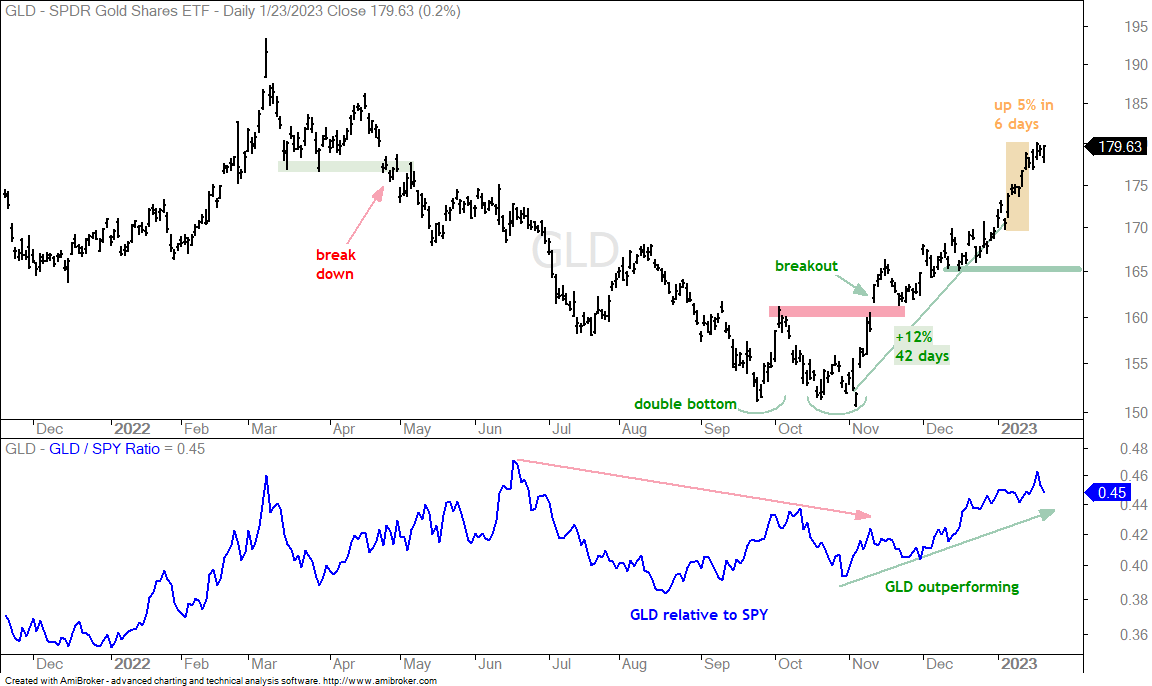
There is no setup for the Gold SPDR (GLD). The ETF broke out at 161 in mid November and continued higher into January with a move towards 180. The ETF surged some 5% in six days (yellow shading) and I viewed this as an acceleration after a 12% advance. An acceleration after an extended advance shows frothiness that can lead to a pullback or consolidation.

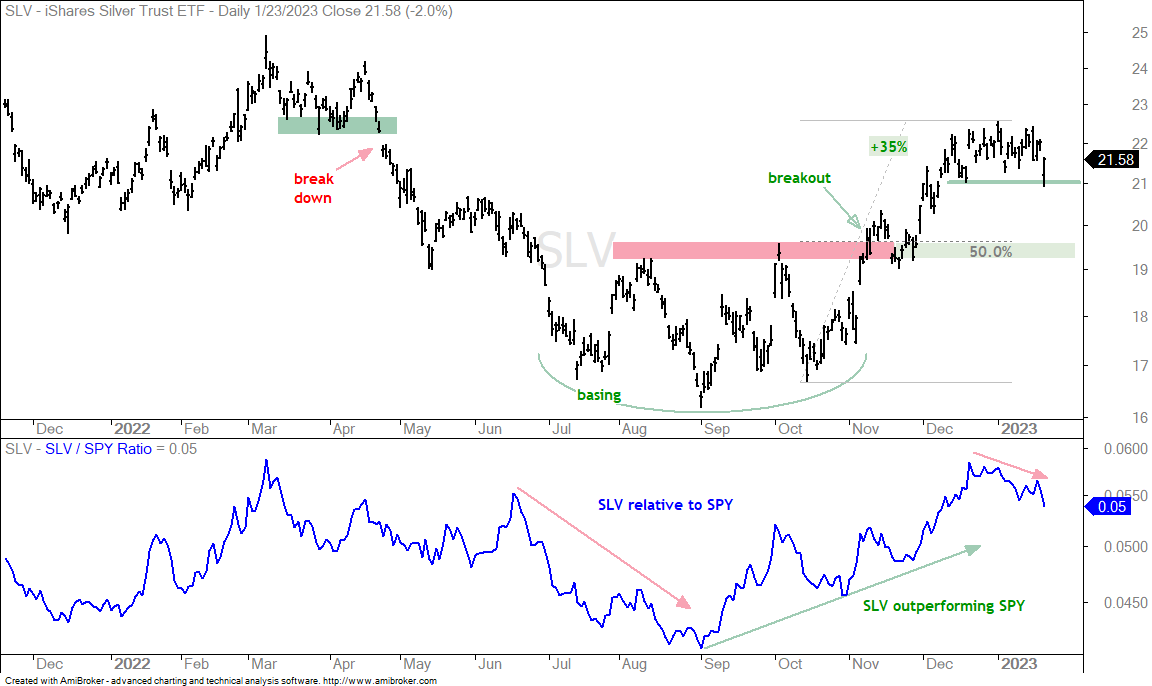
The Silver ETF (SLV) is already looking vulnerable to a pullback. The ETF surged some 35% and then stalled the last five weeks. Silver is starting to underperform gold and the stock market. A “normal” pullback would retrace half of the prior advance and return to the prior breakout zone (19.5).

Platinum ETF Forms Bull Flag (PLTM)

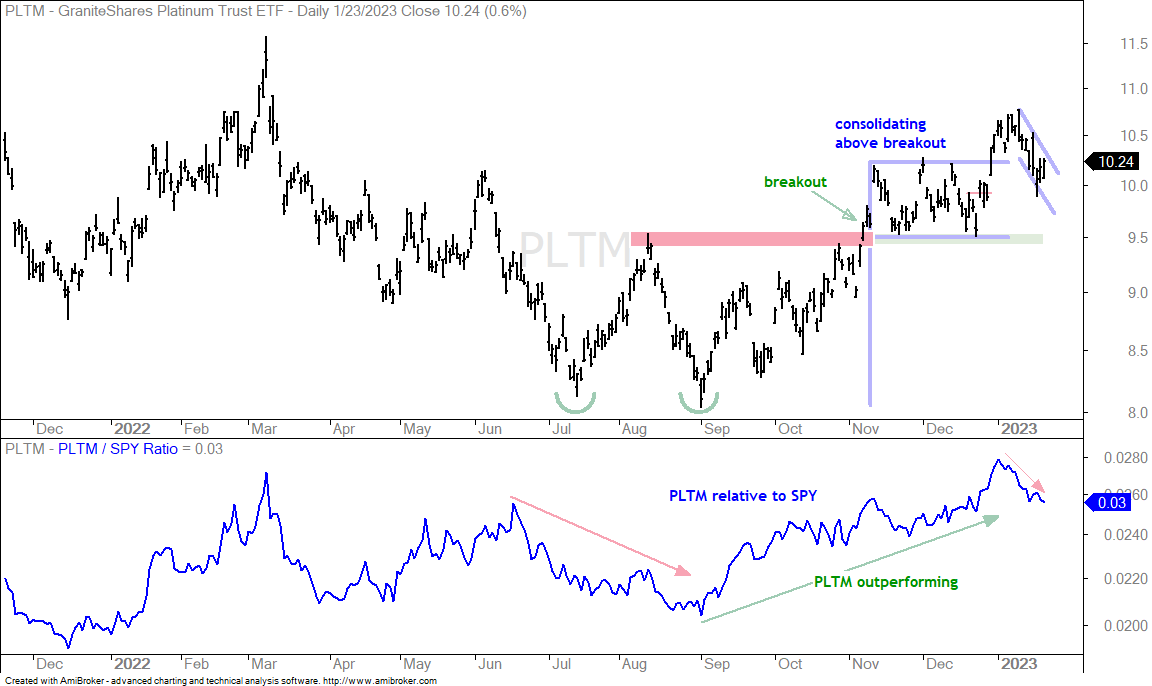
Gold, silver and platinum are positively correlated and move in the same direction. A pullback in gold would likely lead to weakness in other precious metals. The chart shows the Platinum ETF (PLTM) with a flag breakout in late December and a pullback into the flag range here in January. This pullback looks like a falling flag and a breakout at 10.4 would be short-term bullish.

DB Base Metals ETF is Strong, but Extended (DBB)

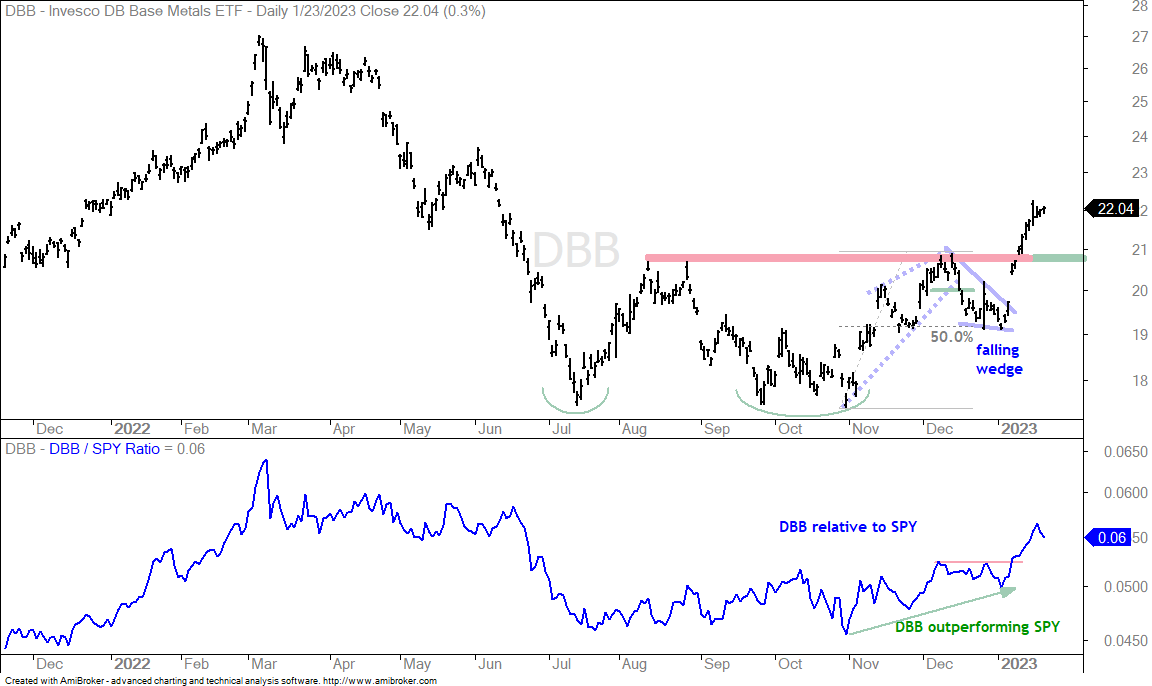
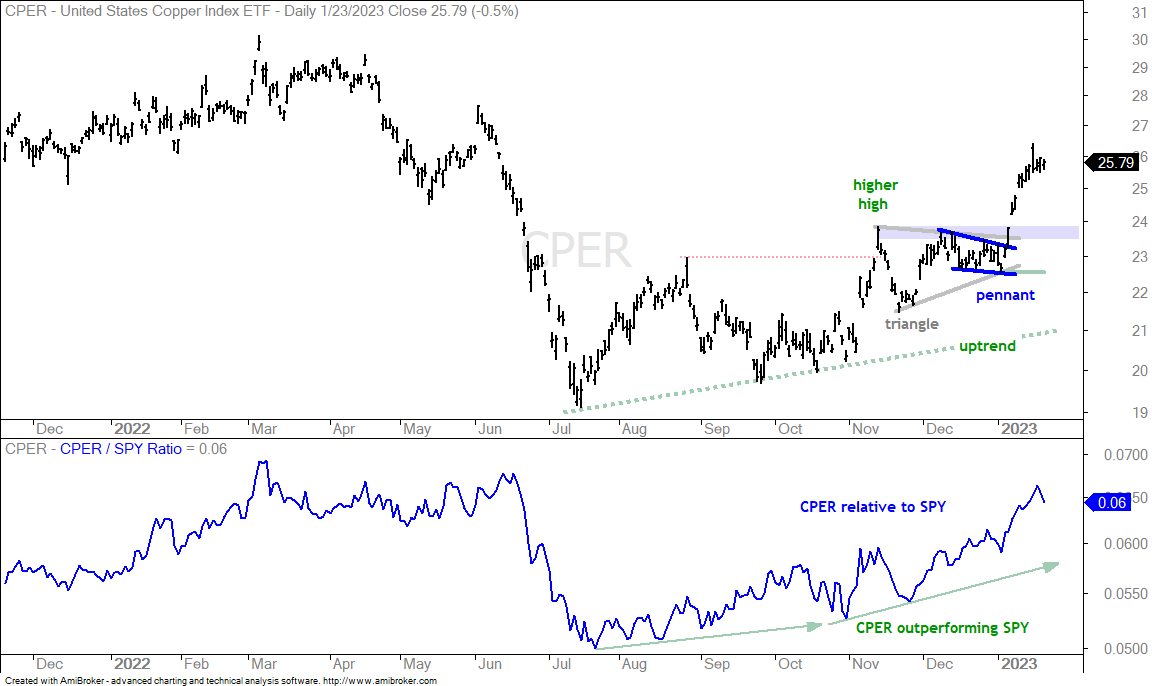
The DB Base Metals ETF (DBB) and Copper ETF (CPER) are also leading here in January with double-digit advances and resistance breaks. They are also quite extended short-term and ripe for a consolidation or correction so I would not chase here. Instead, I would wait for a tradable pullback. The first chart shows DBB breaking above the summer-fall highs with a sharp surge. The breakout zone around 20.75 is the first support area to watch on a pullback.

The next chart shows CPER broken resistance marking first support in the 23.5-24 area (blue shading).  

You can learn more about my chart strategy in this article covering the different timeframes, chart settings, StochClose, RSI and StochRSI.

Thanks for tuning in and have a great day!
Scroll to Top