Volatility remains above average in the markets and now we have a Fed meeting to contend with. There is only one thing to do when the Fed meets: turn off your news feed and wait a few days for the dust to settle. Knee jerk reactions are possible on Tuesday and Wednesday so we need a wait a few days for a clearer picture to emerge. Keep in mind that the markets are forward looking beasts and the Fed is often behind the curve (data dependent). Even though we are in a bear market right now and the odds favor lower prices in the coming weeks or months, the markets look ahead and prices in events that will happen in a few months. Today’s news is old news when it comes to the markets.
About the ETF Trends, Patterns and Setups Report
This report contains discretionary chart analysis based on my interpretation of the price charts. This is different from the fully systematic approach in the Trend Composite strategy series. In this ETF Trends, Patterns and Setups report, I am looking for leading uptrends and tradable setups within these uptrends. While I use indicators to help define the trend and identify oversold conditions within uptrends, the assessments are mostly based on price action and the price chart (higher highs, higher lows, patterns in play). Sometimes the chart assessment can be at odds with the indicators.
This Week's Commentary Schedule
Tuesday – 13 September: Market-ETF Report and Signal-Rank Table Update
Wednesday – 14 September Market-ETF Video and Market Regime Update
Thursday – 15 September: Market-ETF Report and Signal-Rank Table Update
Saturday – 17 September: ETF Signal and Rank Table
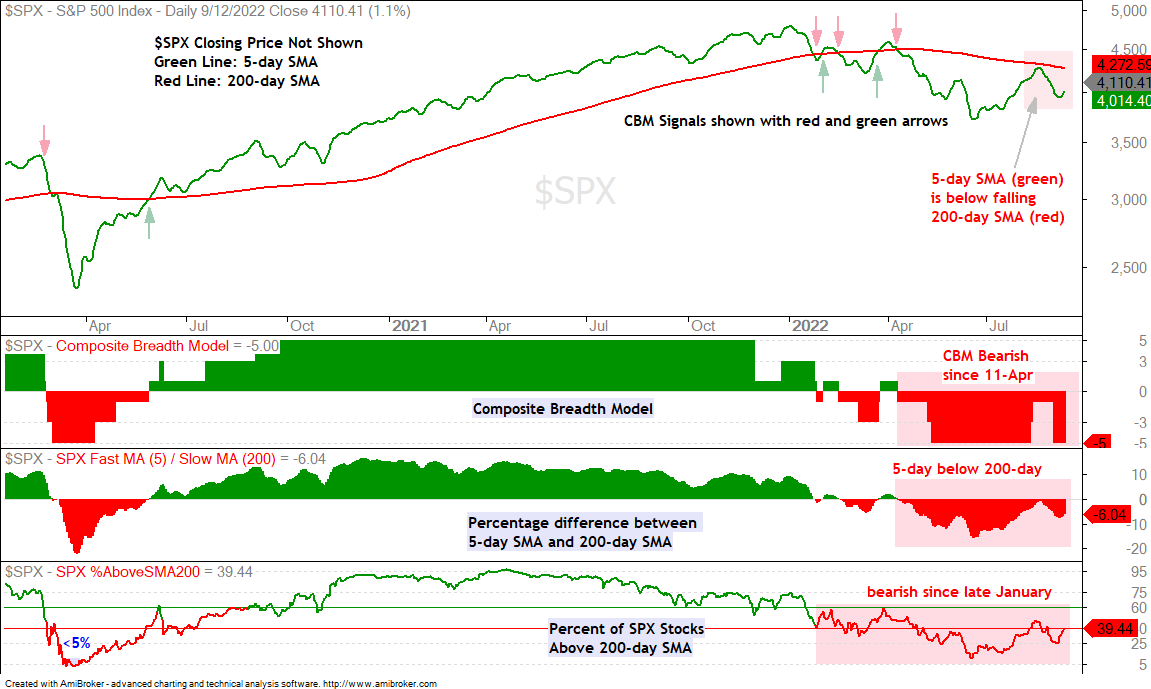
Composite Breadth Model Remains Bearish
The S&P 500 peaked in early January and is down around 18% since this peak (closing prices). The Composite Breadth Model went through some whipsaws from late January to late March, but turned bearish on April 11th and stayed bearish. The weight of the evidence is currently bearish for stocks with the Composite Breadth Model at -5. The 5-day SMA for the S&P 500 is some 8% below the falling 200-day SMA and less than 30% of S&P 500 stocks are above their 200-day SMAs. This means risk is above average for stocks and selectivity is the order of the day.
The stock market has a long-term upward bias and this one of the reasons markets can be especially choppy (volatile) during bear markets. Since 2000, the 5-day SMA for the S&P 500 has been above the 200-day SMA some 70% of the time and below some 30% of the time. This means we have had bull market conditions for around 15.3 years (183 months) and bear market conditions for 6.5 years (78 months). The S&P 500 was below its 200-day SMA from October 2000 until January 2002 and from January 2007 until May 2009. These were long stretches where risk levels were above average for stocks. I do not know how long the current bear market will last and will simply stay wary until the Composite Breadth Model turns bullish again.
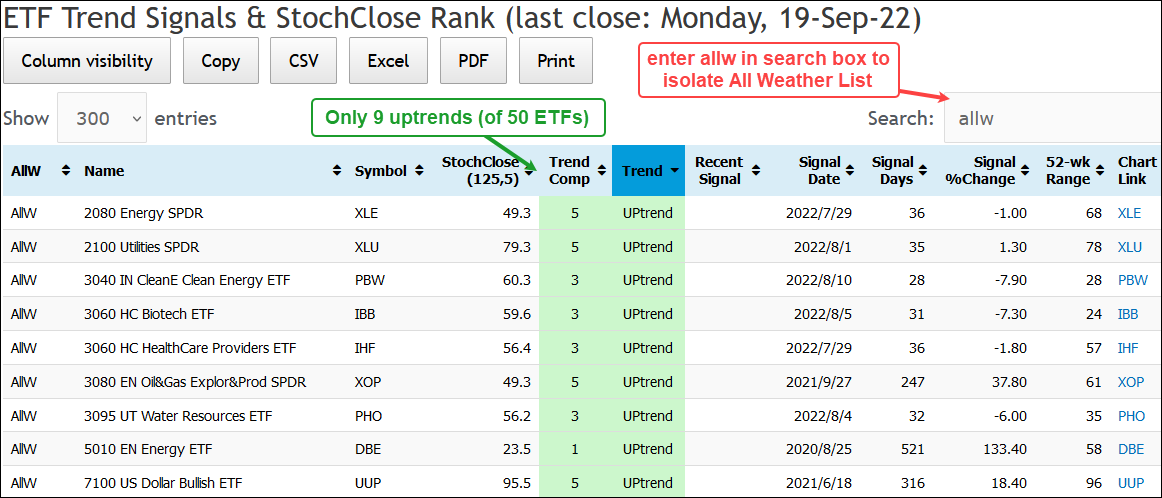
Not a Lot of Uptrends Out There
As far as the trends are concerned, there are not a lot of uptrends out there and we are still in a bear market. As the image below shows, only nine of the fifty All Weather ETFs are in utprends. This is not a good environment for stocks and stock-based ETFs. Stock-alternatives are not performing that well either because we have downtrends in bonds, base metals, precious metals and oil. Energy-based ETFs are looking vulnerable and Clean energy ETFs continue to hold up the best. Some agricultural-based ETFs have “constructive” looking charts, as does palladium.
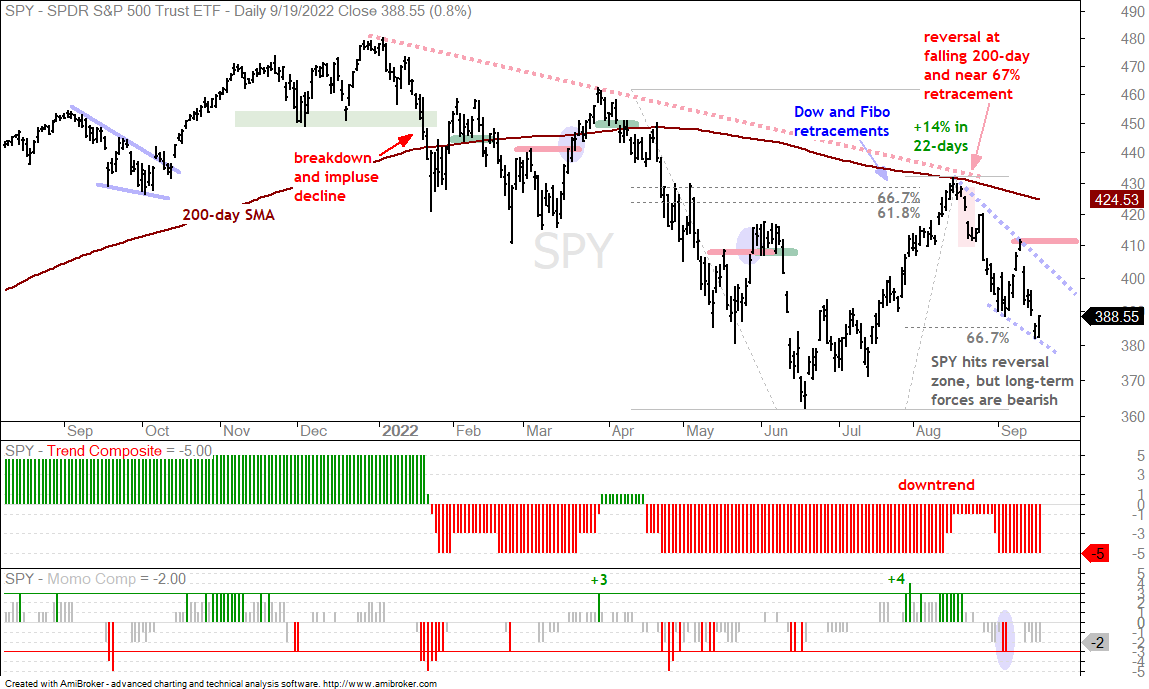
SPY Tests Reversal Zone, but Downtrend Dominates (QQQ, IWM)
The S&P 500 SPDR (SPY) remains in a long-term and short-term downtrend. Short-term, the ETF reversed near the falling 200-day SMA and fell around 11% since mid August. A falling wedge formed and SPY is trading in a potential reversal zone marked by the 66.7% retracement. The ETF is also a bit oversold after a four-day six percent decline last week. There is a short-term setup for a bounce, but an advance at this stage would still be considered a counter-trend bounce within a bigger downtrend. Keep in mind that the bigger downtrend and bearish market environment are the dominant forces at work right now.
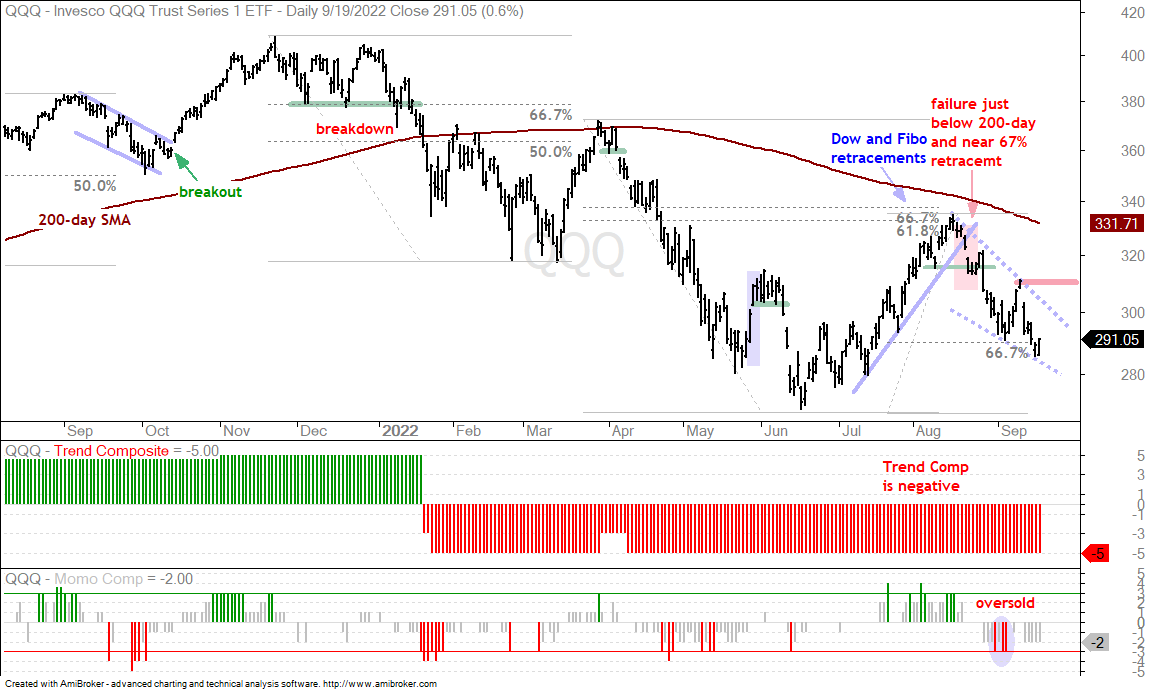
What if the S&P 500 were to hit 440 in the coming weeks? Well, of course, we could all look back and see the perfect setup because hindsight is 20/20. There was a strong surge from mid June to mid August, a 2/3 retracement of this surge and a falling wedge. The break above the 12-September high showed remarkable resilience, and there is also a higher low from June to September. This is wishful thinking right now, but it gives us a level to watch going forward (411). Baring a strong move and break above this level, the bears are fully in control. The next chart shows QQQ with similar characteristics.
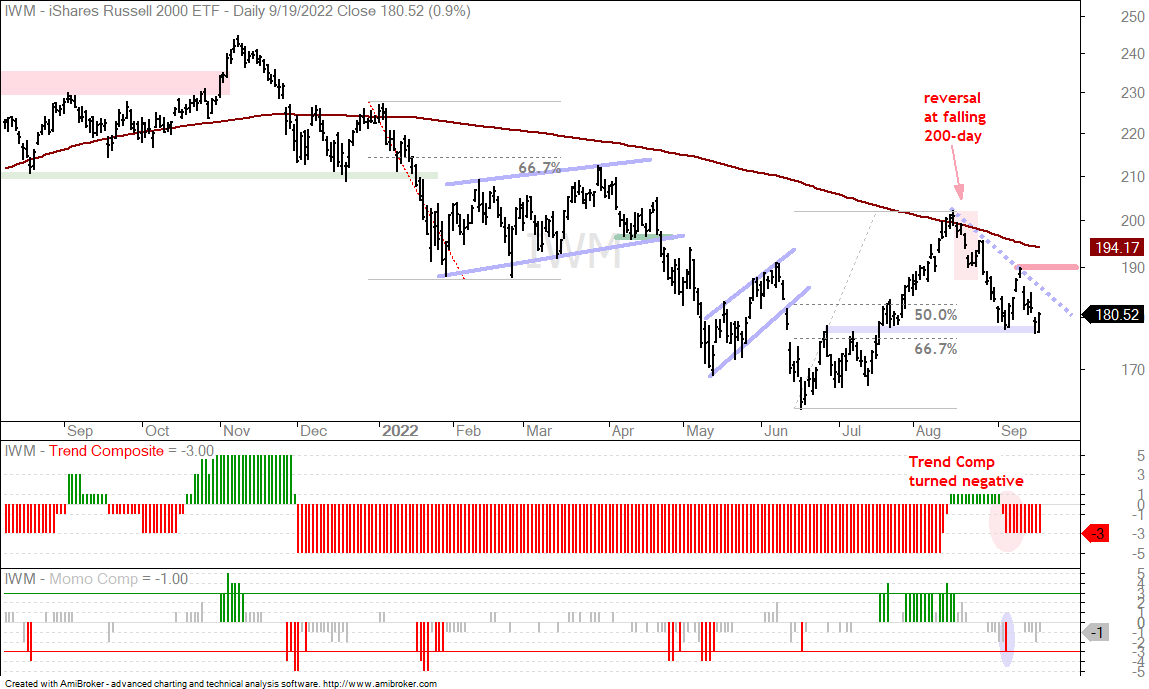
The Russell 2000 ETF (IWM) is holding up a little better than SPY and QQQ because it is still trading in a short-term support-reversal zone (broken resistance turns support and the 50-67% retracements). Even so, IWM is not an island and is still part of the stock market. The same logic applies because the long-term trend for IWM and bear market are the dominant forces at work.
Tech Leads Lower and Semis Lag (XLK, SOXX)
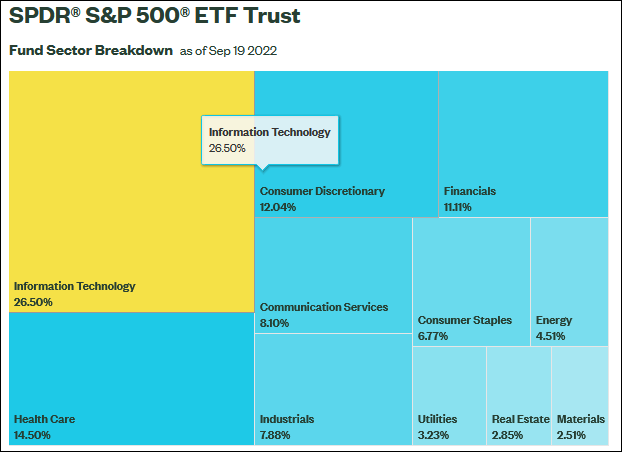
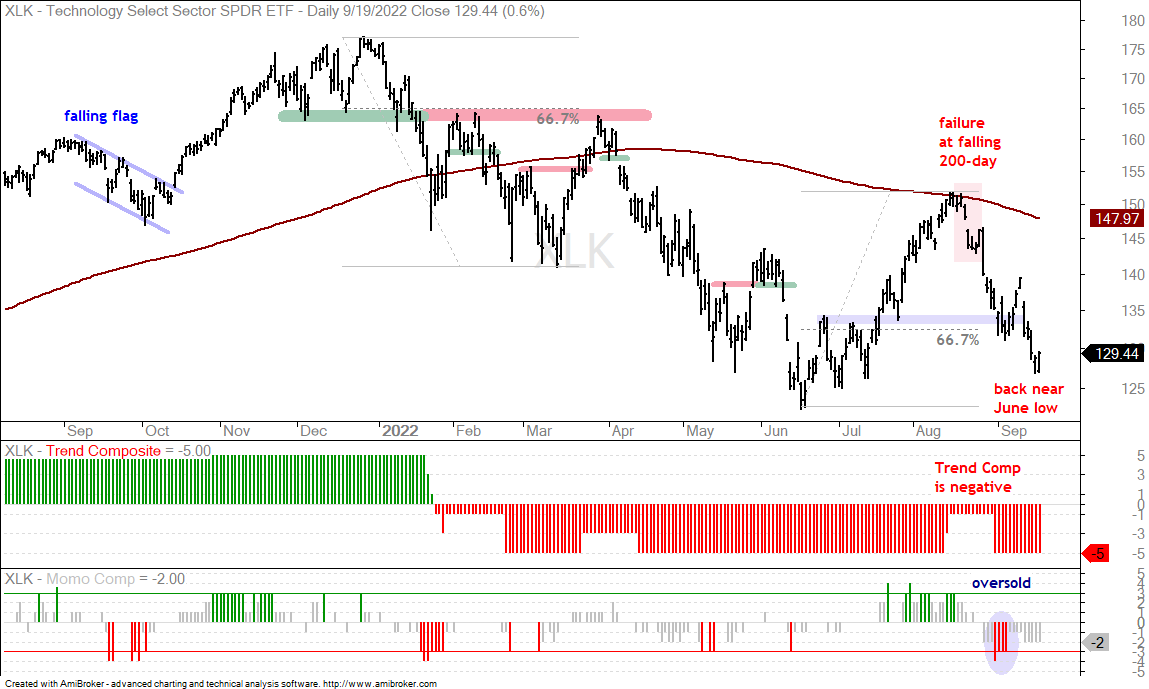
The Technology SPDR (XLK) is weaker than the broader market. XLK is still the biggest sector in the S&P 500 (26.50%) and represents the risk appetite in the stock market. A leading tech sector signals a strong risk appetite and this is bullish. A lagging tech sector signals a weak risk appetite and this detracts from the animal spirits. Note that nothing comes close to the influence of the tech sector because the second largest sector weighs in at distant 14.50% (Healthcare SPDR (XLV)).
The chart below shows XLK bouncing off the support-reversal zone in early September (blue shading) and then plunging below its early September low last week. I am not even going to draw a falling wedge because this decline looks more like an impulse move. Impulse and corrective moves are from Elliott Wave Theory. Impulse moves are stronger and in the direction of the bigger trend. Corrective moves are more subdued and run counter to the bigger trend.
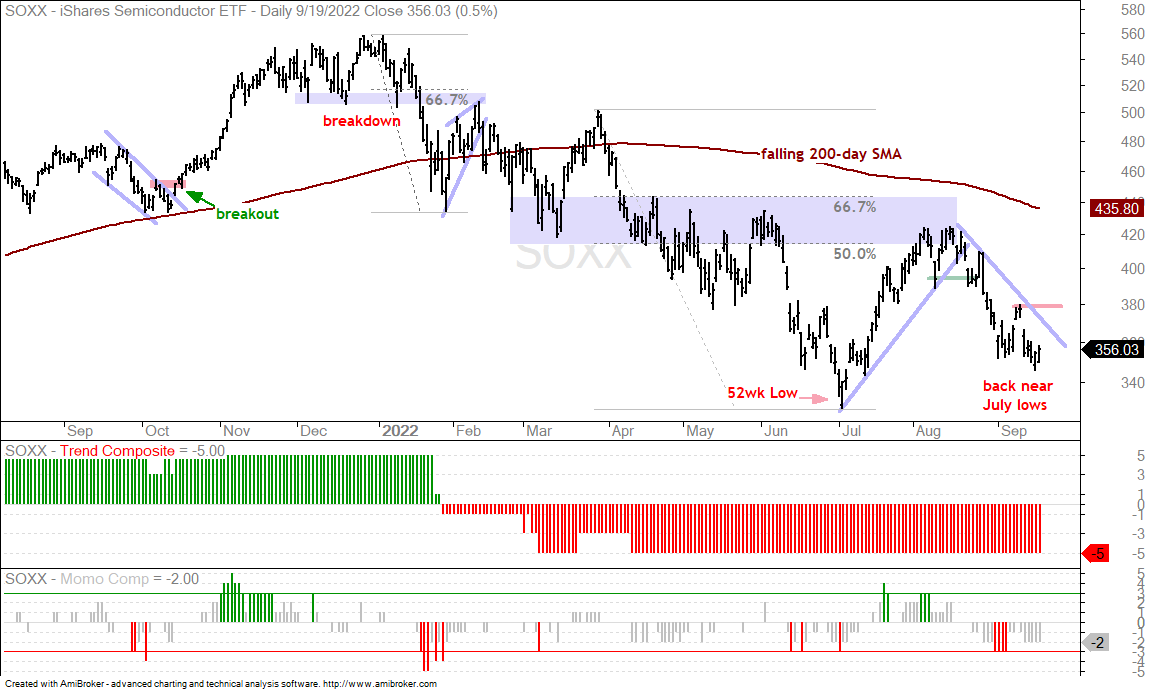
The next chart shows the Semiconductor ETF (SOXX) hitting a 52-week low in early July, bouncing into August and falling back below 360 in September. SOXX is clearly not a market leader right now. Long-term, it did not even reach its 200-day in August. Short-term, it did not hold the early September low.
Defensive Sectors Susceptible to Market Swings (XLU, XLV)
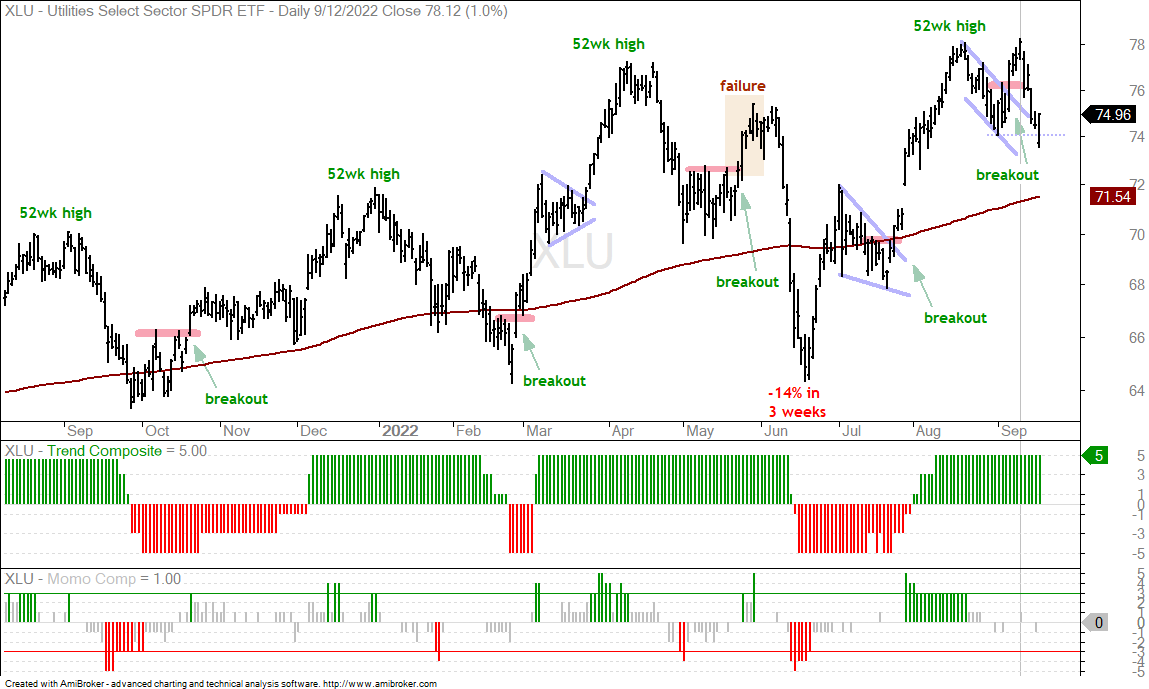
The Utilities SPDR (XLU) is still holding up better than the broader market, but it is not immune to broad market swings. XLU broke out of a falling flag when the market surged from September 7th to 12th and then gave it all back when the market plunged the last five days. As in mid May, this flag breakout has failed. The long-term trend remains up, but note that XLU is prone to some wide swings as it dipped below the 200-day SMA in Sep-Oct 2021, February and June.
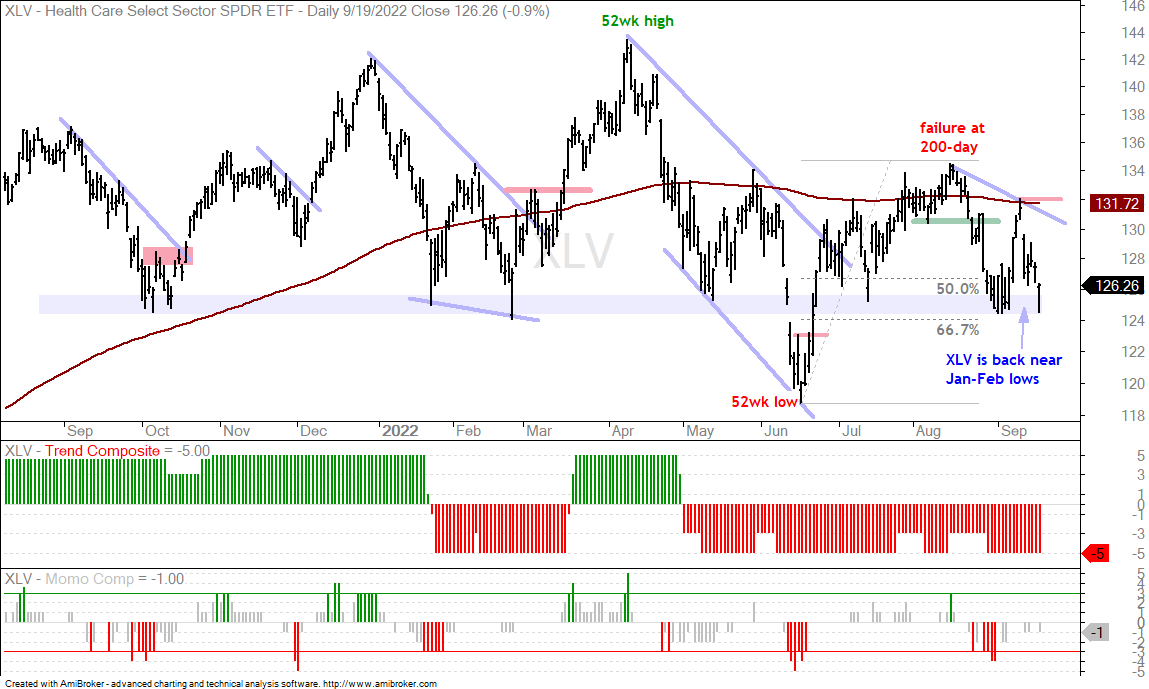
The Healthcare SPDR (XLV) is also holding up better than the broader market, but also not immune to broad market swings. XLV surged with the market from mid June to mid August and broke down in the second half of August as stocks plunged. XLV surged back above 130 as stocks surged and then fell back to the early September lows as stocks again plunged. XLV is holding up better long-term because is near its winter lows (blue shading 124-126). SPY, in contrast, is well below its January-February lows.
Oil Breaks Small Wedge within Downtrend (CL1!, NG1!)
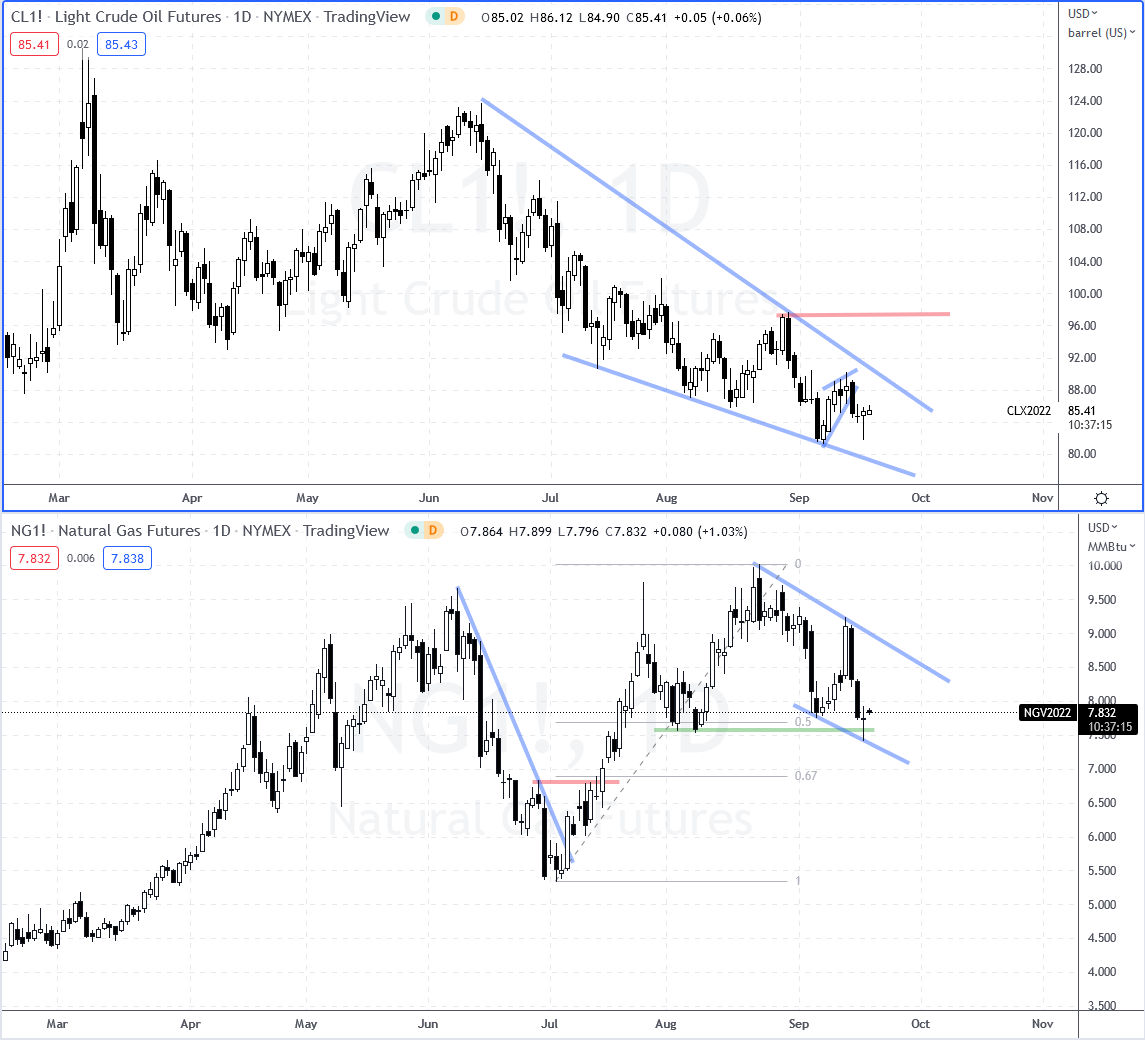
Light Crude Futures (CL1!) remain in a long-term downtrend and recently broke down after small rising wedge. This rising wedge is a short-term counter-trend bounce within a bigger downtrend. The wedge breakdown signals an end to the counter-trend bounce and a resumption of the bigger downtrend, which is defined by the bigger falling wedge and late August high (red resistance line).
The lower chart shows Natural Gas Futures (NG1!) in an uptrend overall because it recorded a new high in mid August. NG fell the last five weeks with a falling channel of sorts taking shape. This decline retraced around half (.5) of the July-August surge and returned to support from the August lows. I view this volatile decline as a correction after the July-August, which means the channel is a bullish continuation pattern.
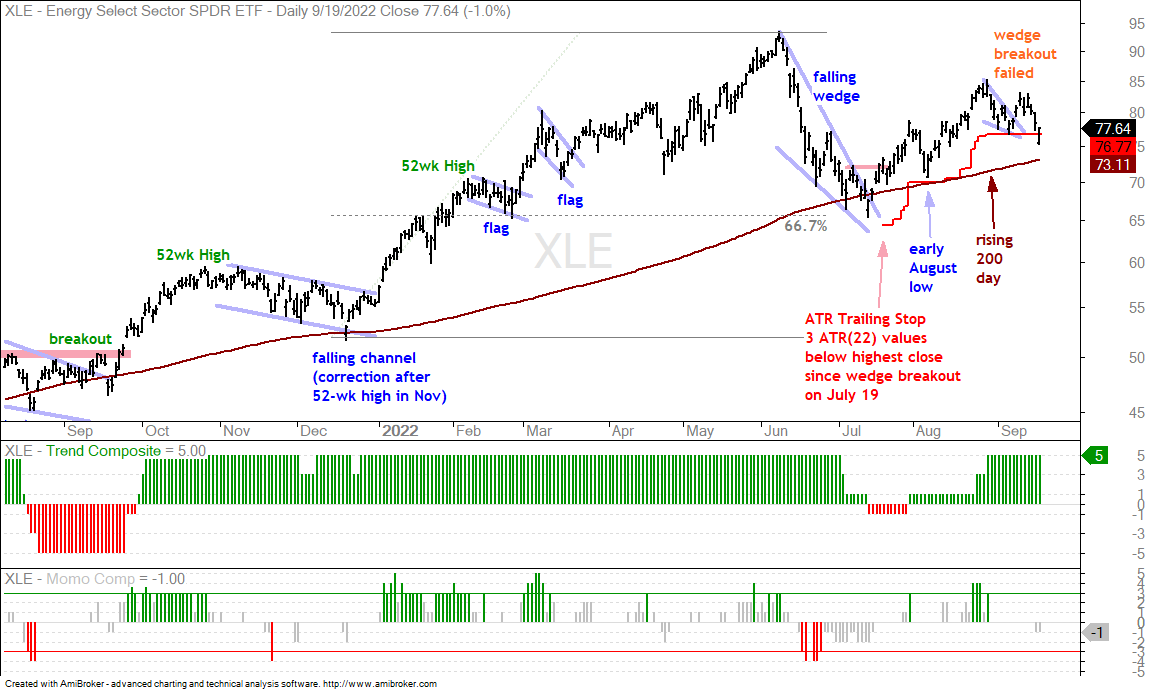
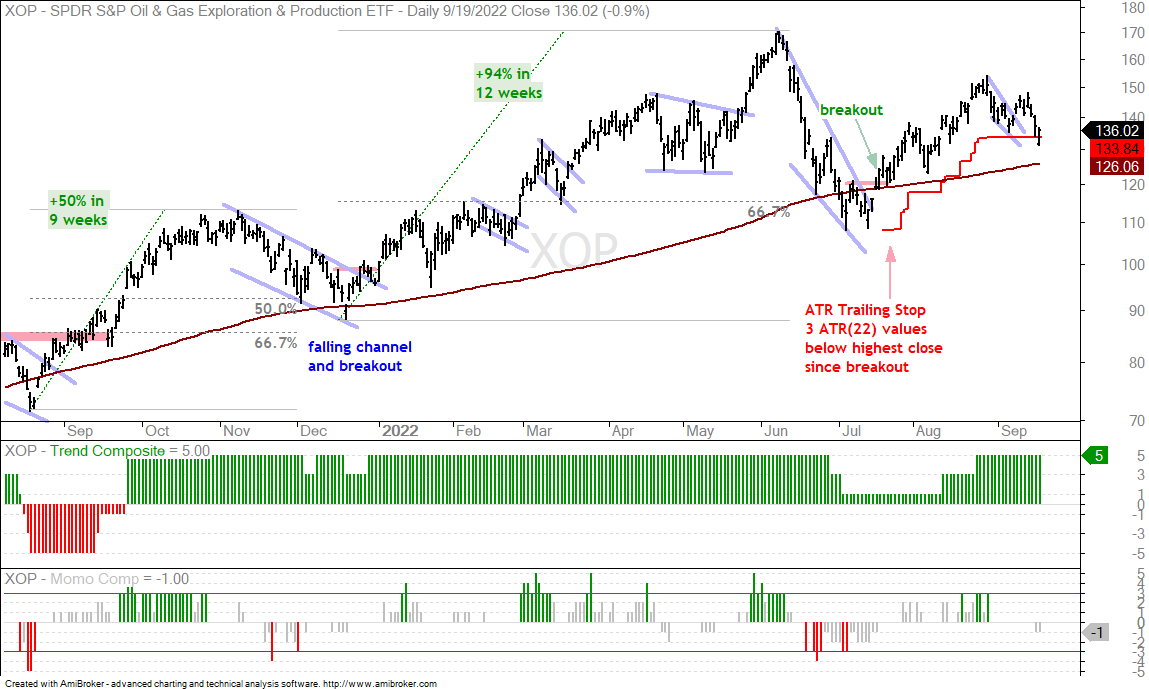
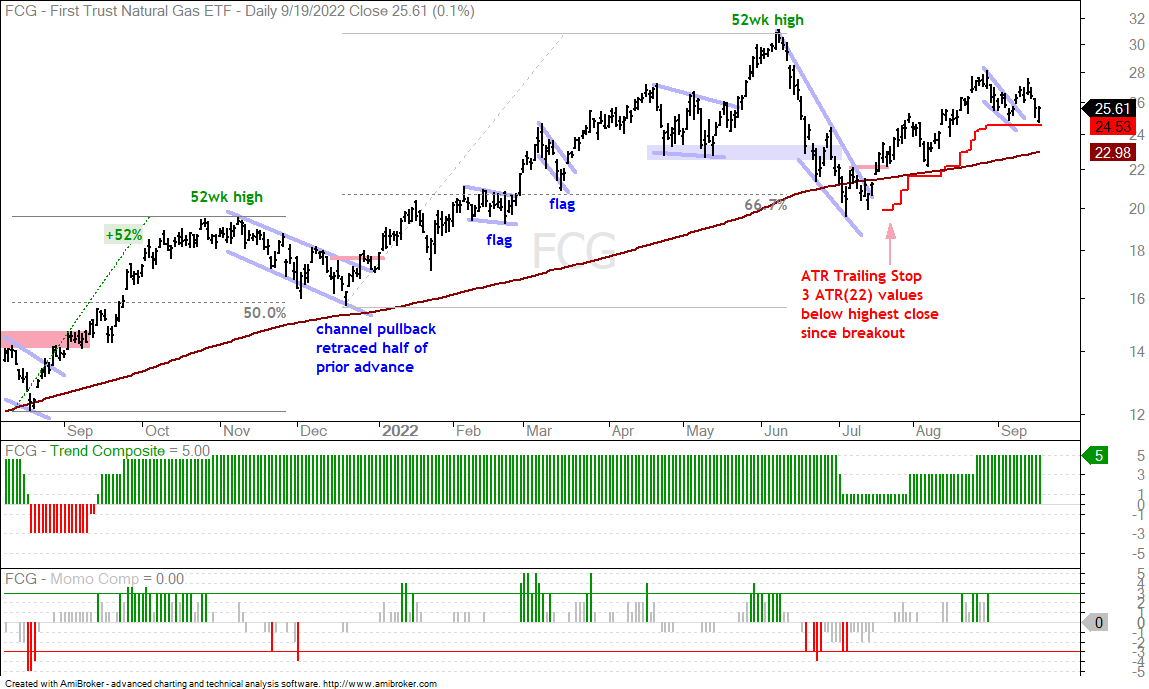
Energy SPDR Test ATR Trailing Stop (XLE, FCG, XOP)
Oil is down around 20% since July 1st, but the Energy SPDR (XLE) is up around 8.5% and the other energy-based ETFs are performing better than oil. The world order was turned on its head when Russia invaded Ukraine in late February 2021. This is perhaps part of the reason for relative strength in energy-based ETFs. Despite relative strength, weakness in oil is a concern for ETFs tied to the commodity. The chart below shows the Energy SPDR (XLE) breaking out of a small wedge on 8-Sep, but failing to hold this breakout as it fell below 80 the last four days. Notice that the ETF dipped below the ATR Trailing Stop, but did not close below this level to trigger the stop. It may, however, just be a matter of time before this stop triggers because oil is in a downtrend and we are in a bear market. The other charts show the Natural Gas ETF (FCG) and Oil & Gas Exploration & Production ETF (XOP) with similar characteristics.
You can learn more about the ATR Trailing Stop and exit strategies in this post, which includes a video and charting options for everyone.
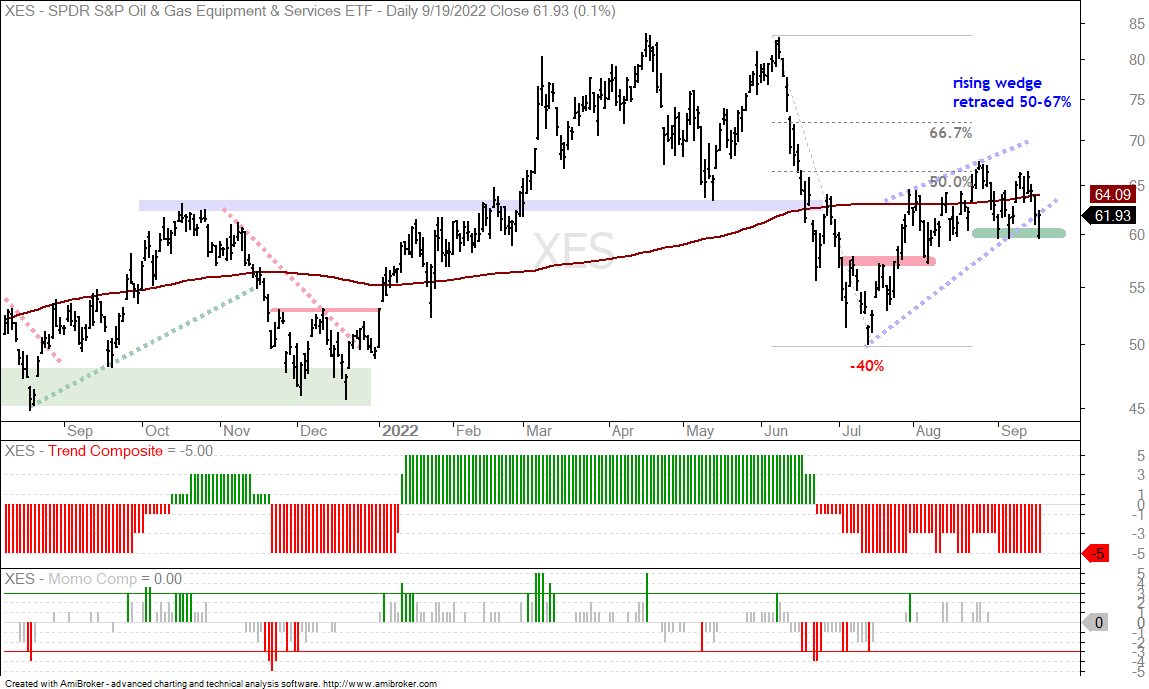
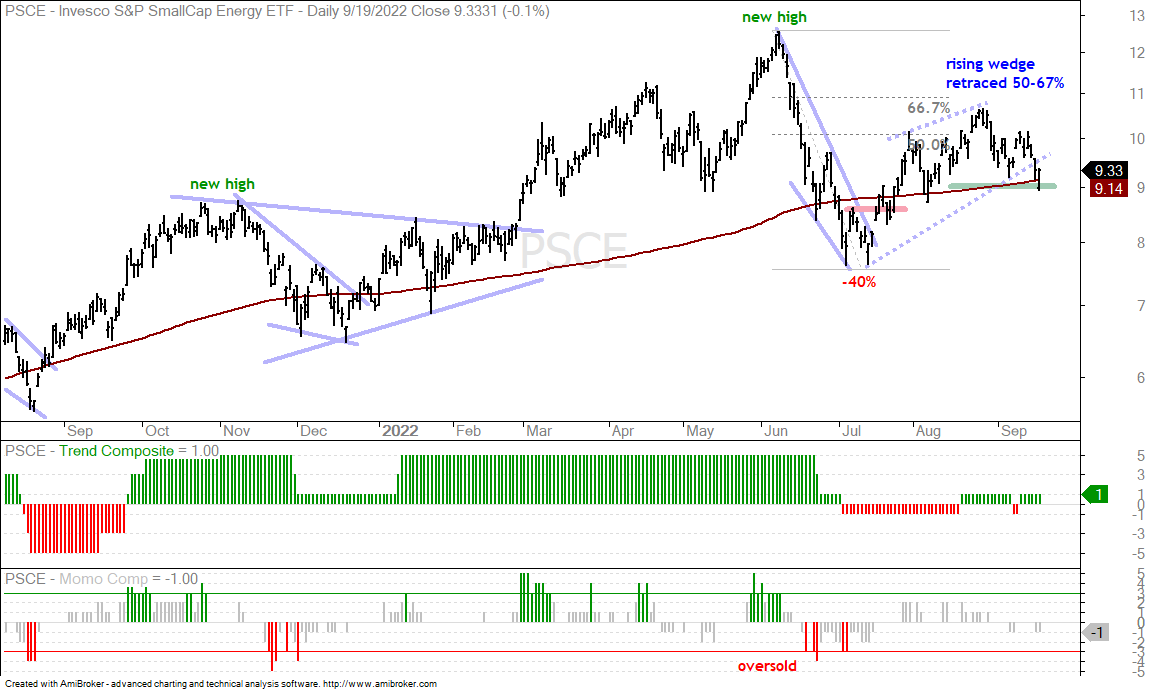
Oil & Gas Equip & Serv ETF Tests Wedge Support (XES, PSCE)
The Oil & Gas Equipment & Services ETF (XES) and the Small-cap Energy ETF (PSCE) are not as strong as the three ETFs above. The immediate trends are up, but rising wedges formed as both retraced 50-67 percent of the prior decline. The 50-67 percent retracement zone is a potential reversal zone because it represents one step up for the corrective move, which is after the two steps down for the impulse move. A break below the green support lines would reverse these upswings and signal a continuation of the June-July swoon (-40%), which was an impulse move.
Clean Energy ETFs Holding Up Better, but Not Immune
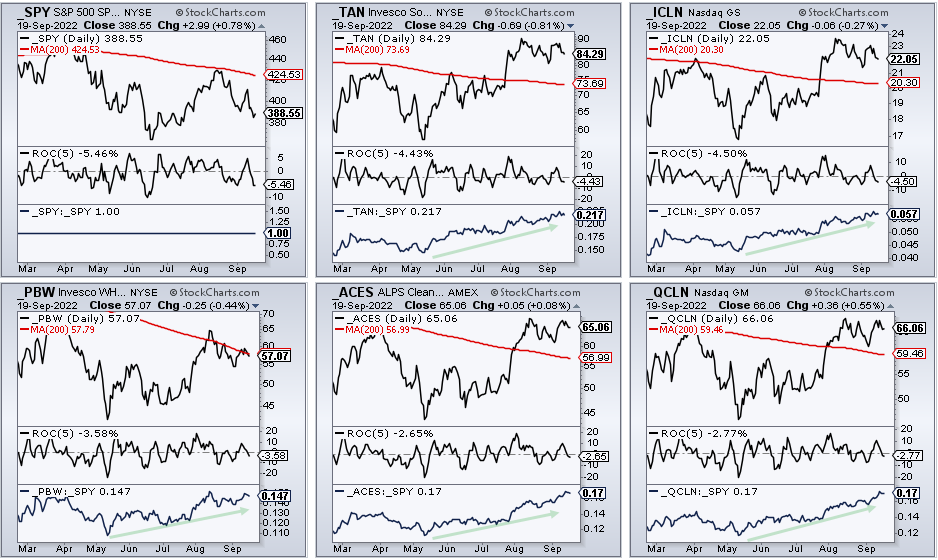
The clean energy ETFs are still leading the market overall, but they are not always immune to broad market swings. The CandleGlance charts below show price with the 200-day SMA, the 5-day Rate-of-Change and the price relative (_TAN:_SPY ratio). Stocks fell sharply the last five days with SPY falling 5.46%. The five clean energy ETFs were down between 2.65% and 4.5%. Even though they held up better than SPY with smaller declines, they were still influenced by the broader market.
The lower windows show the price relatives rising since May, which means clean energy ETFs are outperforming SPY. Also note that four of the five are well above their 200-day SMAs (red lines).
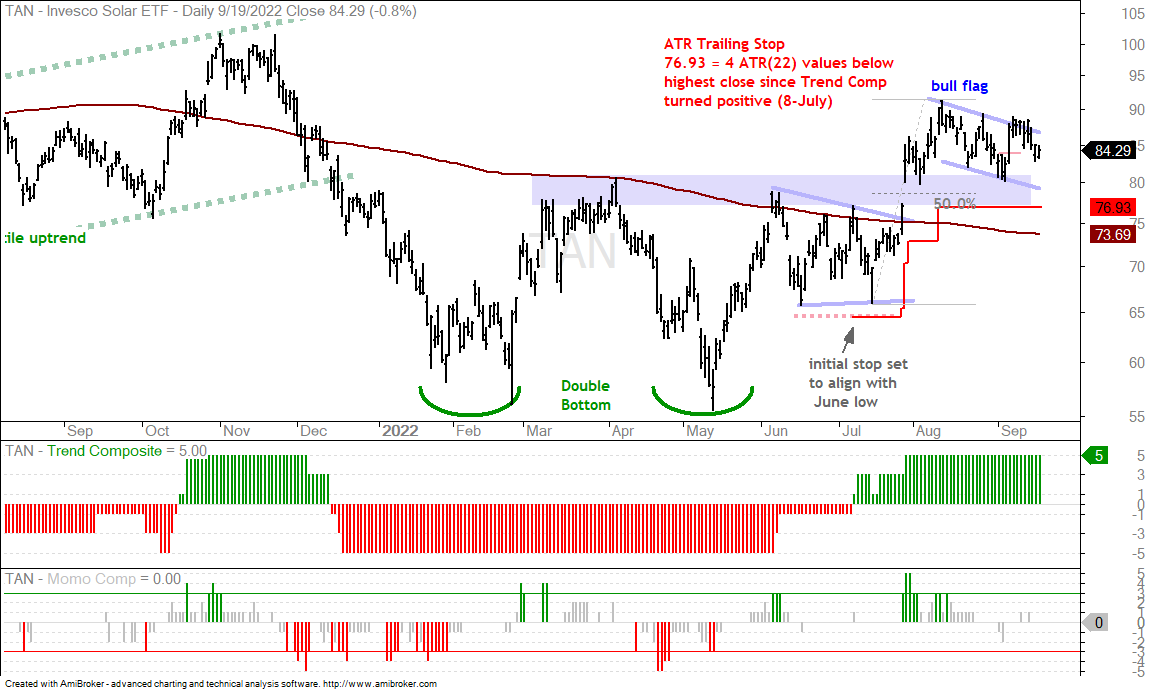
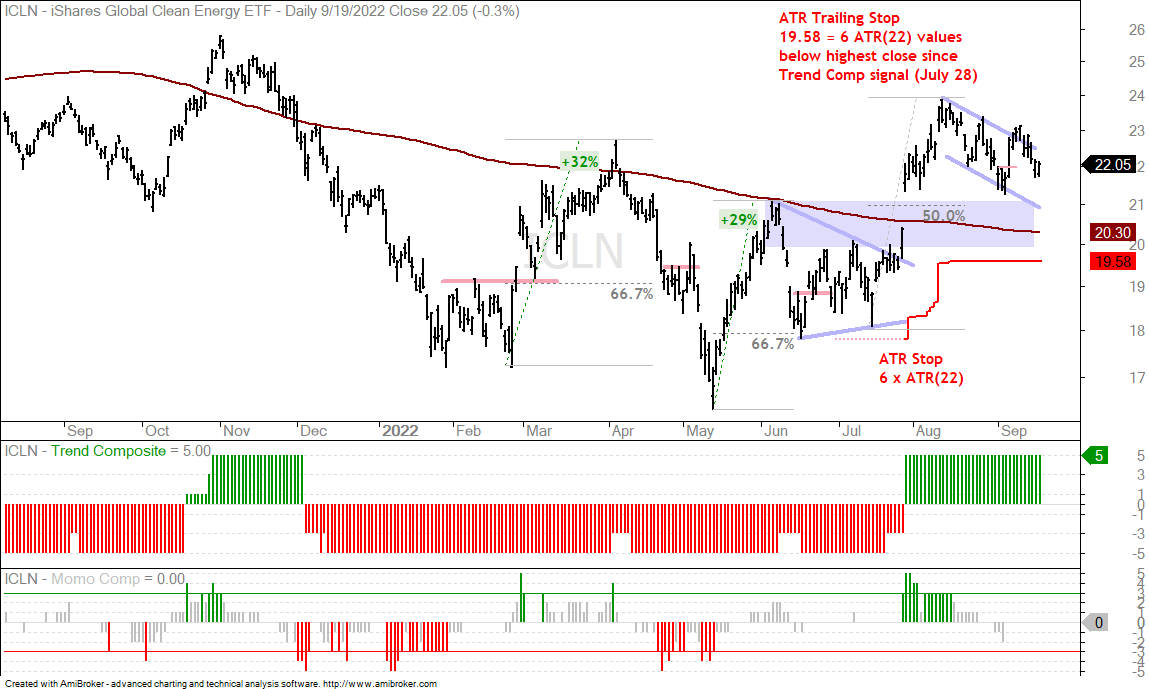
Solar and Clean Energy ETFs Fall Back (TAN, ICLN, ACES)
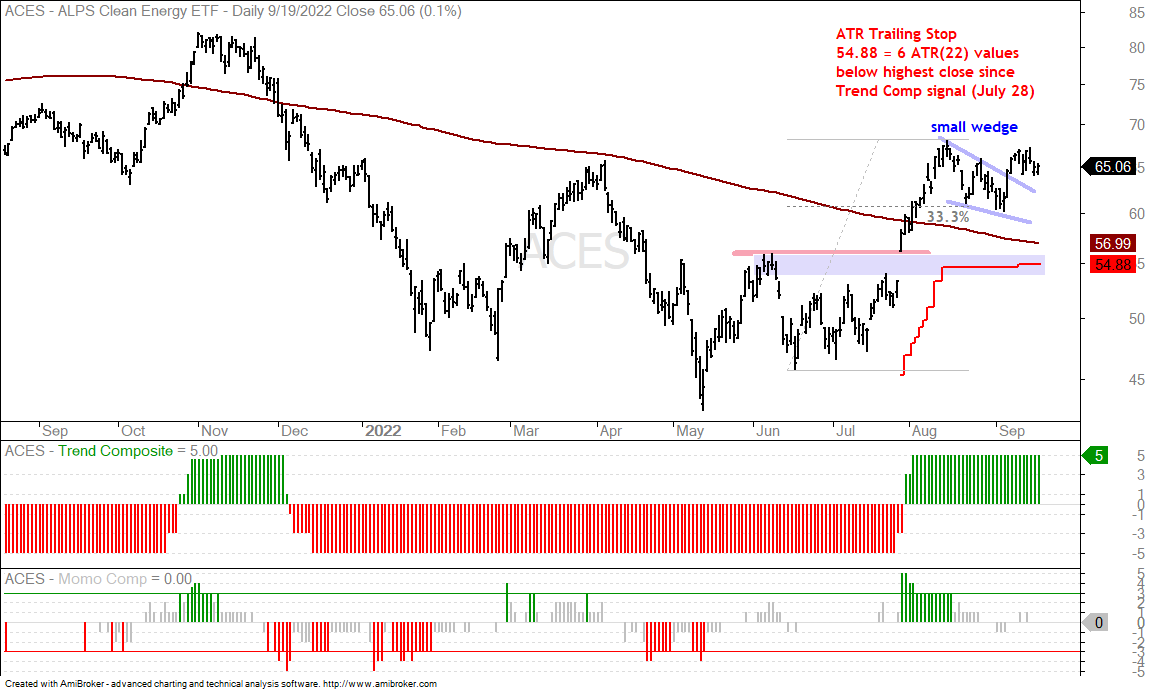
The next chart shows the Solar Energy ETF (TAN) with a 30+ percent surge from mid July to mid August and a falling flag into mid September. TAN appeared to break out, but fell back into the flag last week. The overall trend remains up and the setup is still bullish. The surge is deemed the impulse move and the flag is a correction. I expect a flag breakout and continuation higher at some point – with the broad market environment being the wild card here. The red line shows the ATR Trailing Stop for reference. The other charts shows the Global Clean Energy ETF (ICLN) moving back into the flag and ACES holding the wedge breakout.
Biotechs Pop and Drop With Market (IBB, XBI)
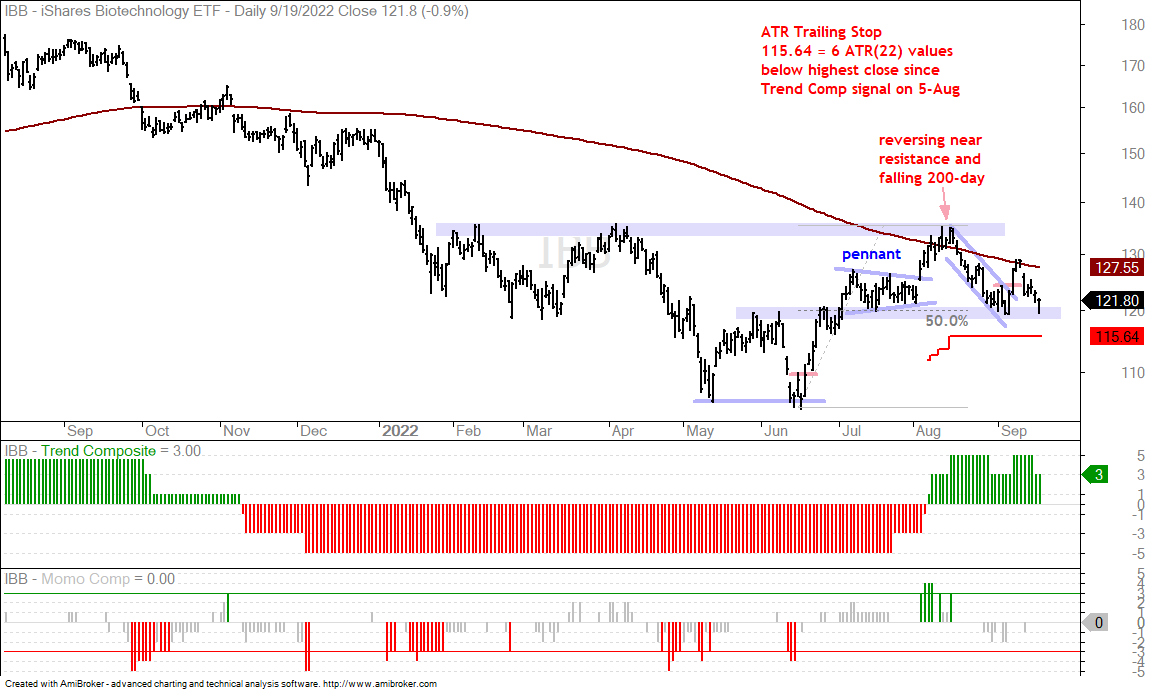
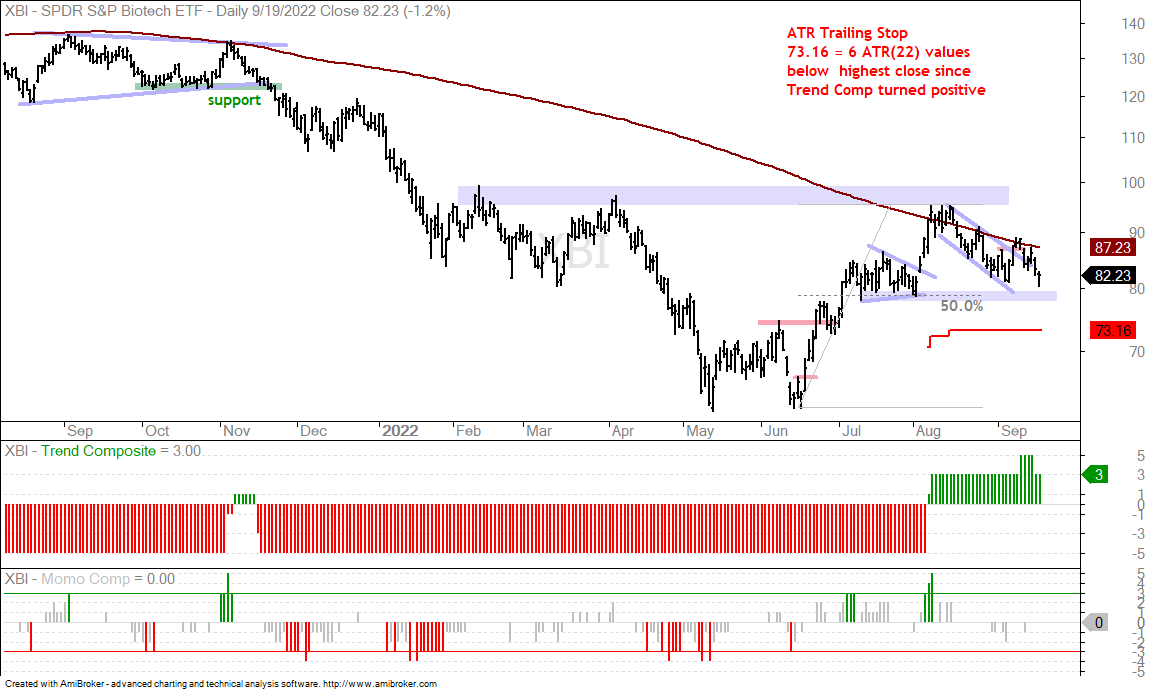
The Biotech ETF (IBB) and the Biotech SPDR (XBI) are below their falling 200-day SMAs, but their Trend Composites are positive. We are in a bear market so this suggests a mixed picture for biotechs, at best. The red lines show the ATR Trailing Stops starting when the Trend Composites turned bullish. A close below these stops or a cross below zero in the Trend Composite would argue for a re-evaluation.
Both IBB and XBI formed flags and broke out of these flags when the market surged from September 7th to 9th. And just like the market, these biotech ETFs gave it all back with sharp declines the last five days. Even though these two are still above their early September lows and near support zones, the bear market hangs over stock-based ETFs like a dark cloud.
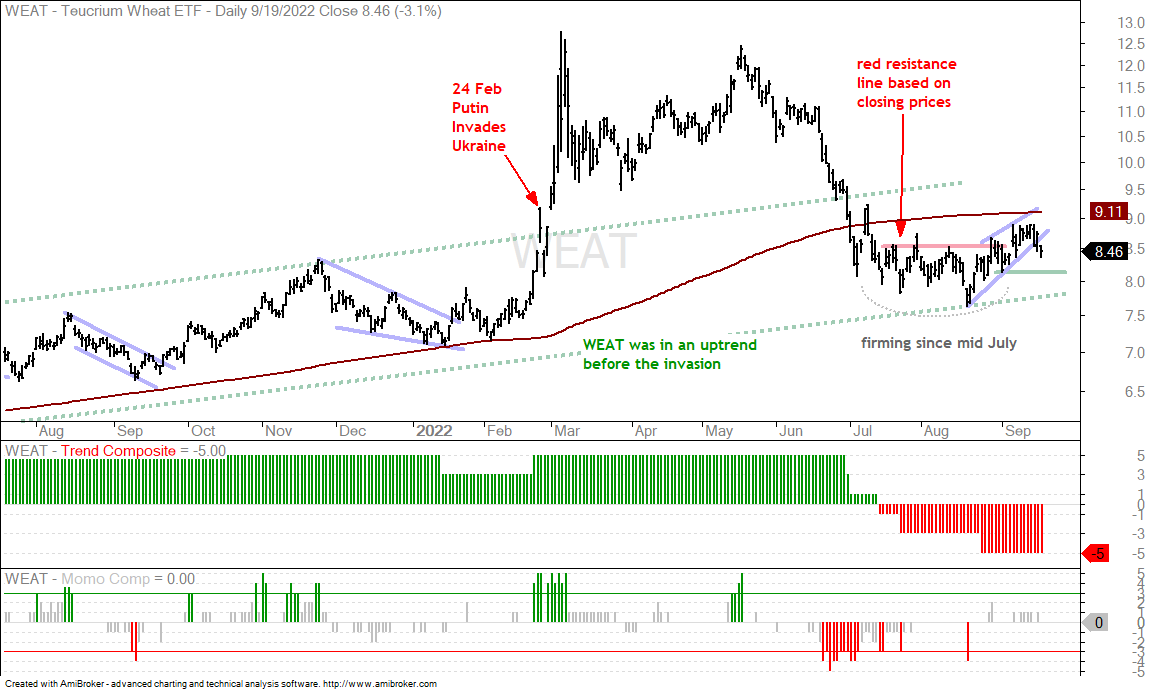
Agriculture and Wheat ETFs Hold Up (DBA, WEAT)
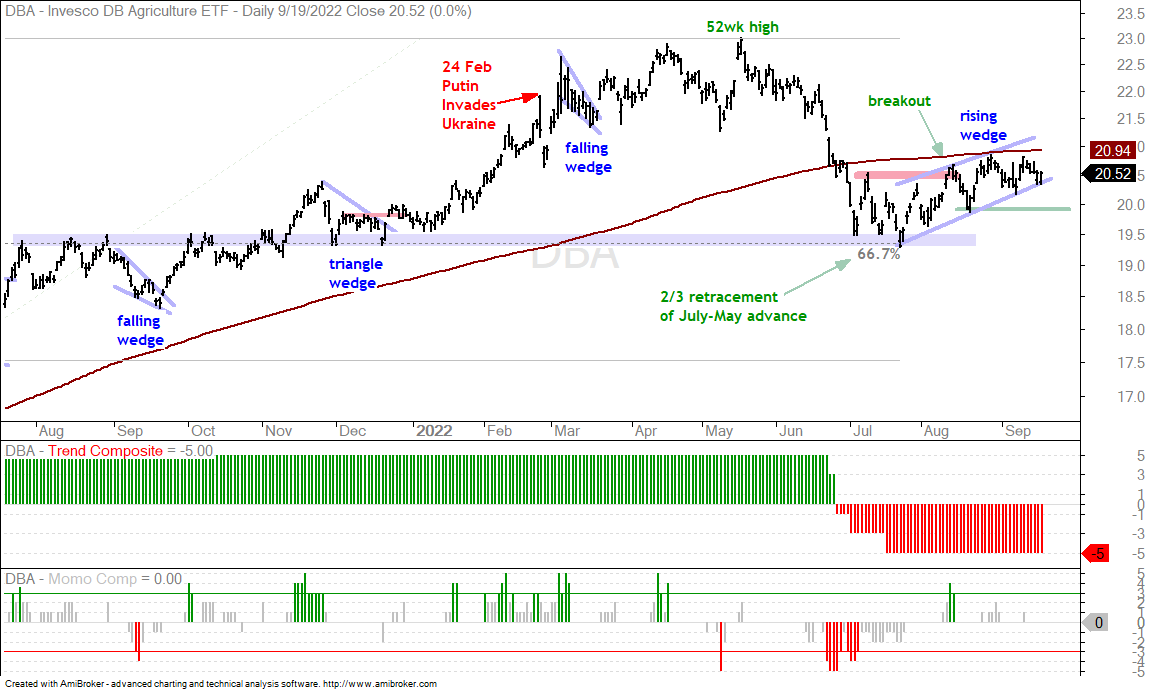
The next chart shows the DB Agriculture ETF (DBA) holding its rising wedge and immediate uptrend. The ETF is just below its slightly rising 200-day SMA and holding up better than most commodity and stock based ETFs. DBA is right at the lower line of the rising wedge for its first test. I am using the mid August low to mark key support and a close below 19.91 would reverse this two month uptrend.
The Wheat ETF (WEAT) fell the last three days and broke the wedge line. This is a short-term negative, but I am giving WEAT a little more wiggle room. Overall, the ETF fell back into the prior uptrend (green rising channel) and firmed from mid July to August. The breakout at 8.5 was bullish and I am marking support at the late August low. A close below 8.16 would argue for a re-evaluation.
Note that I will cover the Uranium ETF (URA), Palladium ETF (PALL), Lithium Battery Tech ETF (LIT), base metals, gold, bonds, the Dollar and more in tomorrows video and Thursday’s commentary.
You can learn more about my chart strategy in this article covering the different timeframes, chart settings, StochClose, RSI and StochRSI.
")