The markets are dealing with some serious systematic shocks and volatility remains well above average across the board. First and foremost, the Composite Breadth Model is bearish and this means there is a strong headwind for stocks (at best). At worst, we are in a bear market and there could be further downside.
Even though stocks are largely out of favor, there are some secular themes emerging and some are even accelerating. First, defense spending is likely to remain strong for years to come. Second, the push towards clean-energy will be accelerated. As an aside, note that railroads are much more fuel efficient than trucks. Third, commodity prices could remain high because the Russian sanctions could extend for months, if not years. Only regime change in Russia would change the outlook for sanctions.
Oil is up some 30% in six trading days and this is clearly a shock to the system. Oil, of course, is not the only commodity surging as there are also systematic shocks in agriculture and metals. Wheat is up over 70% since February. Nickel was up some 150% and the LME halted trading today. These are unprecedented moves in both price and exchange action. Input costs are rising across the board and this could lead to demand destruction. The four charts below shows oil, wheat, soybeans and copper (via TradingView – affiliate link here)
The S&P 500 Trend Breadth Model turned bearish as the percentage of new lows expanded on Monday. The chart below shows the Composite Breadth Model moving to -3, which means four of the five inputs are bearish. The initial bearish signal was on February 16th and we are seeing weakness expand.
The SPY breakdown in January is the dominant long-term feature and the falling wedge defines the immediate downtrend. SPY forged a massive reversal day on the day of the invasion (24-Feb) and surged another 2.2% the next day (Friday, 25-Feb). This seemed encouraging, but price action after this two day reversal was mixed (last week). SPY then closed below the February closing low on Monday with a sharp decline. This establishes first resistance in the 440 area.
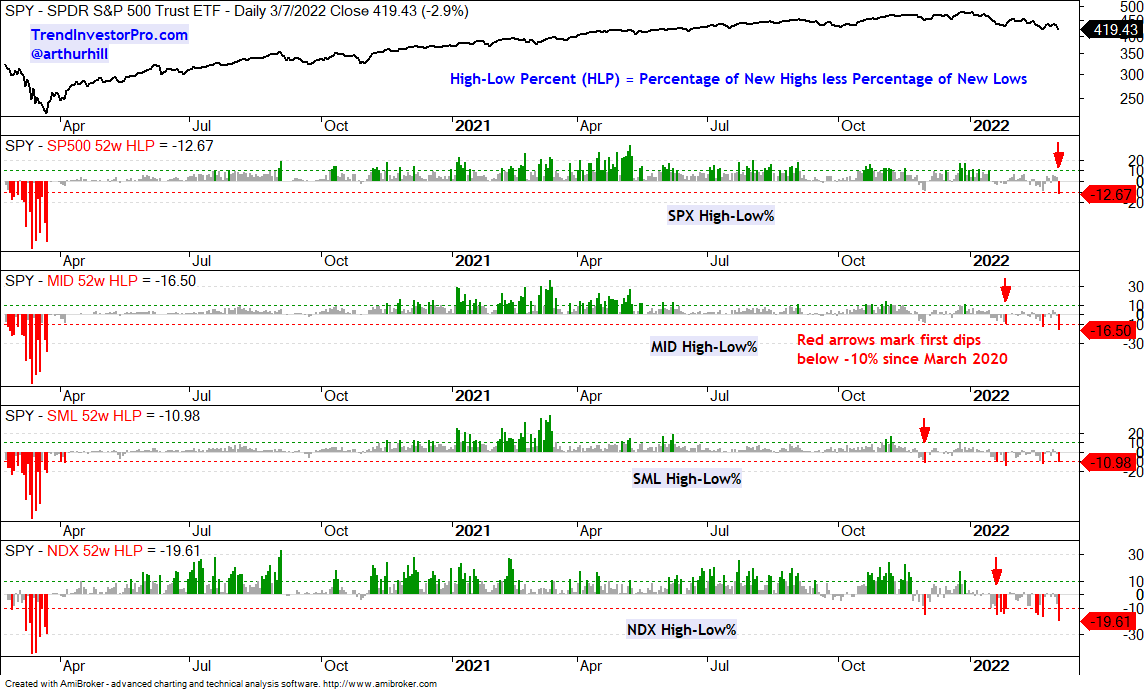
SPY and QQQ Lead the Way Lower
There are a few uptrends out there and even a few that are confirmed with the Trend Composite. The first chart shows the Aerospace & Defense ETF (ITA) with a failed breakout in October when the Trend Composite was negative. There was a whipsaw from the Trend Composite in January and a bullish signal three days ago. This signal is accompanied by a big price breakout on the chart. Also notice that ITA formed higher lows when SPY formed lower lows (December to February).
QQQ is following the SPY script as it failed around 350 and fell sharply the last three days. D
The S&P SmallCap 600 SPDR (IJR) is holding up better than SPY and QQQ short-term because it has yet to close below the February closing low. Long-term, however, IJR is weaker than SPY and QQQ because it is below its March 2021 low. SPY is not even close to this low. The price sequence looks like a sharp decline and a consolidation. This makes the consolidation a rest within a bigger downtrend and a bearish continuation pattern. A break above the February-March highs is needed to negate this bearish scenario.
The Trend Composite aggregates trend signals in five trend-following indicators: 5-day ROC of 125-day SMA, Bollinger Bands (125,1), Keltner Channels (125,2,125), CCI (125) based on Closing Prices and StochClose (125, 5). You can learn more about the Trend Composite here.
Treasury bonds remain all over the place. As noted on Friday, inflationary pressures are weighing on the bond market, but the war in Ukraine is providing a safe-haven bid. The chart below shows the 10-yr Treasury Yield, which is the mirror image to the 10yr Treasury bond. A bullish chart for the 10-yr Treasury Yield implies a bearish chart for the 7-10 Yr Treasury Bond ETF (IEF). The 10-yr Yield chart is bullish as the yield broke out of a big triangle consolidation and hit a new high in February. The yield fell back to the breakout zone as money moved into bonds the last three weeks (safe-haven). However, this looks like a normal throwback after the breakout and support is at hand. Also notice that the throwback retraced around half of the prior gain. Thus, we could see the yield bounce from here and bonds move lower.
Banks Follow Finance Sector Lower
I was concerned with the finance sector and banks because of Russian sanctions, the meltdown in European banks and the connectedness of global finance. The Trend Composite turned negative for the Finance SPDR (XLF) on March 1st and on Monday for the Regional Bank ETF (KRE). The Bank SPDR (KBE) and Insurance ETF (KIE) also triggered bearish. The chart below shows KRE with a lower high from January to February as it started underperforming SPY. The ETF broke support and the channel line with a sharp decline on Monday. These breaks confirm the trend reversal signal in the Trend Composite.
Semis and Materials Fail to Break Out
The Materials SPDR (XLB) and Semiconductor ETF (SOXX) were on my watchlist because they were holding up better than the broader market, but both failed to follow through and break resistance. Instead, the chart shows SOXX breaking its October low and extending its downtrend. Note that Ukraine is a major producer of neon gas, which is essential to semiconductor production. Palladium is also important and Russia exports account for around 33% of the global palladium market.
Cybersecurity and Aero/Defense ETFs Fall Back after Breakouts
The Cybersecurity ETF (CIBR) was not immune to broad market selling pressure as it fell sharply on Monday. Overall, CIBR is holding up better than the other tech-related ETFs because it exceeded its mid February high and is still well above its January-February lows. With a 5% decline the last three days, the ETF is also short-term oversold and in the 33-50 percent retracement zone. This is an area that could lead to short-term support and a bounce.
Even the Aerospace & Defense ETF (ITA) was not immune to broad market weakness as the ETF fell 4% in the last four days. This is not too surprising because ITA surged some 10% as it broke out last week. ITA was short-term overbought and a throwback towards the breakout zone is normal. Broken resistance turns first support and the throwback retraced 33-50 percent of the prior advance. This is the first area to watch for a bounce. Also note that the Trend Composite is positive.
You can learn more about exit strategies in this post, which includes a video and charting options for everyone.
Clean Energy ETFs Hold Up Well
The Trend Composite is negative for the clean-energy ETFs, but short-term relative strength is piquing my interest in this group. The PerfChart below shows the percentage for SPY, QQQ and seven energy-related ETFs since February (24 trading days). SPY and QQQ are down sharply, three of the four clean-energy ETFs are up 5% or more (FAN, ACES, ICLN), three are slightly down (PBW, TAN, PBD) and one is down around 2.7% (QLCN).
The chart below shows the Clean Energy ETF (PBW) in a downtrend, but firming since late January. The green and red arrow-lines mark a downswing, upswing and downswing. PBW surged from 50 to 60 in late February and then fell back the last five days. This could be a small falling flag and a breakout would be short-term bullish. Medium-term, a break above the February-March highs would reverse the downswing.
Strategic Metals ETF Falls Back from Breakout
The Strategic Metals ETF (REMX) attempted a breakout last week, but fell back over the last two days. Lithium accounts for a share of REMX and the Lithium Battery Tech ETF (LIT) remains in a downtrend as it forged another lower low on Monday. REMX is holding up better because it remains above last week’s low so far. Overall, REMX retraced around 50% of the prior 88% advance with a falling channel of sorts. This looks like a correction after the big advance. REMX formed higher lows from January to February and this relative strength caught my eye. Even though the first breakout attempt failed, the chart still looks constructive and another surge above 110 would put the breakout back in play.
Uranium ETF Holds Its Breakout
The Uranium ETF (URA) broke out of a falling channel with a surge in late February and this breakout is holding. URA hit a new high in November and then fell some 38%. Despite a big percentage decline, the ETF held above the August low and the decline looks like a correction within a bigger uptrend. The Trend Composite turned negative twice because the last two downswings were big in percentage terms, but were still corrections after even bigger advances. Here is a link to Rohan Reddy’s interview covering URA on CNBC.
Gold Leads as Silver Joins with a Breakout
The Gold SPDR (GLD) is leading the market with a massive surge, breakout and 52-week highs the last few weeks. GLD is up over 10% since February and going a bit parabolic. The triangle breakout on February 14th was the last signal and I do not see a setup on the chart. Just a strong uptrend. Here is a link to Chris Verrone covering gold, Apple, Staples and Utilities on CNBC.
The Silver ETF (SLV) is playing a little catchup and going for a breakout with a move above the mid November high. Overall, a large Double Bottom is taking shape with two lows around 20 and the November high around 23.5. SLV closed above the November high for the breakout and this argues for higher prices in the coming weeks and months. Note that the Trend Composite turned positive on February 23rd. Keep in mind the silver is a very volatile commodity and there could be some big price swings, in both directions.
Oil Continues its Parabolic Move
West Texas Intermediate ($WTIC) surged from 92 to 119 the last six days as the advance goes parabolic. These moves are a challenge for analysis because the charts are skewed. The trend is up and strong, but the parabolic nature of the move reflects a sharp increase in volatility. The only level to even consider watching is the 146 area, which marks the 2008 high.
The Oil & Gas Equipment & Services ETF (XES) caught fire the last two days as it becomes abundantly clear that more drilling is needed to fill the gaps in the market. XES broke out of a big triangle in January, worked its way higher into February and surged some 16% this month. This is not a target, but note that XES was near 500 in June 2014.
")