An Oversold Bounce is One Thing – A Bullish Breadth Thrust is Another
- Arthur Hill, CMT
")
Panic selling and oversold extremes gave way to a rip higher last week. Stocks are poised to open strong on Monday as the market reacts positively to tariff news. Last week’s bounce is considered an oversold bounce within a bear market. Thrust signals are setting up, but strong follow through is needed to trigger actual signals. This report will first review the panic indicators and the short-term oversold condition, and then show what it would take to move from a bear market bounce to a bullish breadth thrust.
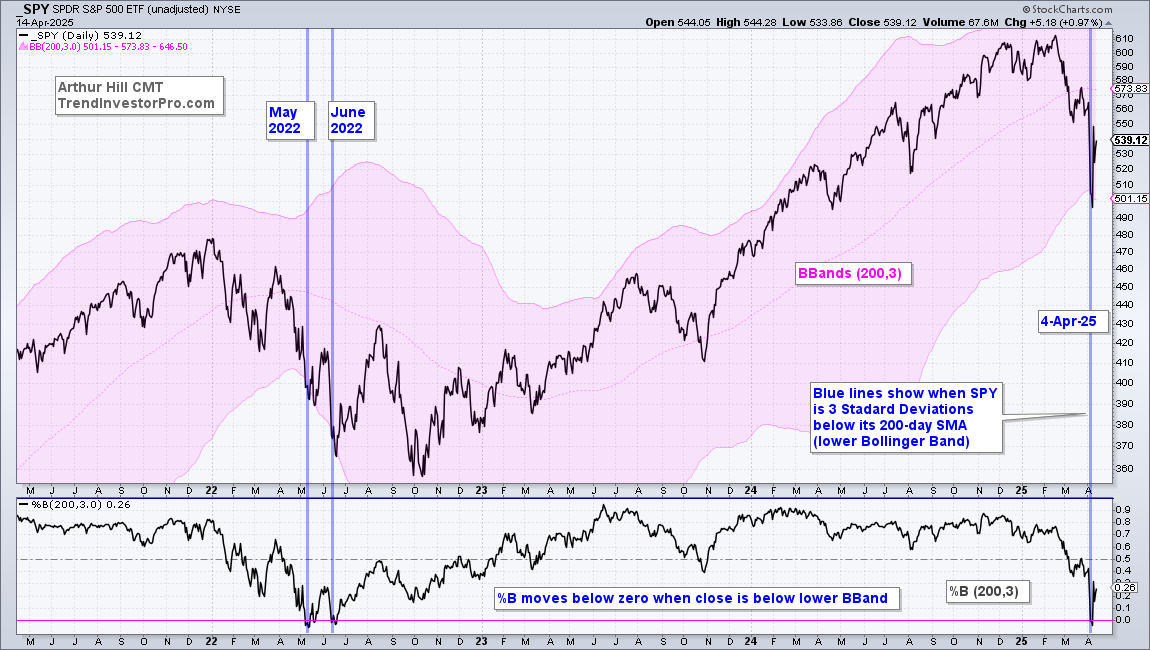
3 Standard Deviation Decline
The chart below shows SPY dipping below the lower Bollinger Band (200,3) on April 4th. This means SPY was more than 3 standard deviations below its 200-day SMA, which is an extreme oversold condition. For reference, SPY has reached this extreme 27 times in the last 25 years. Such a move reflects panic selling pressure that often gives way to a bounce, which we got on Wednesday, April 9th.
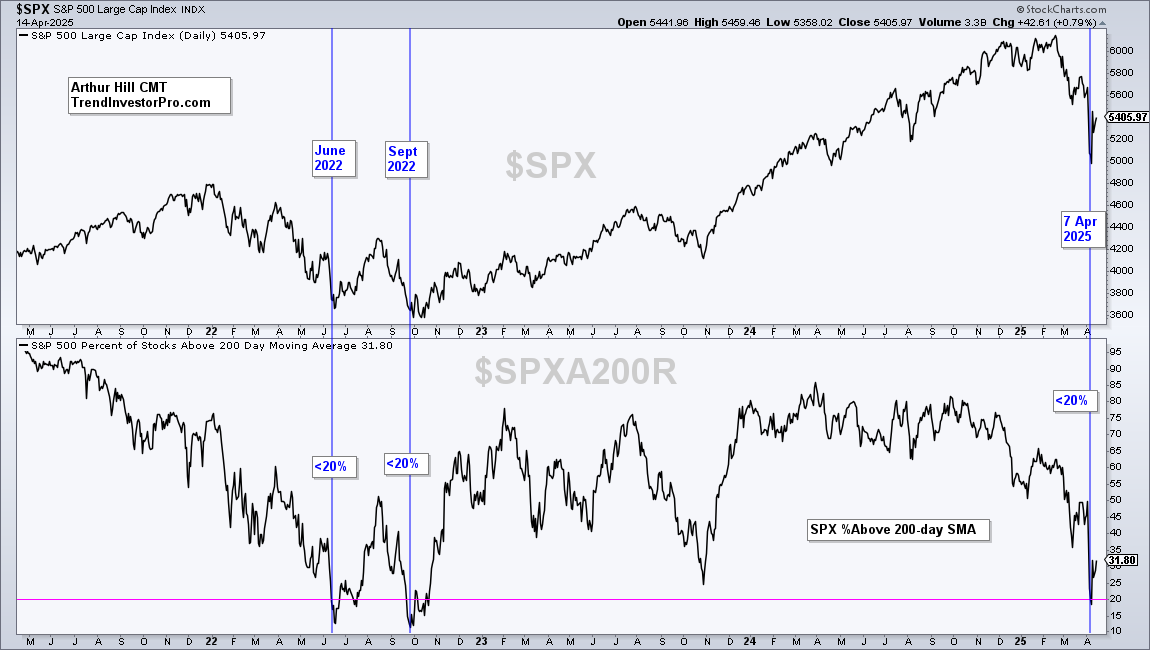
Oversold Extremes for Long-term Breadth
The next chart shows S&P 500 Percent Above 200-day SMA ($SPXA200R) dipping below 20% on April 7th to become extremely oversold. This means more than 80% of S&P 500 stocks were below their 200-day SMAs as traders sold pretty much everything. Extremely oversold readings in long-term breadth foreshadowed bounces June 2022, September 2022 and April 2025.
NYSE Zweig Breadth Thrust Sets Up
The NYSE Zweig Breadth Thrust is setting up as it finished below .40 on Friday. Actually, this indicator has been below .40 for four of the last five days. Readings below .40 reflect a short-term oversold condition that could give way to a bounce. The indicator first dipped below .40 on April 4th and stocks rebounded last week.
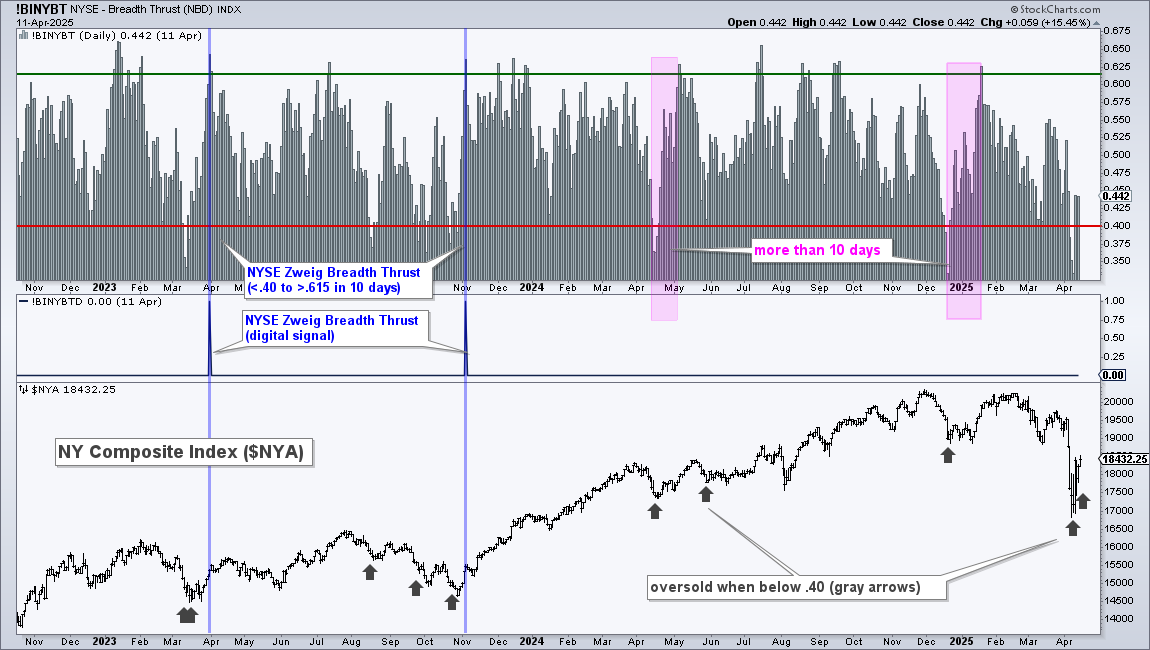
This indicator is also setting up for a possible Zweig Breadth Thrust. Currently, stocks are in the midst of an oversold bounce within a bigger downtrend. This would become a bullish Zweig Breadth Thrust should we see follow through and surge above .615 with 10 days. The countdown begins.
The Zweig Breadth Thrust indicator is the 10-day EMA of Advances/(Advances + Declines). Why did Zweig use a 10-day EMA? I believe he wanted to separate 1-5 day bear market bounces from bounces with follow through. The current bounce is just a bear market bounce and we need to see follow through within 10 days for a Zweig Breadth Thrust to trigger.
It is important to monitor more than one breadth indicator for thrust signals because you never know which one will trigger. The NYSE Zweig Breadth Thrust might miss, but the S&P 500 or S&P 1500 Zweig Breadth Thrust indicators may catch the signal, especially if Nasdaq stocks or small and mid caps lead. TrendInvestorPro monitors thrust indicators based on the percentage of stocks above their 20 and 50 day SMAs, and we have a breadth thrust index that aggregates thrust signals in over a dozen breadth indicators. This analysis continues for subscribers to TrendInvestorPro.
Recent Reports and Videos for Premium Members
- Testing the Zweig Breadth Thrust with an Exit Strategy
- Oil and Agriculture Lead as Uranium Sets Up
- Breadth Deteriorates, but Short of Bear Market Signal
- Safety is Relative (Healthcare, Utilities, Infrastructure)
- Trend Trio150 Signals for Dow 30 Stocks and SPDRs
- Click here to take a trial and gain full access.
This content is for subscribers. (Login or Subscribe)
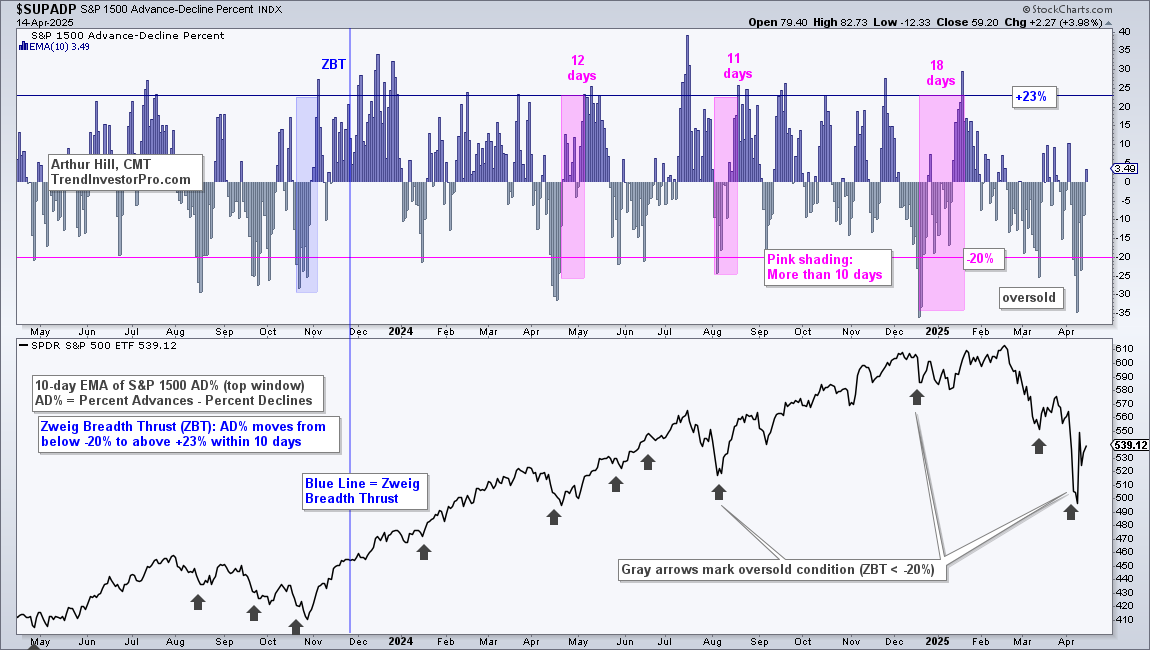
The next chart shows the S&P 1500 Zweig Breadth Thrust indicator becoming oversold on April 4th, 7th, 8th and 10th. This is a classic case of becoming oversold and remaining oversold. The extended oversold conditions reflect relative weakness in small and mid cap stocks, which dominate the S&P 1500. A move above +23% by April 25th would trigger a bullish Zweig Breadth Thrust for the S&P 1500.
Percent above 20 and 50 Day SMAs Set Up
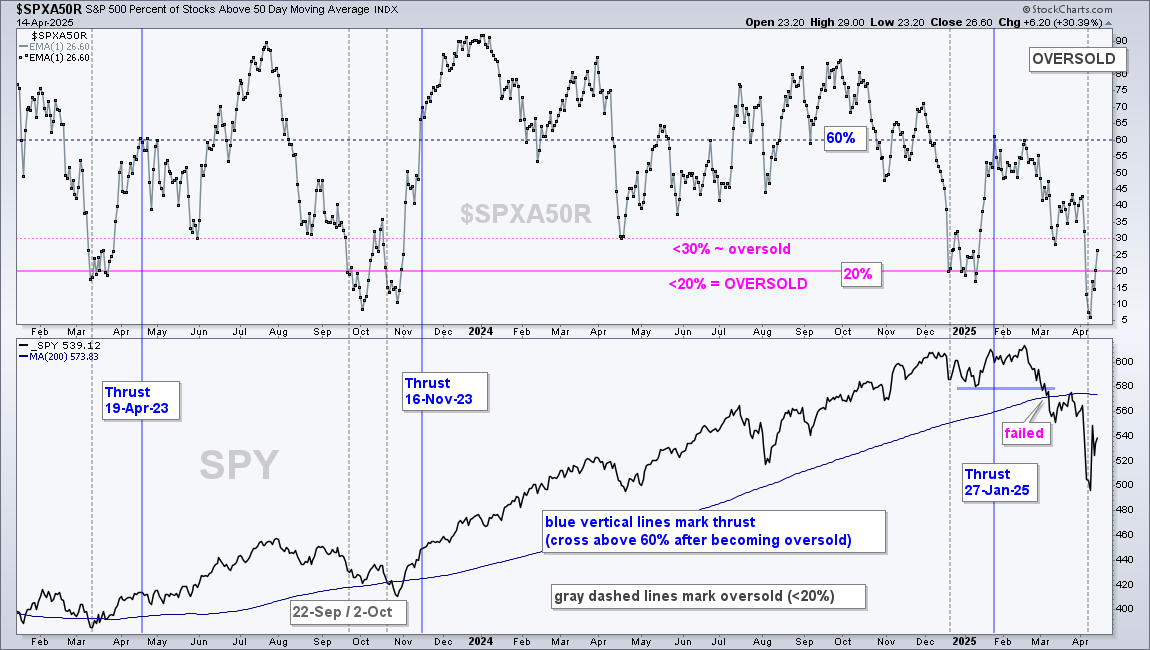
The next chart shows S&P 500 Percent Above 50-day SMA ($SPXA50R) moving below 20% to become oversold on April 4th. Oversold conditions extended as the indicator dipped to 5% on April 8th. SPY surged some 10% on April 9th and the indicator is back near 20%. Again, we are seeing an oversold bounce within a bear market, but follow through with a move above 60% is needed for a thrust signal (blue lines).
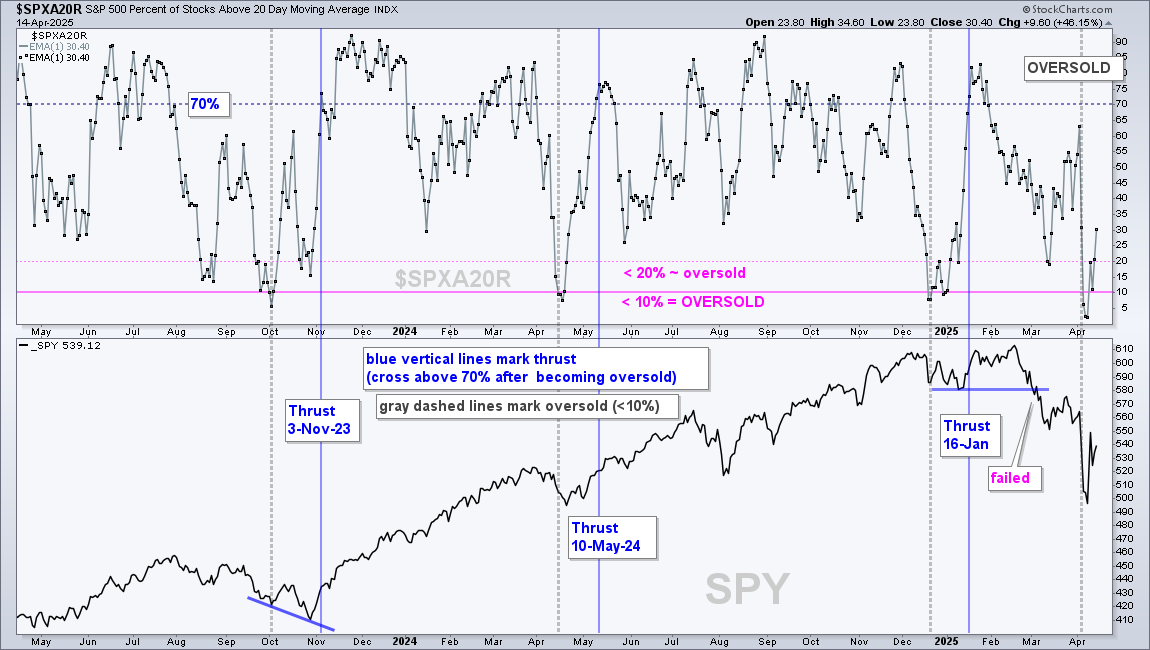
The next chart shows S&P 500 Percent Above 20-day SMA ($SPXA20R) becoming oversold with a move below 10% on April 4th and dipping to 2% on April 8th. With an oversold bounce on April 9th, the indicator move to the 20% area on Friday. This is just a bear market bounce for now. Follow through above 70% is needed to trigger a thrust signal.
Stocks moved from panic extremes to an oversold bounce this past week. Now is the real test. Bargain hunters and mean-reversion players step in at extremes and produce the initial oversold bounce. Follow through buyers are required to move from an oversold bounce to a bullish breadth thrust. Stay tuned…