Stocks started the new year with gains, but there were still some pockets of weakness. The Nasdaq 100 Next Gen ETF (QQQJ) fell as money shied away from high beta tech, weakness in transports weighed on the Industrials SPDR and the Materials SPDR fell over 1%. The Russell 2000 ETF gained as small-caps benefited from a plunge in the 20+ Yr Treasury Bond ETF, and a surge in the 10-yr Treasury Yield. Today’s commentary will review the big three (SPY, QQQ, IWM), cover the big move in bonds, assess the impact on gold and show the breakout in the Regional Bank ETF. We will also cover oil, some energy-related ETFs, the Biotech ETF (IBB), two Electric Vehicle ETFs and finish with two video gaming ETFs.
I wish you and your family a safe, healthy, and prosperous new year!
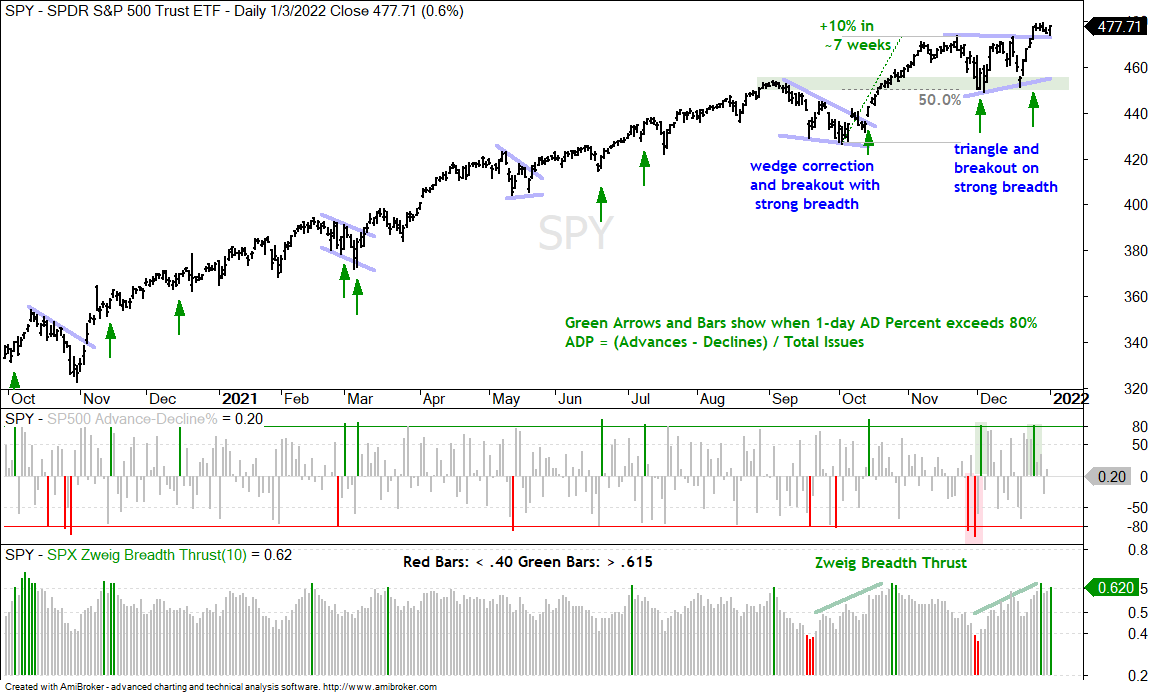
Zweig Breadth Thrust for SPY
SPY is setting the bullish tone with a consolidation breakout and Zweig Breadth Thrust at the end of December. SPY hit a new high in November and then consolidated as a triangle formed. A triangle within an uptrend is a bullish continuation pattern and SPY broke out with a surge to new highs. The ETF is holding this breakout with a smaller consolidation the last five days.
The first indicator window shows Advance-Decline Percent exceeding +80% on December 27th (green bar). This one-day breadth thrust shows strong upside participation and is the second for the month. The bottom window shows the Zweig Breadth indicator dipping below .40 in late November and then exceeding .615 on December 28th for a Zweig Breadth Thrust. Zweig originally required this move to occur within ten days but I have taken the liberty to relax this requirement.
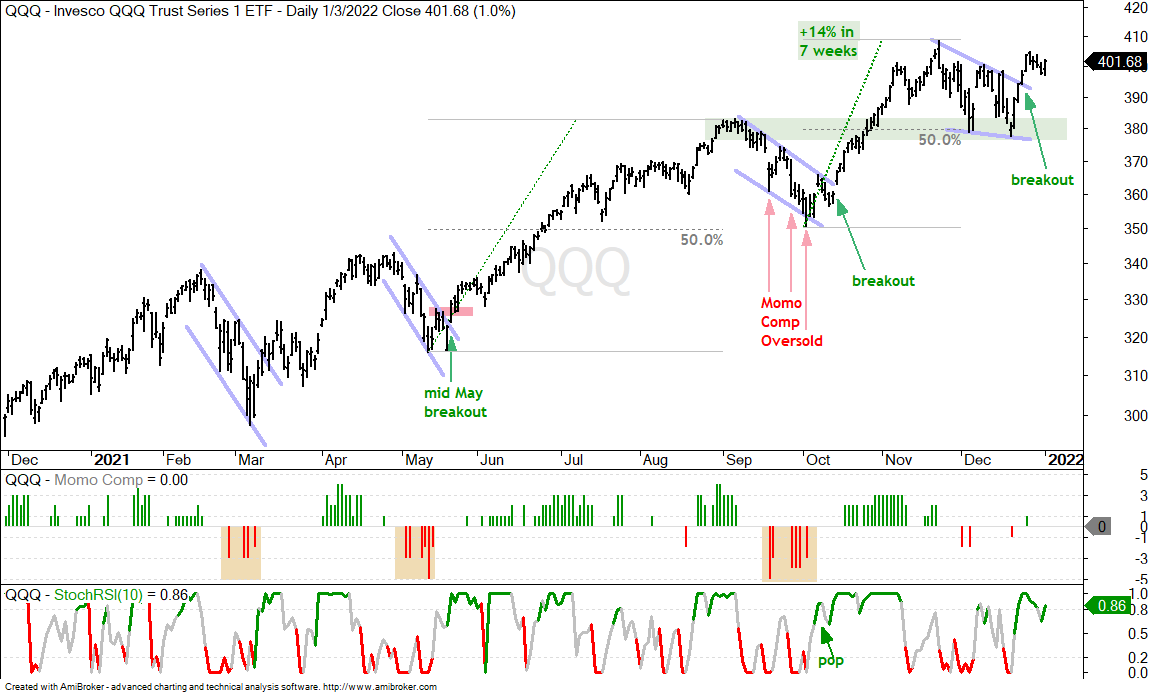
Large-caps Tech Follow SPY
Not to be left behind, QQQ is also breaking out of a bullish continuation pattern. The ETF surged to a new high in the second half of November and then corrected with the falling wedge. Elliott Wavers take note that this wedge has a zig down (A), a zag up (B) and zig down (C) for a classic ABC zigzag correction/pullback. The wedge retraced around half of the prior decline and found support at the prior resistance breakout. This is as classic as technical analysis gets. The wedge breakout in late December signals an end to the corrective period and a resumption of the bigger uptrend.
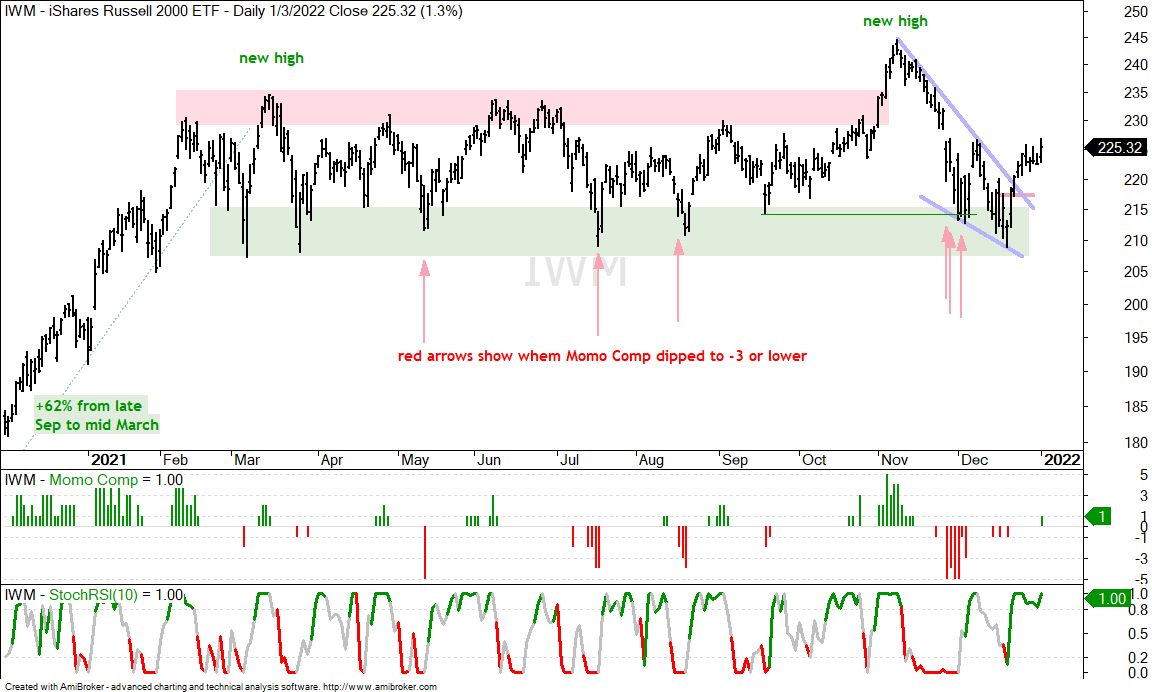
Small-caps Bounce, but Still Lag
The Russell 2000 ETF (IWM) also sports a falling wedge, which I drew after the fact. This wedge, however, is not considered a correction because IWM fell back to the summer lows. A robust corrective wedge would have stopped after a 33-67 percent retracement, as did QQQ. Nevertheless, IWM managed to hold support and break out with a surge the last two weeks. IWM is still the laggard of the group.
You can learn more about my chart strategy in this article covering the different timeframes, chart settings, StochClose, RSI and StochRSI.
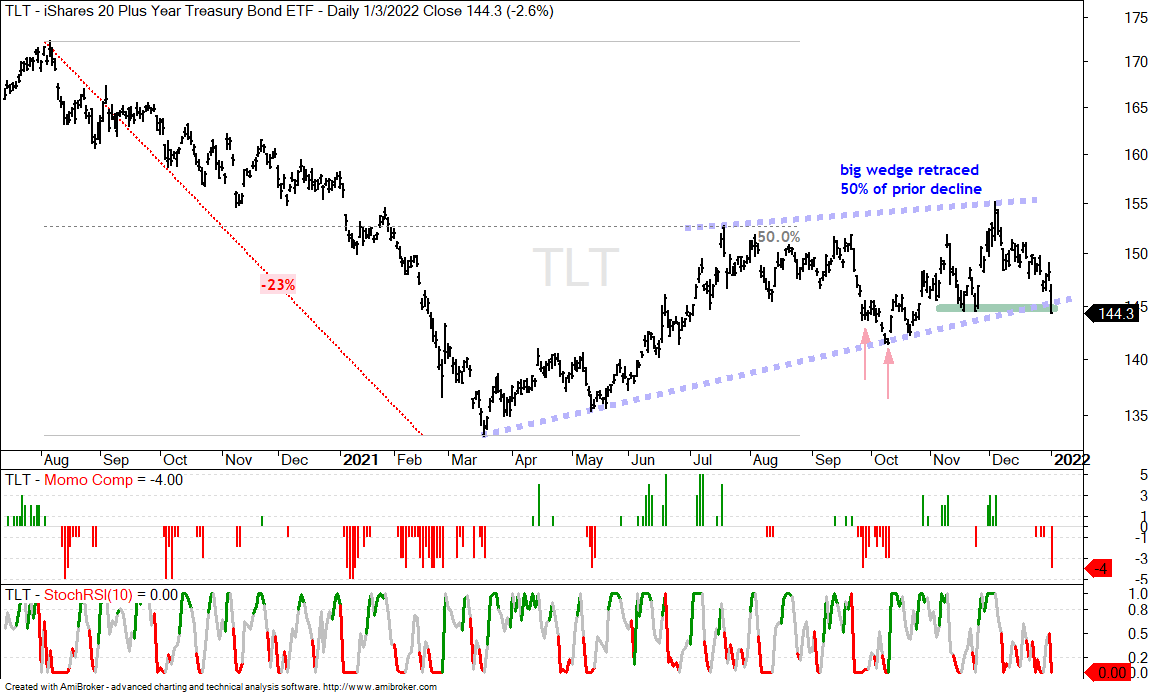
TLT Plunges as 10yr Yield Surges
Bonds get the prize for the biggest moves on the first trading days of the year. The 20+ Yr Treasury Bond ETF (TLT) fell 2.6% and closed below its mid November low. Long-term, the price chart for TLT is structurally bearish. TLT fell from August to March and recorded a 52-week low in mid March. This move is viewed as part of the primary trend (impulse move). The ETF then retraced half of this decline with a rising wedge, which is viewed as the secondary trend. Both the retracement and the pattern are typical for corrections within bigger downtrends. The medium-term trend was up as long as the wedge rose, but we are now seeing a wedge break. This breakdown is reversing the medium-term uptrend and signaling a continuation of the prior decline (long-term downtrend). This targets a move below the March low.
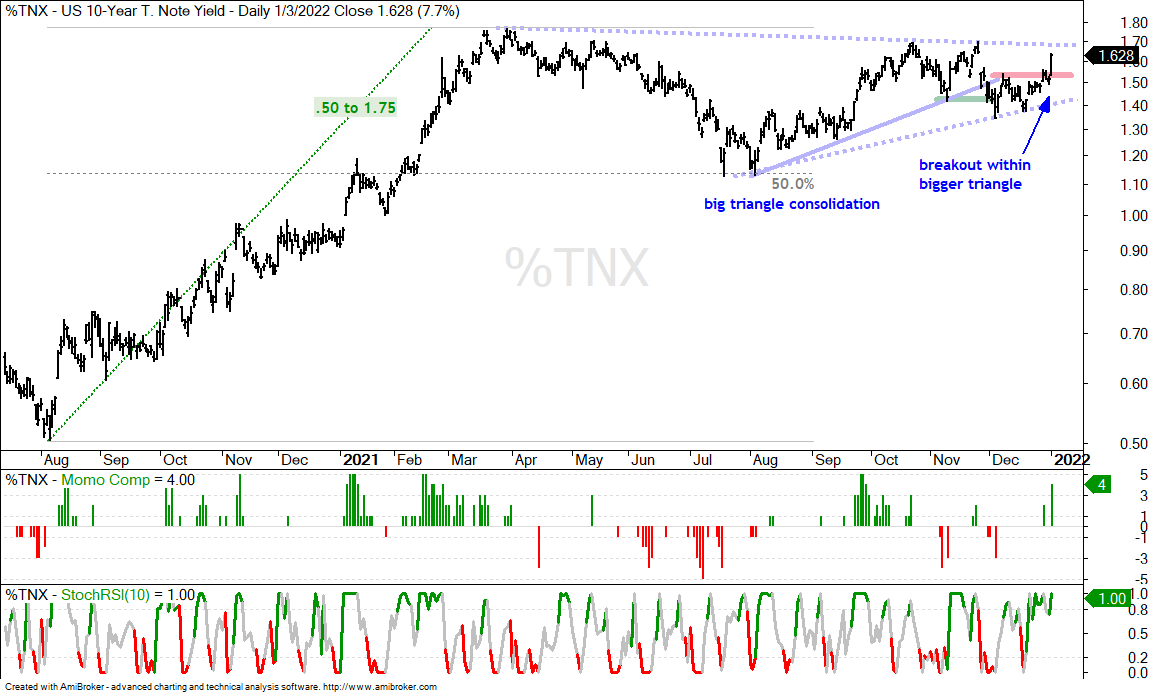
The 10-yr Treasury Yield is moving the other way with a short-term breakout within a bigger bullish continuation pattern. $TNX surged from .50 to 1.75 and then embarked on a long consolidation. The decline into the August low retraced around half of this prior advance. I was watching the swings within this consolidation for the early clues on the break. The swing was down with the breakdown in early December, but the yield firmed around 1.4% and broke out with an outsized move on Monday. This breakout increases the chances for a bigger breakout, which would end the big correction and signal a resumption of the bigger uptrend. 2% here we come.
Gold Reacts Negatively to Surge in Yields
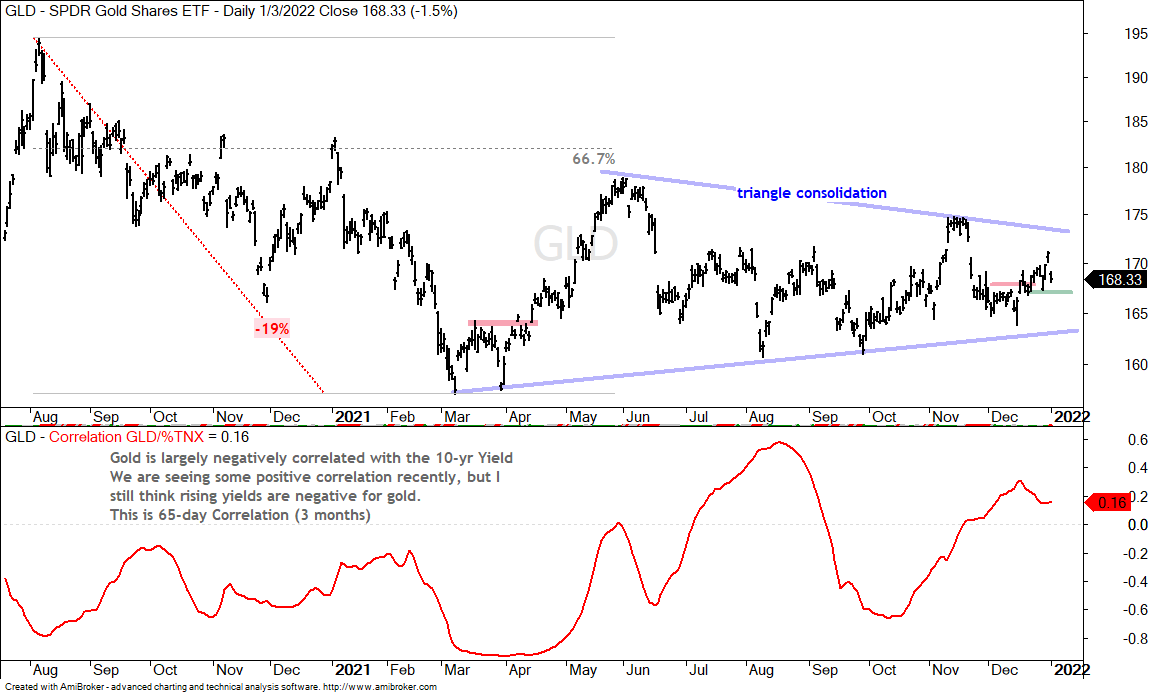
The Gold SPDR (GLD) fell hard as the 10-yr Treasury Yield surged. Taking a step back, the GLD chart shows a big decline from August to March, which is when the 10-yr Treasury Yield advanced and TLT fell. GLD then move into a consolidation phase as a triangle formed, just like the 10-yr Treasury Yield. I was watching the swings within this triangle and highlighted the short-term breakout in mid December. This breakout is getting a test with Monday’s sharp decline and a close below 166 would be negative. Long-term, a triangle break would be bearish and signal a continuation of the August-March decline.
Regional Bank ETF Extends on Breakout
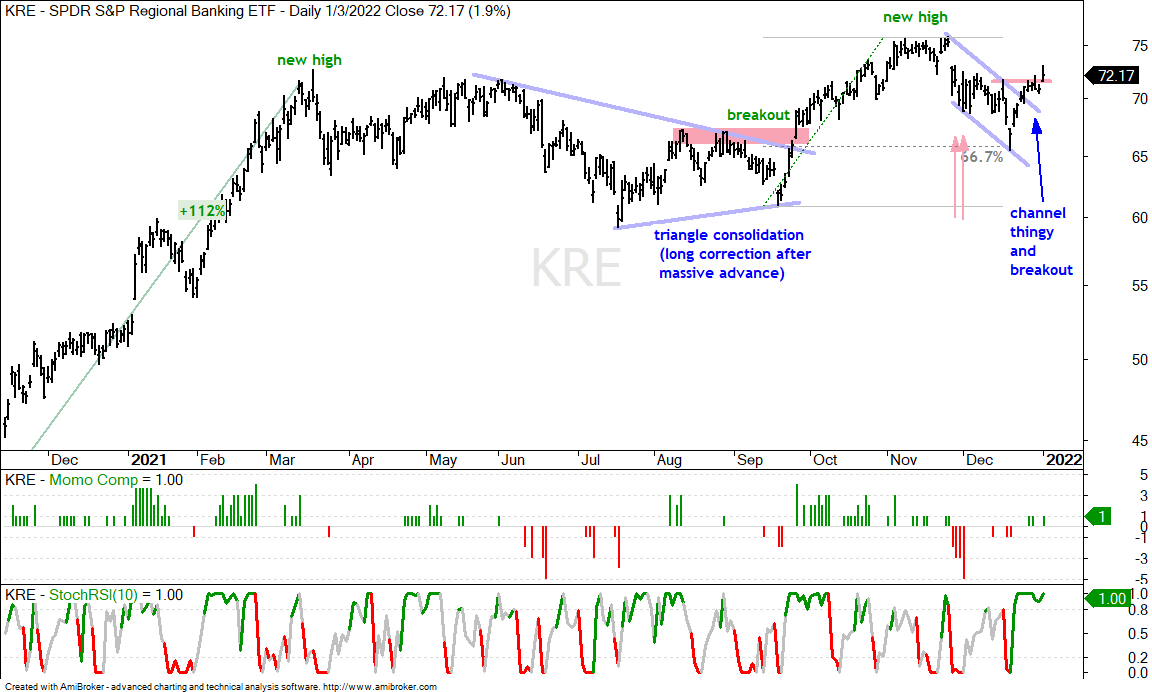
The Regional Bank ETF (KRE) and Bank SPDR (KBE) are the first ETFs that come to mind in a rising rate environment. These two are highly correlated so we only need one and I will go for KRE. The chart shows KRE advancing over 100% into March, consolidating into summer and breaking out in late September. KRE hit another new high and then corrected with a falling channel thingy that retraced around 2/3 of the prior advance. This pattern is a “thingy” because it does not exactly look like a flag, but it is a correction after a strong advance and the recent breakout signals an end to that correction.
Biotech ETF Attempts to Reverse Downswing
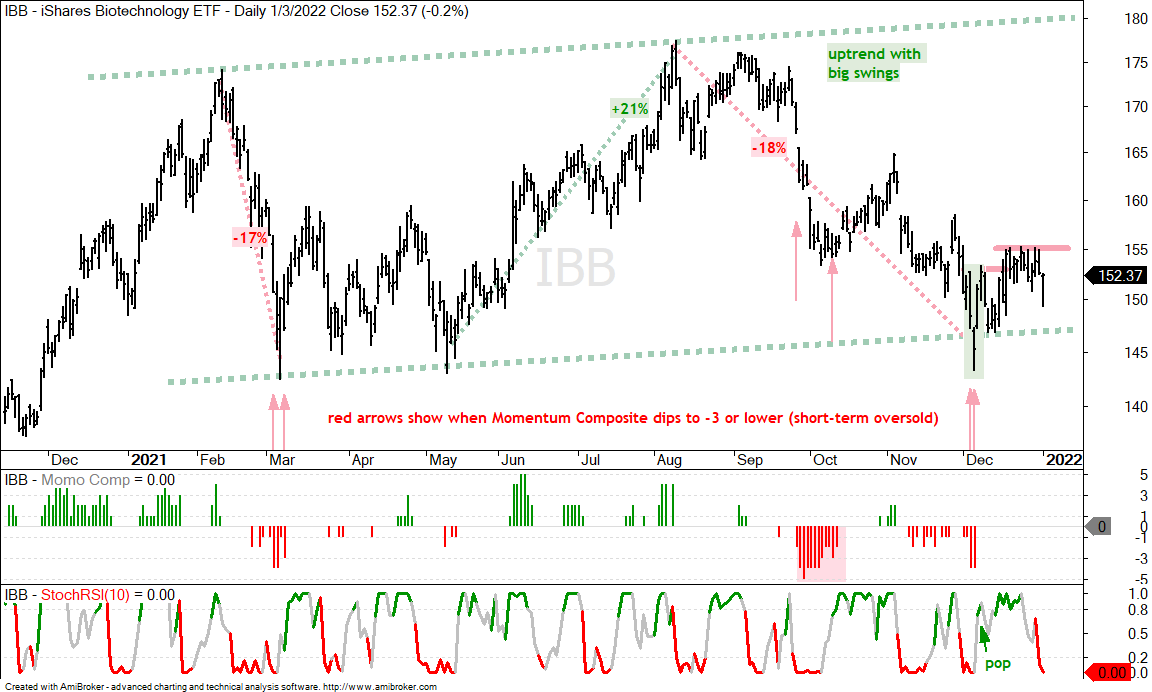
The Biotech ETF (IBB) continues to do what biotechs do best: swing big. Overall, IBB is in an uptrend over the past year with some pretty big swings (-17%, +21% and -18%). The current swing is still down, but there are signs that this swing is reversing. The ETF became oversold in early December (red arrows) as the Momentum Composite dipped to -4 twice and there was a StochRSI pop on December 8th. There was also a three day reversal when the ETF dipped below 145 (green shading). IBB established short-term resistance near 155 the last few weeks and a breakout here would further reinforce the reversal.
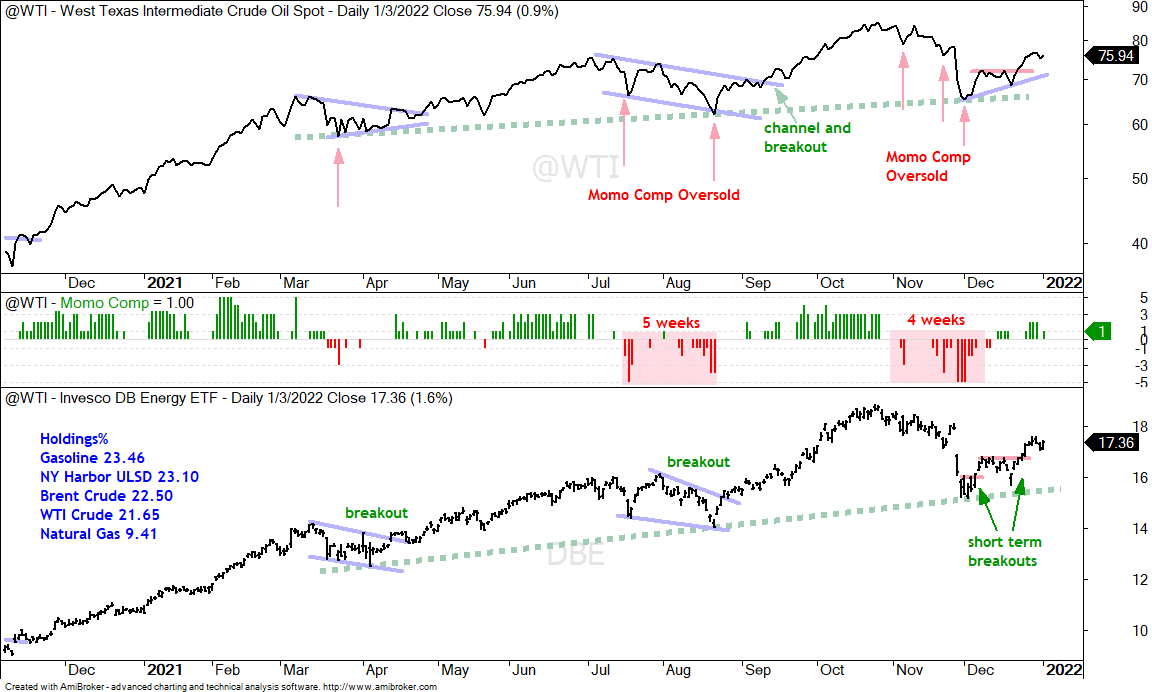
Oil Holds Upturn as Energy ETFs Break Out
Oil ticked up .9% on Monday and remains in both a long-term and short-term uptrend. Long-term, West Texas Intermediate ($WTIC) sports higher lows since March (green dotted line) and higher highs. Short-term, WTI turned up in early December and broke short-term resistance at 72 on December 23rd. The DB Energy ETF (DBE), which is the tradable instrument, triggered short-term breakouts on December 7th and 23rd.
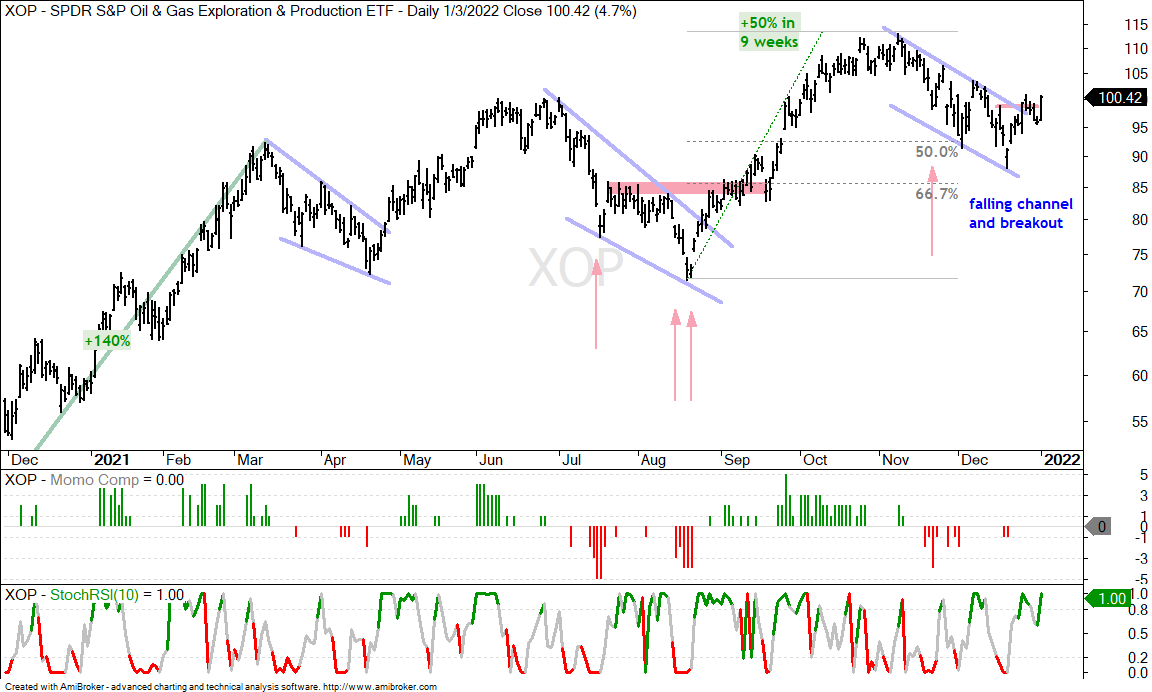
Energy-related ETFs got a boost on Monday with the Energy SPDR (XLE), Oil & Gas Exploration & Production ETF (XOP) and Natural Gas ETF (FCG) reinforcing their flag/channel breakouts. All three hit new highs in November and then corrected into December with falling channel thingies that retraced around half of the August-November advance. All three are breaking out and all three are highly correlated. The chart below shows XOP with a breakout attempt in late December, short pullback into yearend and surge on Monday.
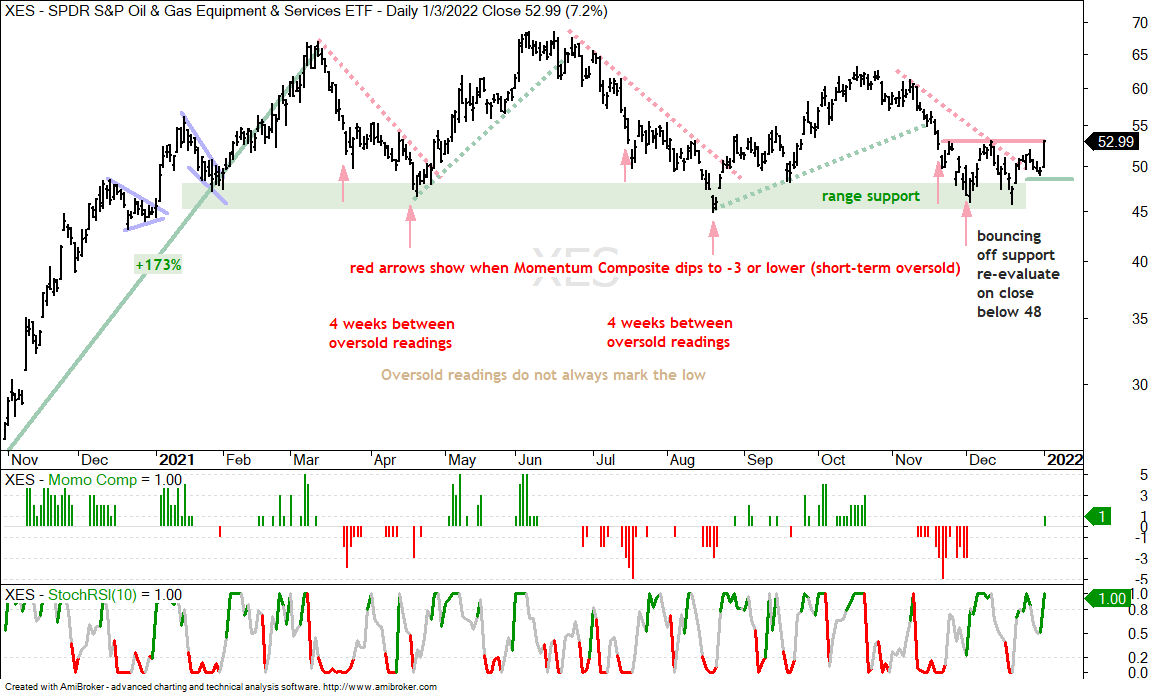
The Oil & Gas Equipment & Services ETF (XES) is a little different because it tested the lows extending back to January 2021 the last few weeks. Overall, the ETF remains range bound with swings bigger than the Biotech ETF. These swings are between 25 and 50%. XES is getting a strong bounce off support and reversing the downswing. Note that this is one volatile ETF and I would consider some appropriate position sizing. Smaller positions are warranted because of the high volatility (risk).
You can learn more about exit strategies in this post, which includes a video and charting options for everyone.
Electric Vehicle Turn Up with Uptrends
The Electric Vehicle ETFs are in uptrends overall and reversed their short-term downswings. The first chart shows the Autonomous EV ETF (DRIV) with a surge from late October to January and then a zigzag uptrend since early 2021. The ETF surged to a new high in November with a 20% surge, corrected with a 2/3 retracement and broke out of a falling wedge the last two weeks. These patterns are everywhere: surge, falling channel/wedge, 50-67 percent retracement and breakout.
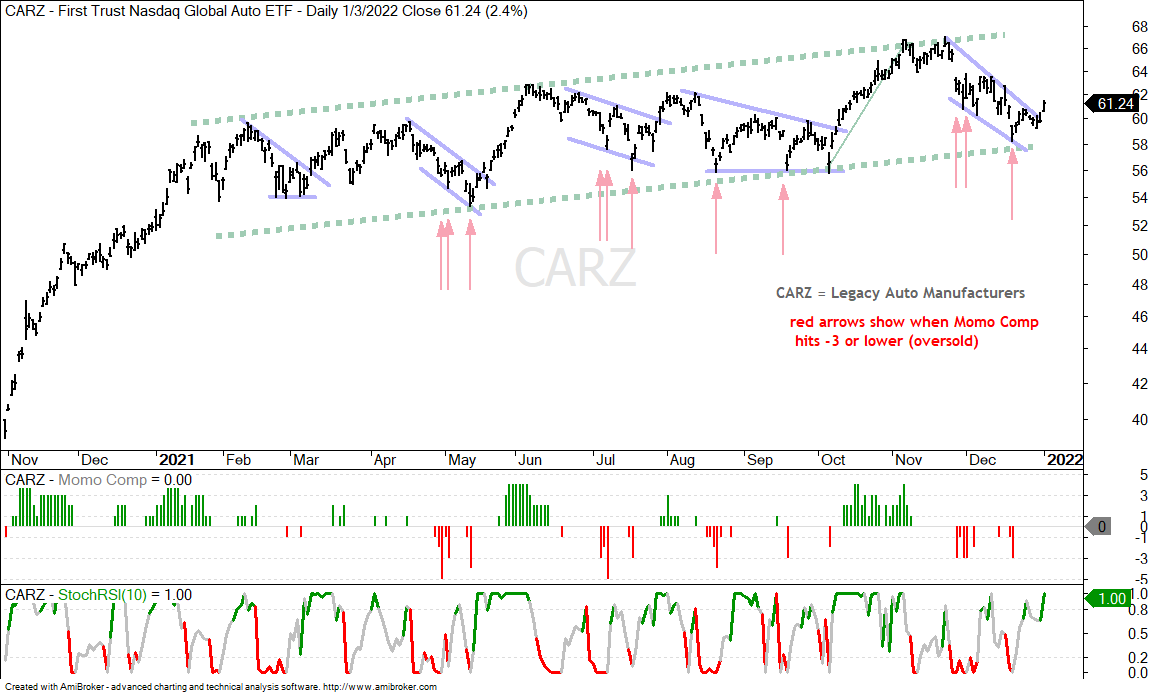
The next chart shows the Global Auto ETF (CARZ) with a zigzag uptrend and deeper pullback in December. The ETF neared the lower line of the rising channel with this wedge and broke out with a surge on Monday.
The Momentum Composite aggregates signals in five momentum indicators. RSI(10) is oversold below 30 and overbought above 70. 20-day StochClose is oversold below 5 and overbought above 95. CCI Close (20) is oversold below -200 and overbought above +200. %B (20,2) is oversold below 0 and overbought above 1. Normalized ROC (10) is oversold below -3 and overbought above +3. Normalized ROC is the 10-day absolute price change divided by ATR(10). -3 means three of the five indicators are oversold and +3 means three of the five are overbought.
The Momentum Composite and StochClose are part of the TIP Indicator Edge Plugin for StockCharts ACP. Click here for more details.
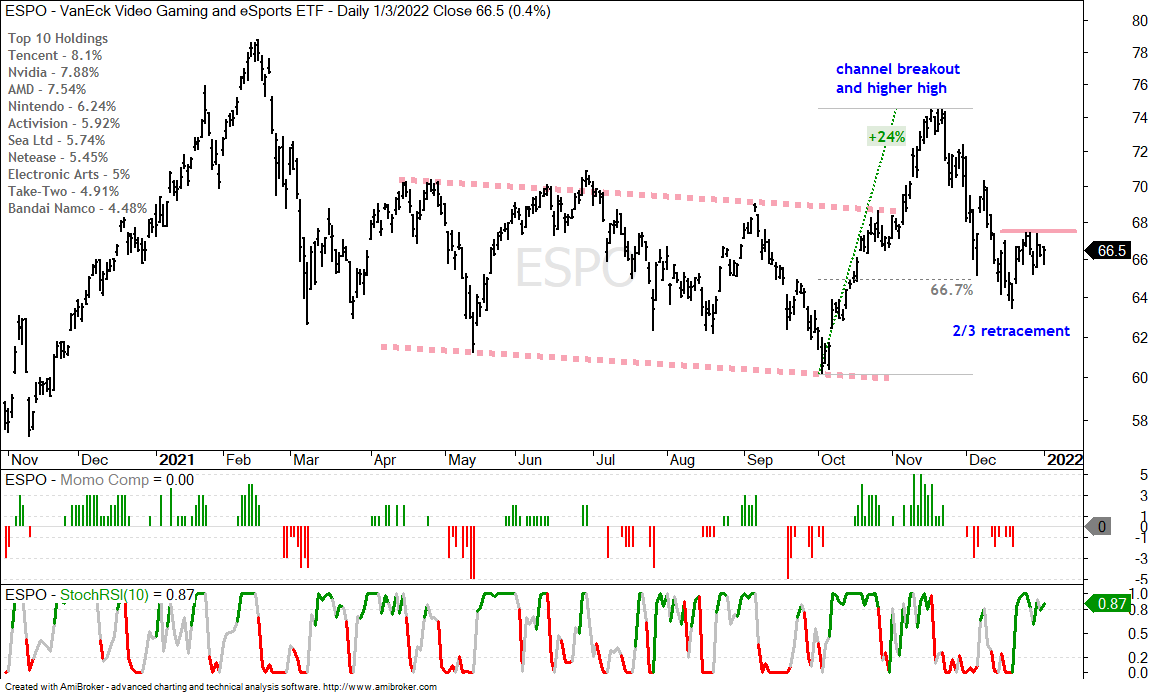
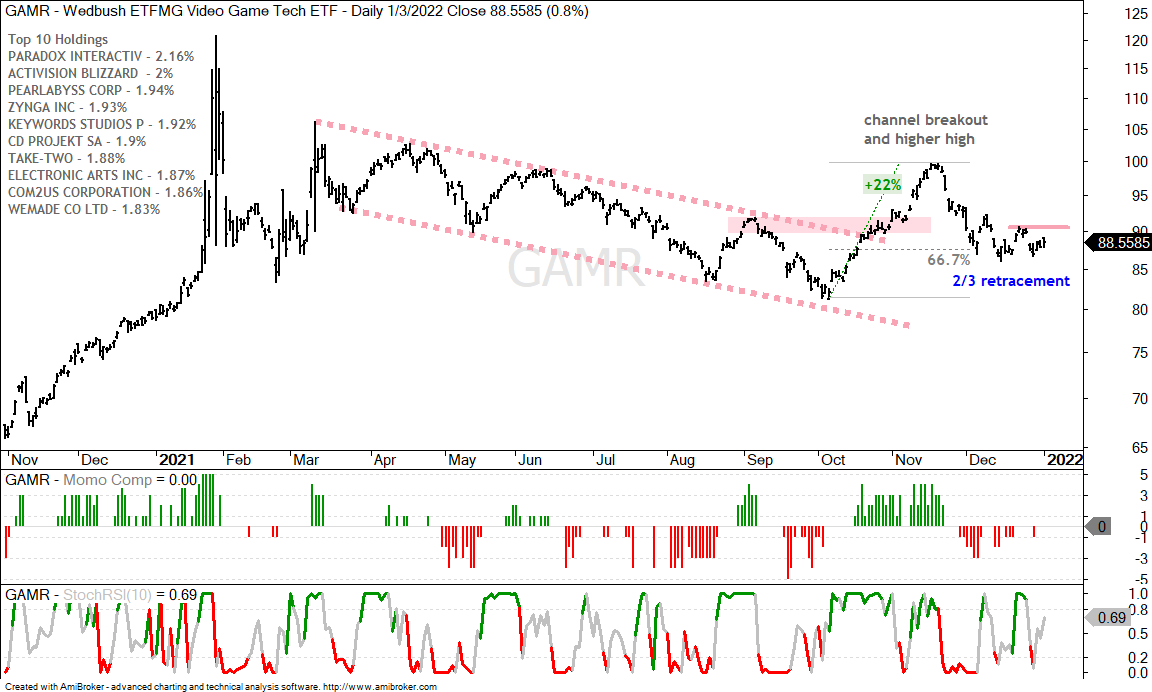
Video Gaming ETFs Hit Potential Reversal Zones
Two video gaming ETFs are setting up after pullbacks. Gaming is the key word here because these ETFs have above average volatility (risk). Their charts have similar characteristics in that they broke out of falling channels with big moves in October-November (impulse move), fell back in December and retraced around 2/3 of the advance (corrective move). The channel breakout and higher high point to a trend change. The pullbacks near potential reversal zones based on their retracements. The ETFs firmed a bit the last few weeks and breaks above the late December highs would be bullish. Each chart shows the top ten holdings and both have several non-US stocks.
")