Stocks were hit with a double whammy the last three trading days: the Omicron plunge on Black Friday and the Powell plunge on Tuesday. These, at least, seem to be the reasons given in the financial media. SPY fell 2.2% on Friday, rebounded somewhat on Monday and then fell 2% on Tuesday. SPY closed below the Friday low. QQQ fell 1.5%, but managed to hold above Friday’s low and is still the strongest of the three. IWM fell 2% and is down around 10% the last three weeks.
Programming Note: There is a lot going on this week so I accelerated the publishing schedule. Instead of Thursday and Friday, I published on Monday, Tuesday and Wednesday. I will have a short update on Thursday and hit the bar early on Friday, even though I picked a bad week to quit drinking.
IWM Hits Support Zone
The chart below shows November starting out with a bang as IWM advanced 6% the first week and hit a new high. November is also the second strongest month of the year from a seasonality standpoint. IWM then started to pull back in mid November, but this pullback did not find support in the breakout zone and accelerated the last few days. The ETF is now testing a support zone extending back to March and the Momentum Composite has been oversold the last three days (-3 or lower). Oversold conditions and support argue for a bounce. Watch for a StochClose pop above .80 or some other short-term bullish catalyst.
The Momentum Composite aggregates signals in five momentum indicators. RSI(10) is oversold below 30 and overbought above 70. 20-day StochClose is oversold below 5 and overbought above 95. CCI Close (20) is oversold below -200 and overbought above +200. %B (20,2) is oversold below 0 and overbought above 1. Normalized ROC (10) is oversold below -3 and overbought above +3. Normalized ROC is the 10-day absolute price change divided by ATR(10). -3 means three of the five indicators are oversold and +3 means three of the five are overbought.
The Momentum Composite and StochClose are part of the TIP Indicator Edge Plugin for StockCharts ACP. Click here for more details.
SPY Becomes Oversold
The S&P 500 SPDR (SPY) is also oversold with four of the five indicators breaching their oversold levels (yellow shading). The Momentum Composite dipped to -3, SPX Percent of Stocks above 20-day SMA dipped below 20%, 4-week High-Low Percent dipped below -40% and 13-week High-Low Percent dipped below -20%. 4-week High-Low Percent is the percentage of 4-week highs less the percentage of 4-week lows. These are all short-term indicators best suited for mean-reversion signals (short-term oversold conditions within a bigger uptrend).
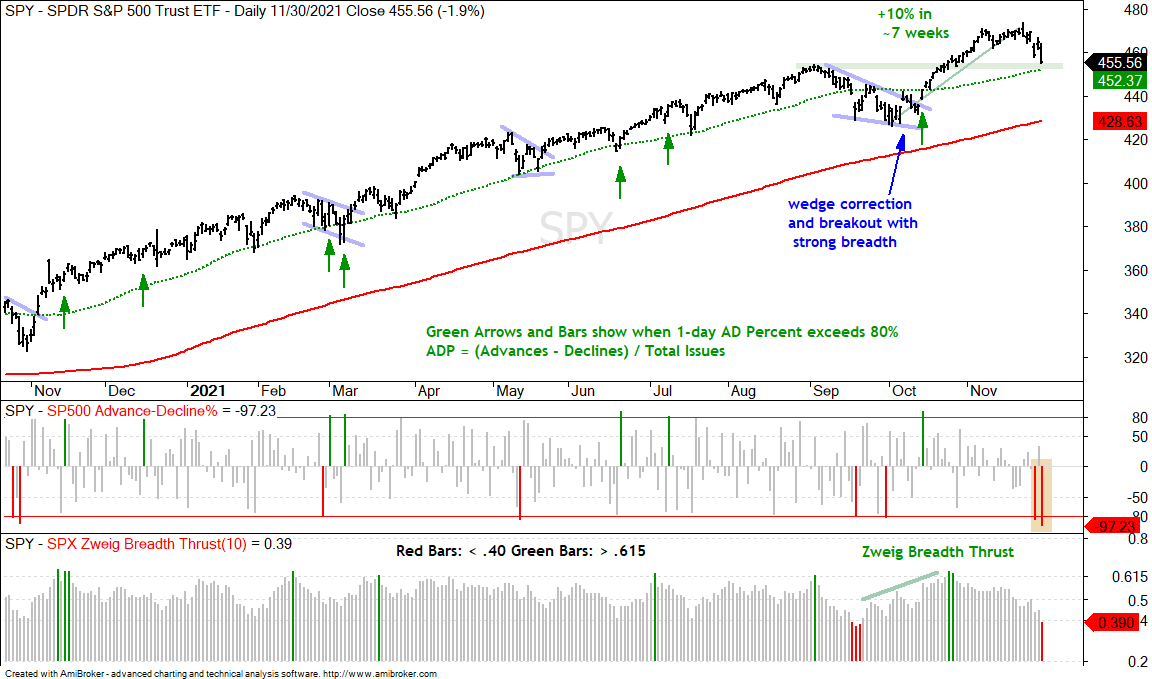
We are in the bullish setup phase because the long-term trend is up, SPY indicators are majority oversold and SPY is near a reversal zone. The next chart shows SPY falling back towards the 50-day SMA and broken resistance. This decline also retraced 1/3 to 1/2 of the October-November advance. The 50-day, broken resistance and retracement zone combine to mark support and a potential reversal zone.
The base-case is for an oversold bounce and resumption of the bigger uptrend in the coming days or weeks. There are, however, some issues with breadth and this could make for a bumpy ride. First, Advance-Decline Percent plunged below -80% twice in the last three days and this shows broad downside participation. This needs to be countered.
Second, the Zweig Breadth indicator moved below .40 (red bar), which is the first step to set up a Zweig Breadth Thrust. A subsequent move above .615 is needed to trigger a bullish Zweig Breadth Thrust. SPY found itself in a similar situation in mid September and it took another two to three weeks to bottom. We could be in a similar situation now. The markets have been punched in the face twice and may need more time to stabilize. The green lines on the first three indicators show how selling pressure was less on the second dip in late September.
You can learn more about my chart strategy in this article covering the different timeframes, chart settings, StochClose, RSI and StochRSI.
There are a lot of ETFs with big advances from early October to early November, breakouts and new highs. These ETFs started pulling back or stalling in mid November and then plunged the last three days. This three day plunge pushed the Momentum Composite to oversold conditions for most and this sets up for a mean-reversion bounce. The declines were sharp and disorderly so we do not have nice and tidy bullish patterns to work with (falling flag, falling wedge, flag, pennant, triangle). Admittedly, these are not my ideal setups because I prefer orderly pullbacks and tradable patterns. Mr Market does not always give us what we want though.
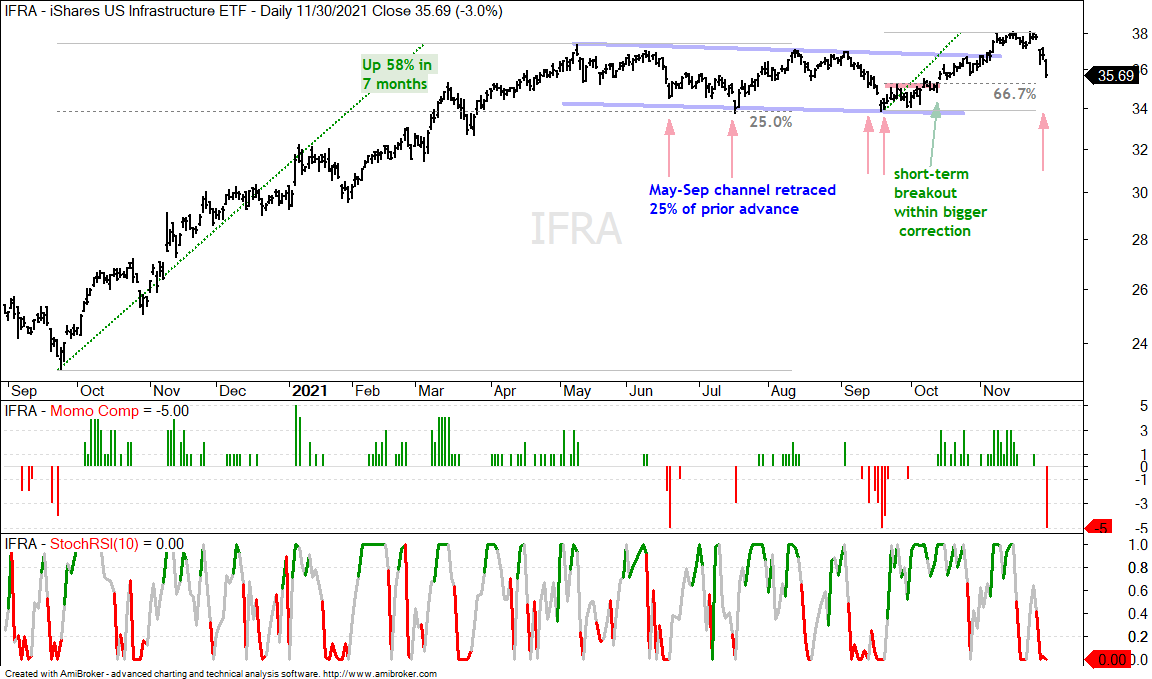
The first chart shows XLI breaking out of a large falling channel with a 10% advance and then retracing 2/3 of this advance with a sharp decline the last three days. The Momentum Composite dipped too -3 on Friday and -5 on Tuesday to become oversold. The red arrows show prior oversold conditions. Once the oversold alert triggers, it is time to look for bullish patterns, short-term bullish catalysts or StochRSI pops. The second chart shows the Infrastructure ETF (IFRA) with similar characteristics.
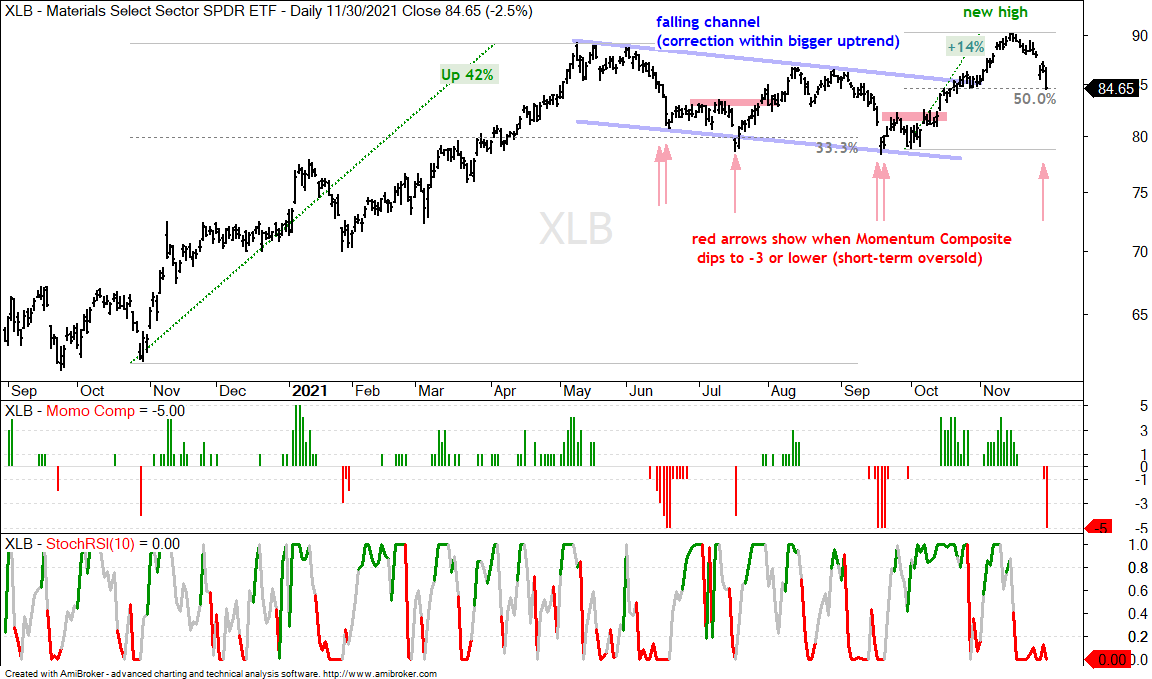
The next chart shows the Materials SPDR (XLB) with a 14% advance in six weeks. This advance broke out of a large falling channel and XLB recorded a new high. Thus, the long-term trend is up. The decline over the last few weeks retraced 50% of the prior advance and the Momentum Composite is at -5 (oversold).
You can learn more about exit strategies in this post, which includes a video and charting options for everyone.
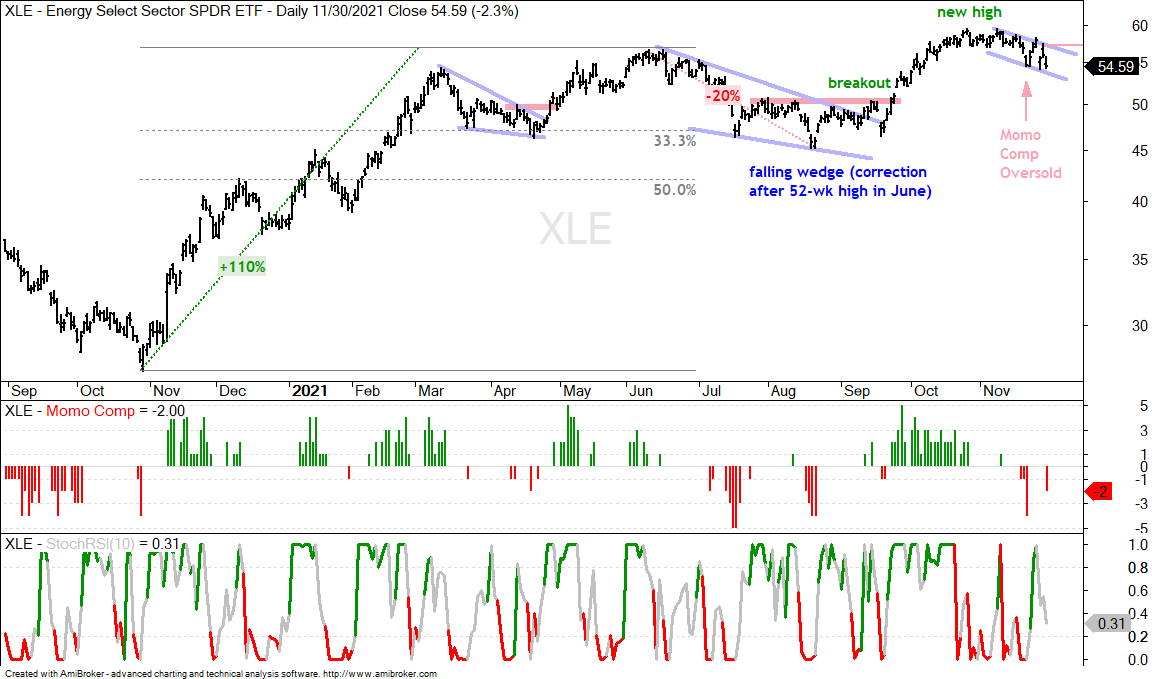
The decline in the Energy SPDR (XLE) is more orderly than the declines in XLI and XLB because I can draw a falling flag. Long-term, XLE broke out of a large falling wedge in September and hit new highs (long-term uptrend). The ETF became short-term oversold on 19-Nov and there was a StochRSI pop on 23-Nov. XLE fell back with the rest of the market on Friday and Tuesday, but remains with the flag and a break above Monday’s high would be short-term bullish.
The Oil & Gas Equipment & Services ETF (XES) chart looks similar to IWM because it has gone nowhere since March and is near the bottom of its range. The Momentum Composite became oversold on November 18th. With price act support and oversold, there is an active bullish setup on this chart. Watch for a StochRSI pop above .80 and/or a break above Monday’s high.
You can learn more about ATR Trailing stops in this post, which includes a video and charting option for everyone.
The Copper ETF (CPER) remains with a long-term bullish breakout (mid October) and a short-term bullish breakout (past week). The ETF broke out of a large falling channel with a 16% surge in October and then fell back with a falling wedge into mid November. CPER became short-term oversold on 17-Nov, triggered a StochRSI pop on 23-Nov and broke the mid November high last week Wednesday. Copper fell back with the rest of the risk-on world on Friday and stabilized the last two days. It is getting noisy, but the cup is still half full with the long-term and short-term wedge breakouts.
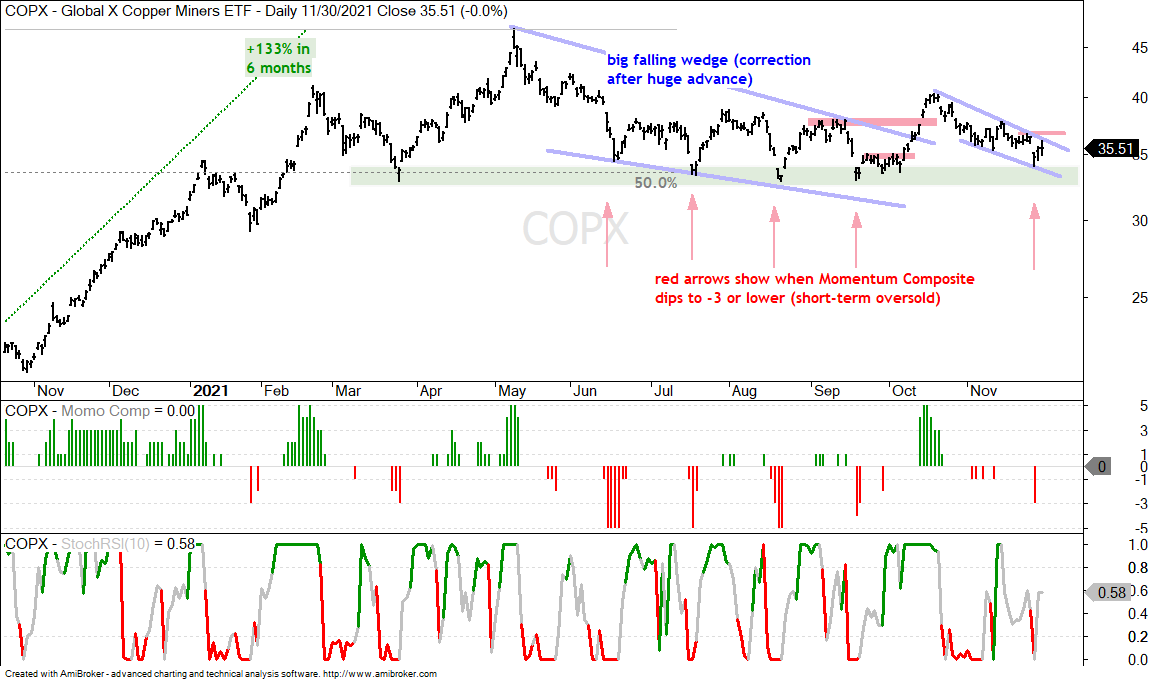
The Copper Miners ETF (COPX) has a bullish setup working as it broke out and fell back to towards support with a falling wedge the last five weeks. The Momentum Composite became oversold with a move to -3 on Friday and I am watching for a short-term bullish catalyst. A wedge breakout and/or StochRSI pop above .80 would do the trick.
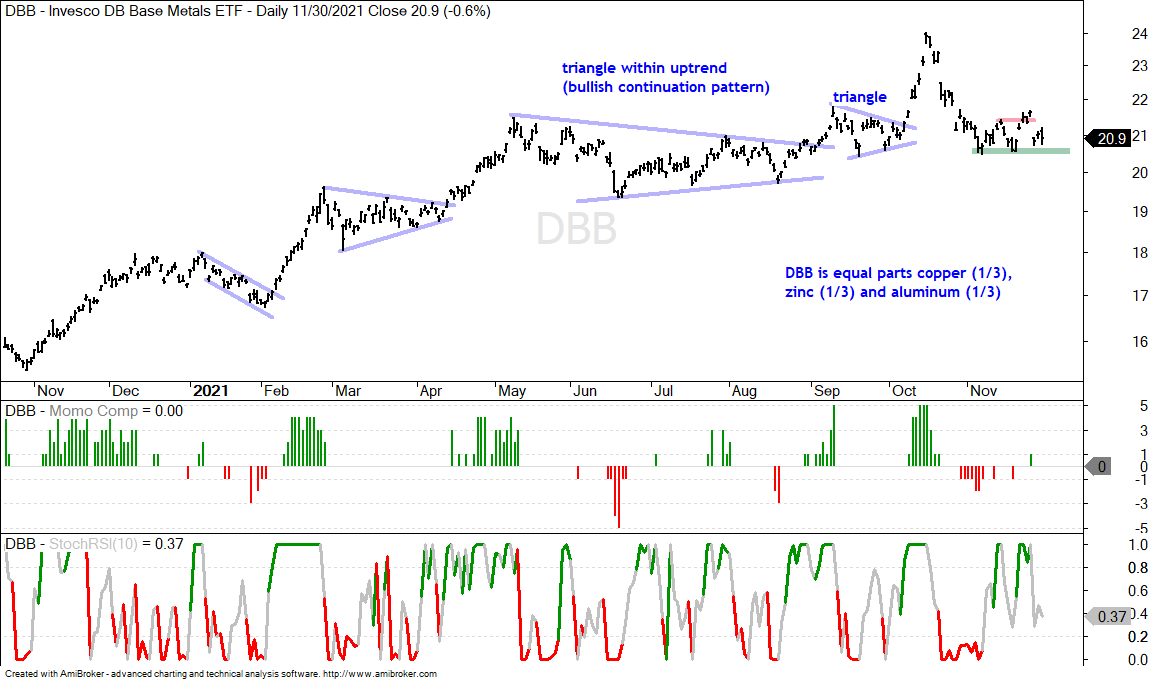
The next chart shows the DB Base Metals ETF (DBB) surging to a new high in October and then falling back into the September range (triangle). It was a hard throwback, but the long-term trend is still up and DBB broke out on 23-Nov. As with most breakouts on the Wednesday before turkey day, DBB fell right back on Friday. I still think the cup is half full because the long-term trend is up and DBB is still holding the November lows.
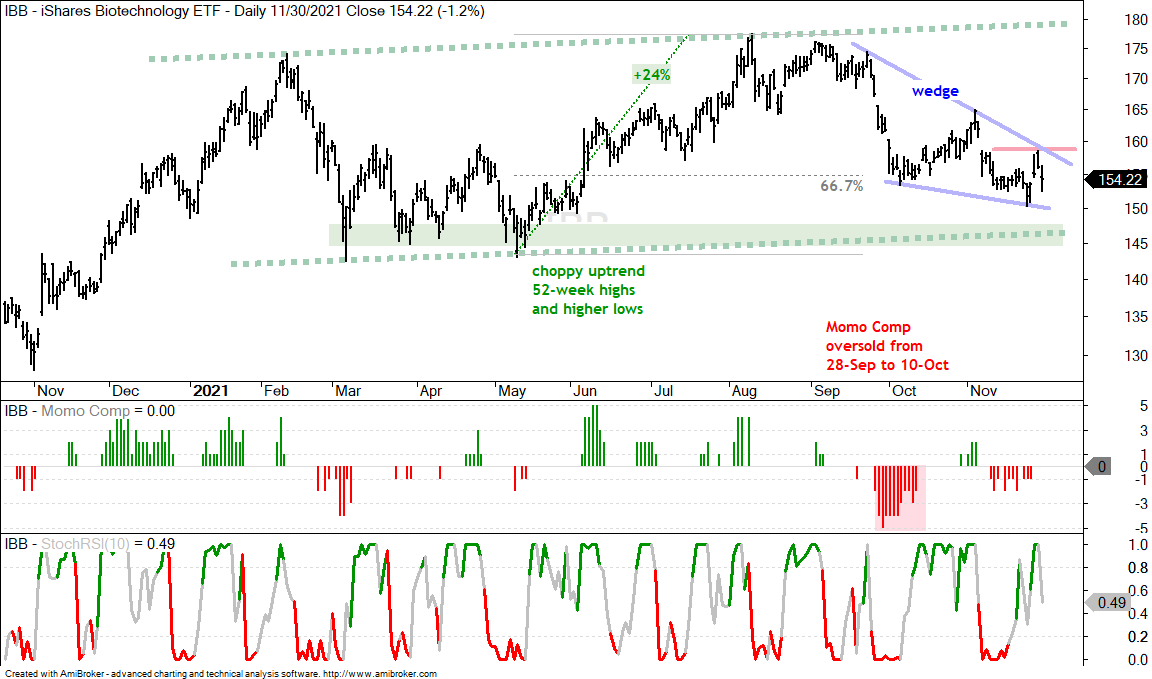
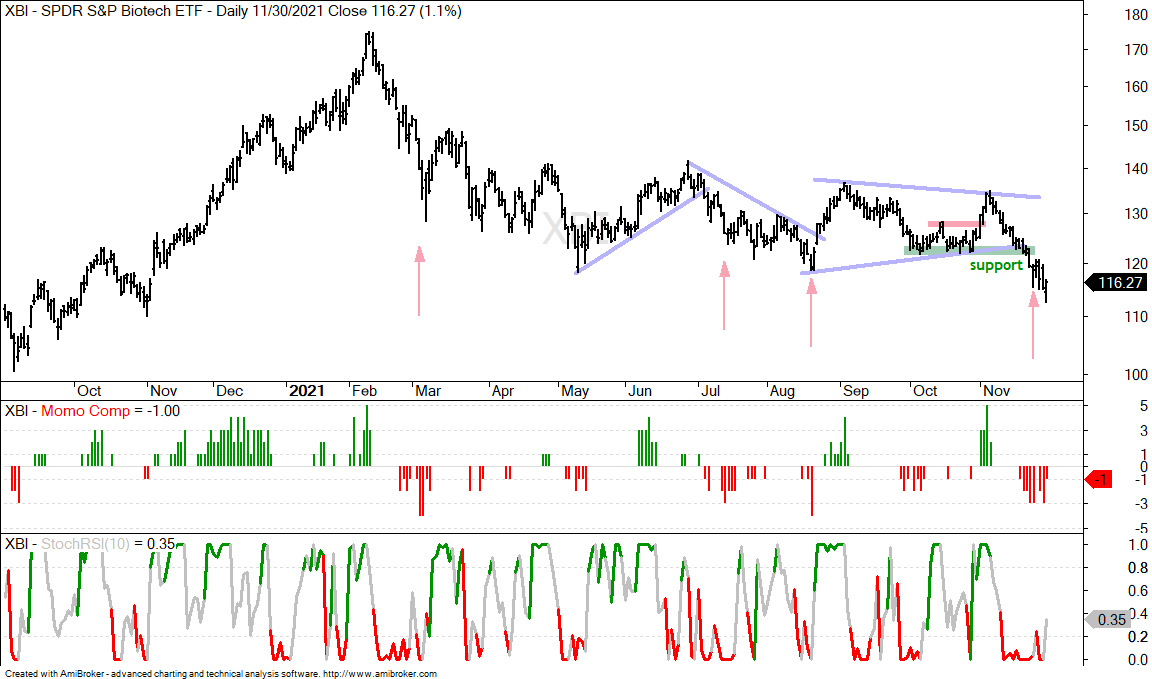
The Biotech SPDR (XBI) is going the way of small-caps by breaking below its spring-summer lows. The Biotech ETF (IBB), which is large-cap oriented, is holding up much better and within a choppy uptrend this year (green dashed lines). After a new high in August, the ETF fell back with a falling wedge the last two months and retraced around 2/3 of the prior advance. IBB popped on Friday-Monday, but fell back on Tuesday to establish short-term resistance. A follow through break above Monday’s high would also trigger a wedge breakout and argue for a continuation of the bigger uptrend.
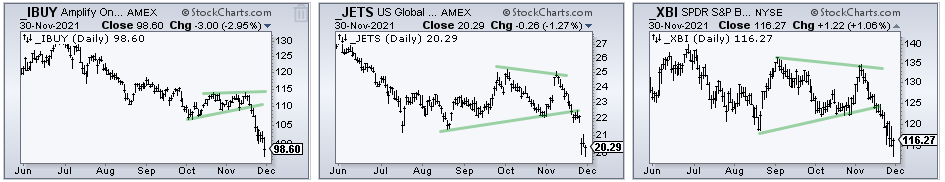
In the “who would have guessed” category. The Online Retail (ETF) breaks down just before the biggest shopping week of the year and the Airline ETF (JETS) breaks down just before the busiest travel week of the year. The Biotech SPDR (XBI) breaks down and hits a multi-month low during a pandemic and even as Omicron surfaces.
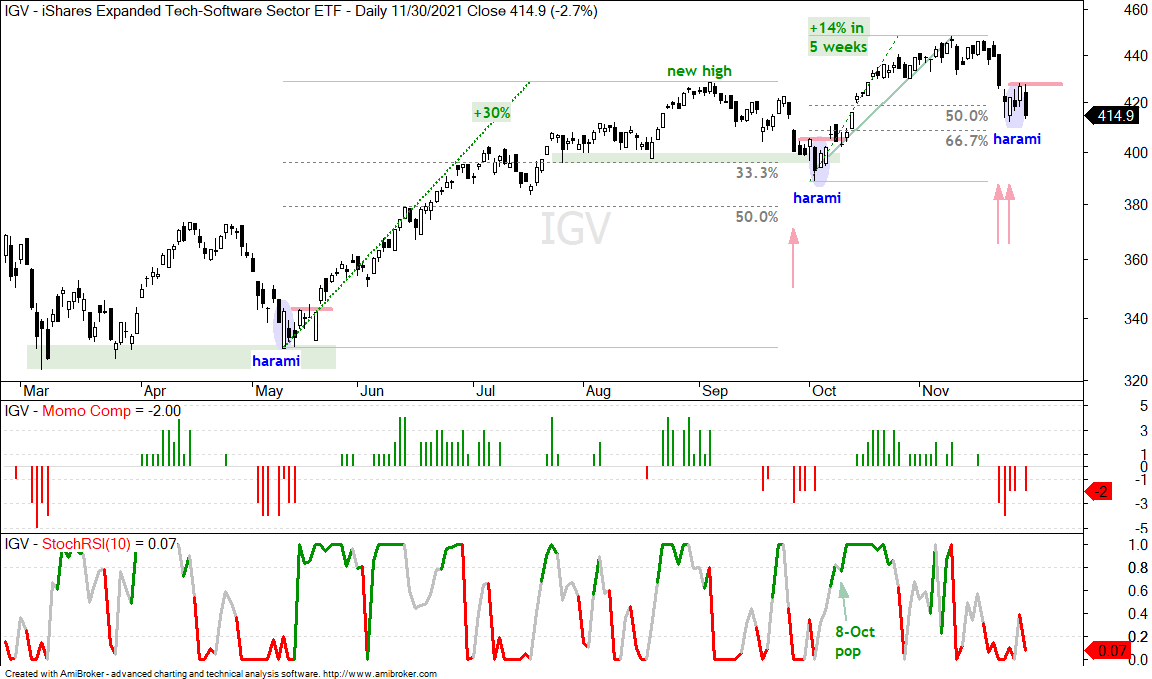
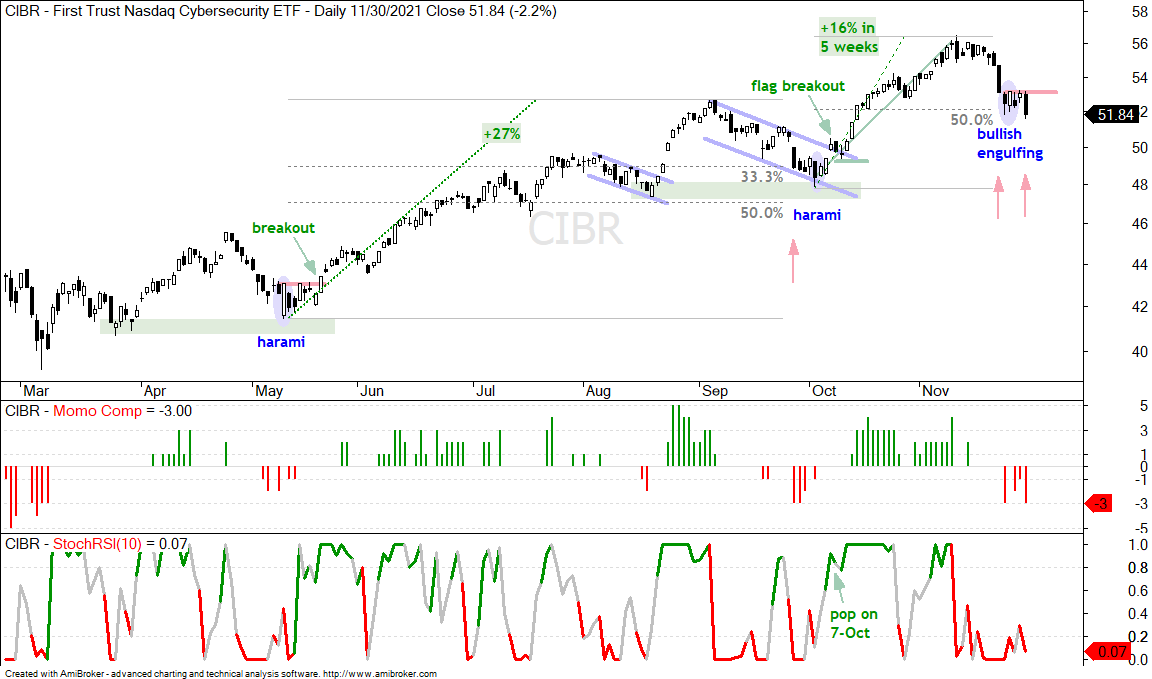
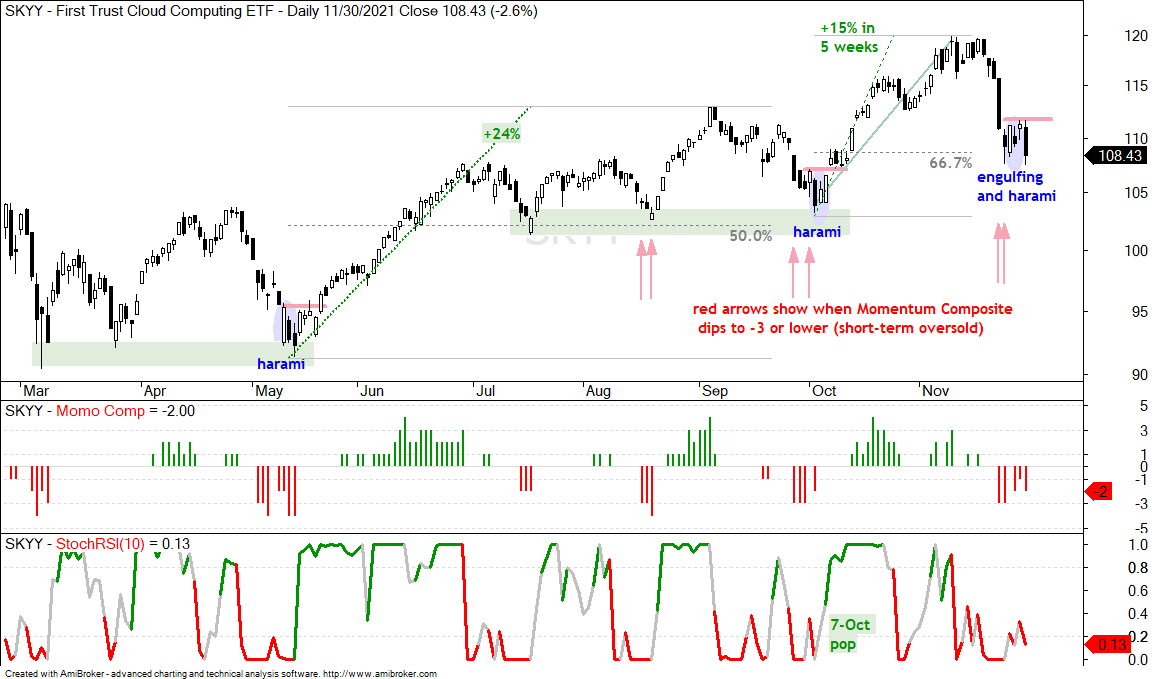
I highlighted three tech-related ETFs on Tuesday morning as they firmed with harami near their 50-67% retracement zones. Also note that I highlighted three clean energy ETFs with short-term bullish setups. The tech-related ETFs fell with the market on Tuesday, but the bullish setups remain and these declines established short-term resistance levels to watch for a breakout. Also note that all three became short-term oversold within the last six trading days (Momentum Composite at -3 or lower) and StochRSI remains without a pop. A StochRSI pop and/or short-term breakout would be bullish.
")