We never know if a consolidation will mark a top or a bullish continuation pattern. Three out of four times (guesstimate), a consolidation within an uptrend is a bullish continuation pattern that resolves to the upside. Sometimes, however, a consolidation is resolved on the downside and results in a reversal. This is the concern going forward for several ETFs that consolidated since early September. They include QQQ, XLK, IGV, SKYY, FDN and ITB.
Relative weakness in some key groups is another reason for concern. In fact, many key ETFs have gone nowhere since early September and are underperforming. This is also reflected in the consolidations mentioned above. Basically, SPY, XLK, XLC, XLY and ITB have gone nowhere since early September. Meanwhile, we are seeing double digit moves in IWM, XLF, KRE and ITA, not too mention a big three week surge in XLE. Should we be more impressed with the laggards starting to lead or concerned with the leaders starting to lag? I think the latter.
ETF Grouping and Ranking by Trends, Patterns and Setups
New High and Leading
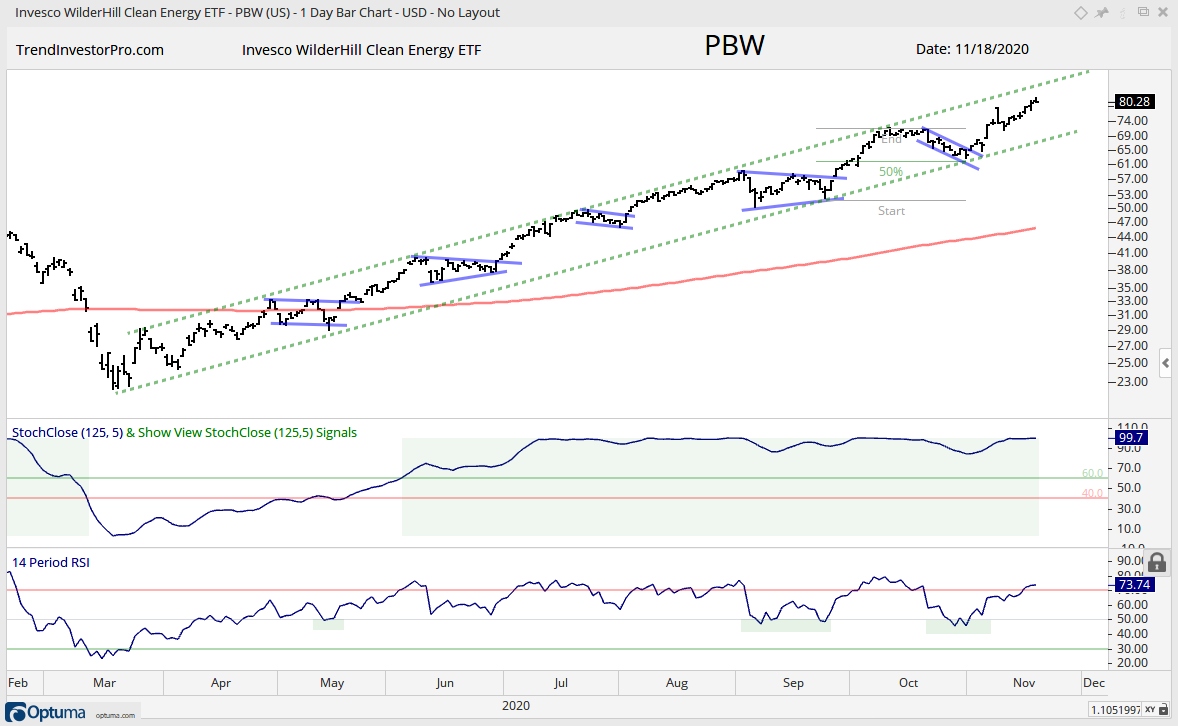
PBW, REMX, PHO
There are steep rising channels and then there are STEEP rising channels. The chart below shows the Clean Energy ETF (PBW) with one of the steepest and steadiest rising channels you will ever see. This rise is punctuated with short-term bullish continuation patterns (blue lines) and three RSI dips into mild oversold territory (40-50). With another new high and 20+ percent advance the last few weeks, PBW is in the monitoring stage. Either ride the trend until a long-term trend reversal or wait for a playable pattern (wedge, pennant, RSI dip into 40 area). The Strategic Metals ETF (REMX) and Water Resources ETF (PHO) are also in the monitoring phase.
Uptrends and New Highs
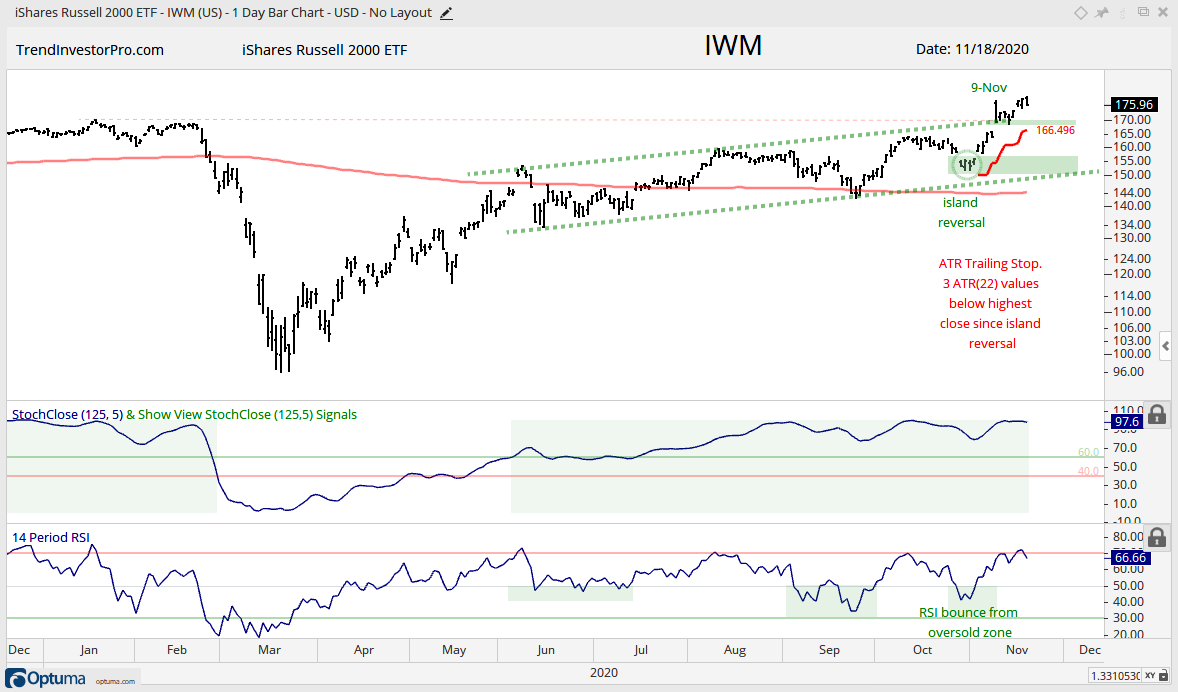
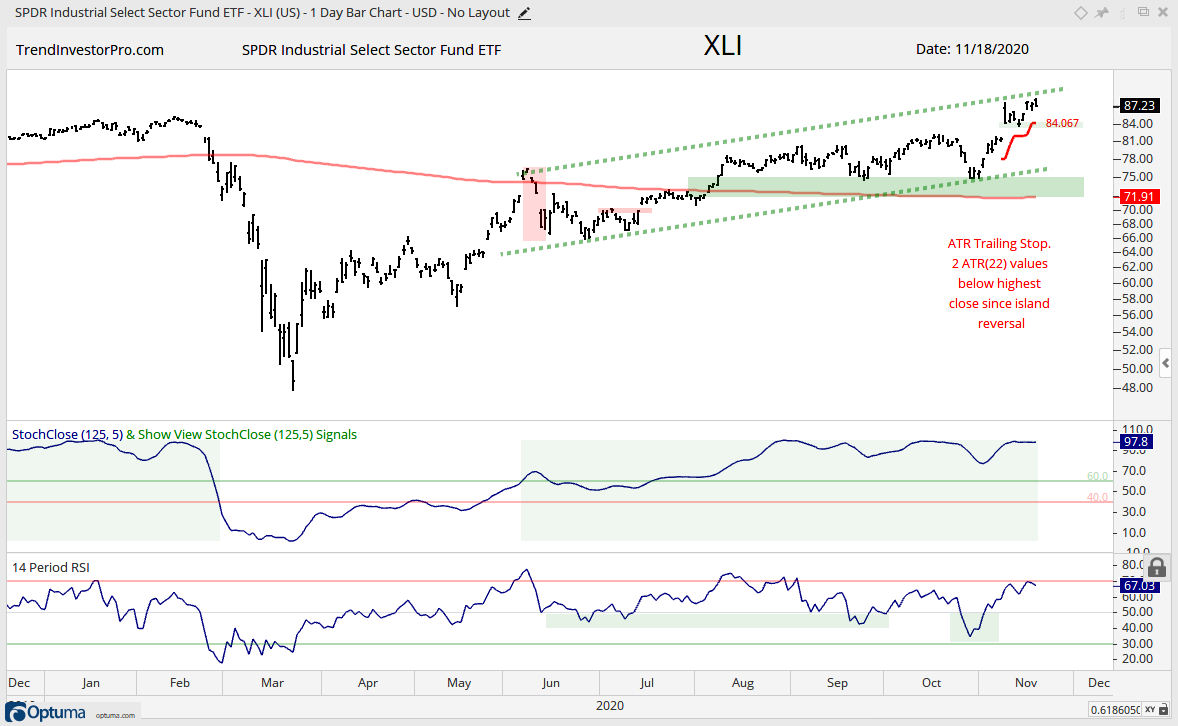
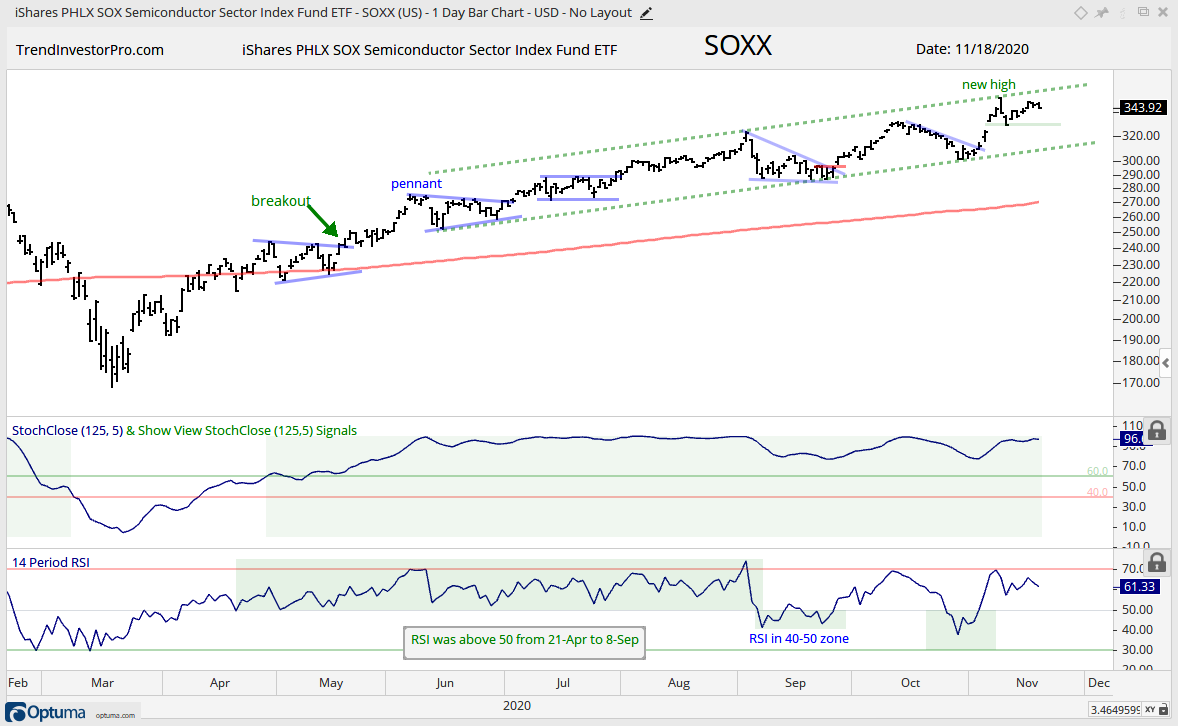
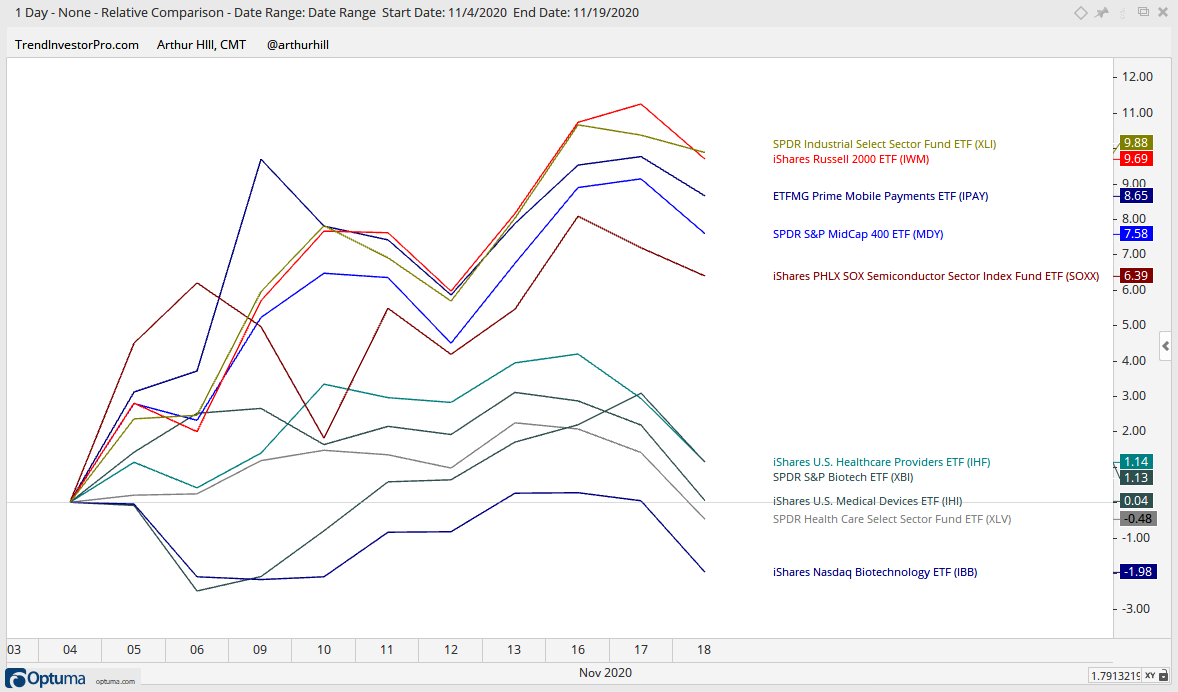
MDY, IWM, XLI, SOXX, IPAY
ETFs in this second group are also leading with clear uptrends and new highs in mid November. In fact, these five are up six to ten percent over the last two weeks. The charts show rising channels of sorts. Rising channels simply tell us that the chart sports higher highs and higher lows (uptrend). The ideal entry spot is near the higher low (pullback) and with RSI oversold, not near a higher high and with RSI overbought.
The chart below shows IWM with an island reversal forming the last higher low. The ETF surged the last few weeks and hit a 52-week high this week. Again, this puts IWM and the others in the trend monitoring phase. The gap on November 4th and low on November 12th are the first levels to watch short-term. A close below the November 12th low would reverse the short-term upswing and perhaps lead to the next bullish setup (higher low and RSI near 40).
You can learn more about ATR Trailing stops in this post, which includes a video and charting option for everyone.
You can learn more about ATR Trailing stops in this post, which includes a video and charting option for everyone.
Uptrends, New Highs and Stalling
XLV, XBI, IHI, IHF
What is the deal with Healthcare? Perhaps it has something to do with the election because the five health-care related ETFs are mixed since November 4th and underperforming. XLI, IWM, IPAY, MDY and SOXX, in contrast, are up substantially. Three of the five healthcare ETFs are up (barely) and two are down with IBB losing 2% since the election.
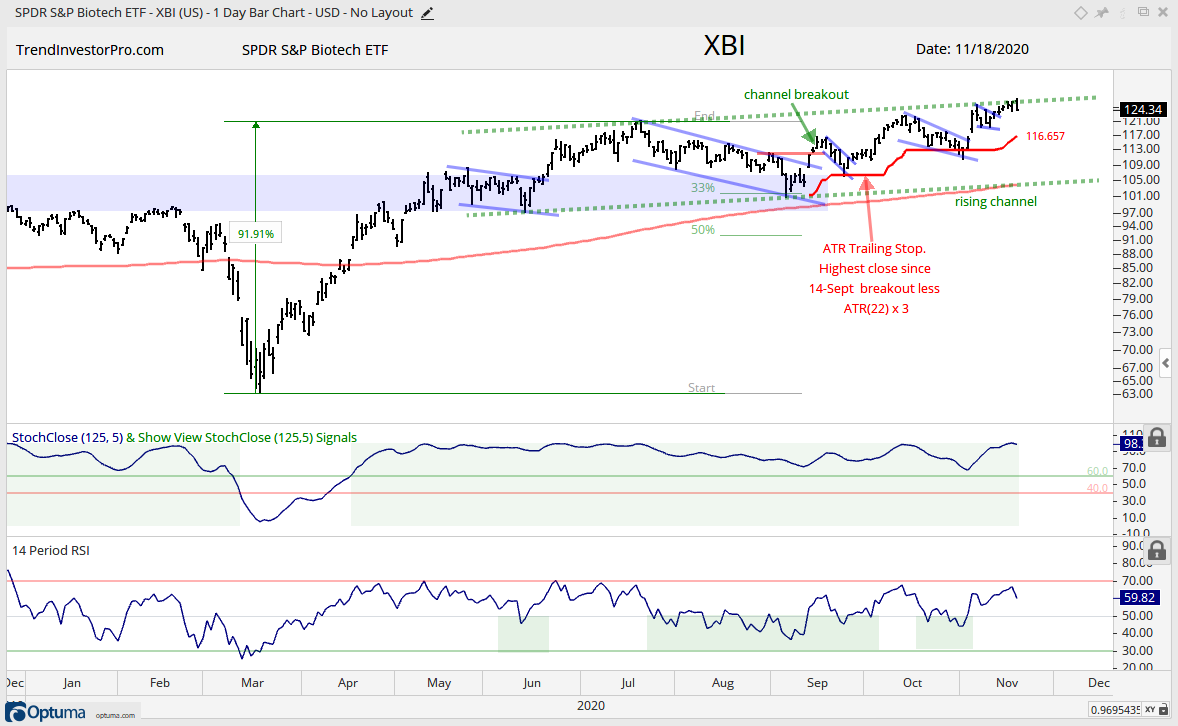
The Healthcare SPDR (XLV) and Biotech SPDR (XBI) hit new highs, but are doing it with slow and choppy uptrends (rising channels). Even stranger, XBI is at the top of this week’s grouping and the Biotech ETF (IBB) is at the bottom because it formed lower highs in October and November. The first chart shows XBI with a breakout in September and then three smaller pullbacks with breakouts. The uptrend since May is quite choppy with a rising channel taking shape. While I would not consider the upper trendline resistance per se, the zigzag nature of this advance and relative weakness mean we could see a zag lower.
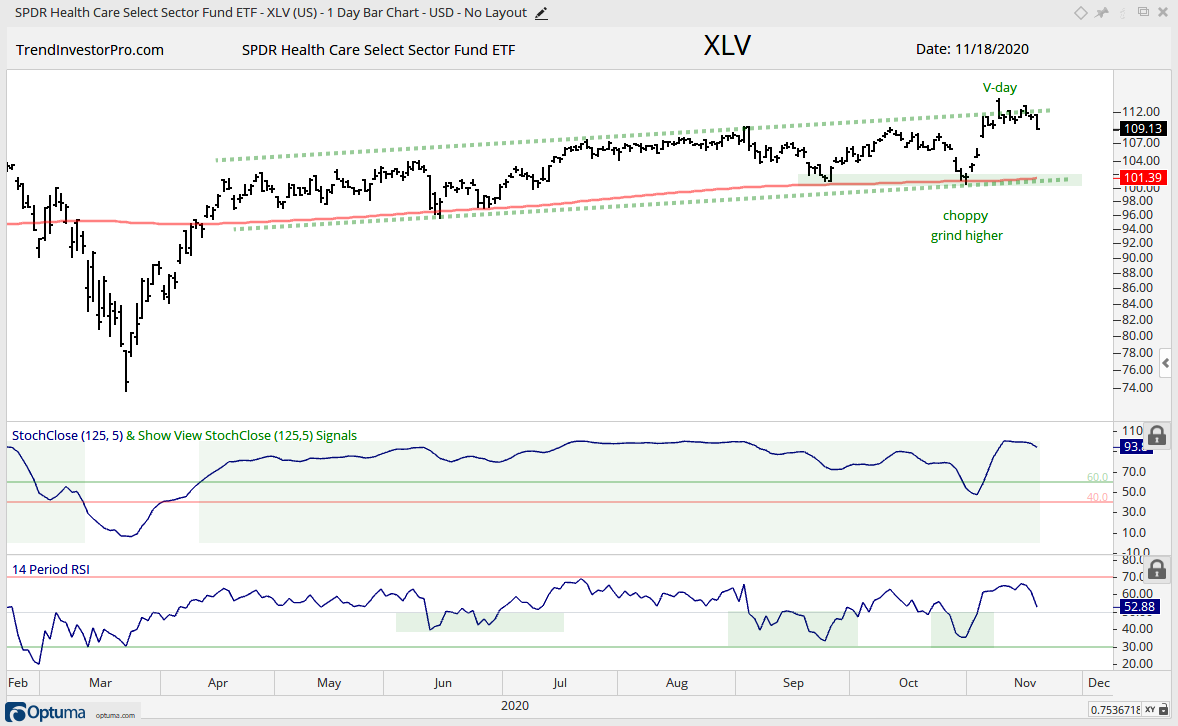
The next chart shows the parent sector for biotechs, the Healthcare SPDR (XLV). This ETF also sports a rather lethargic uptrend with the rising channel since April. This rising channel defines the higher highs and higher lows over the last seven months. XLV barely exceeded its August-October highs here in November and there was no follow through to the gap on November 9th (V-day, Vaccine day). Thus, XLV could fall back into the channel with a zag lower.
Ascending Triangle Breakout Holding
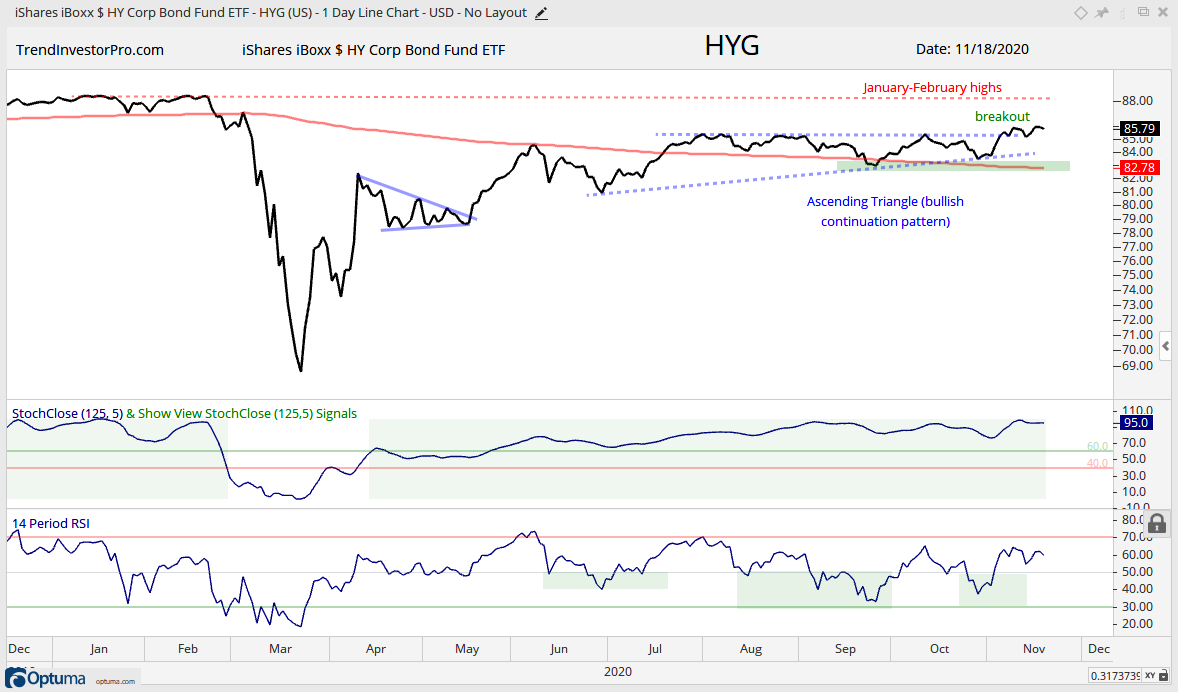
RSP, IJR, HYG
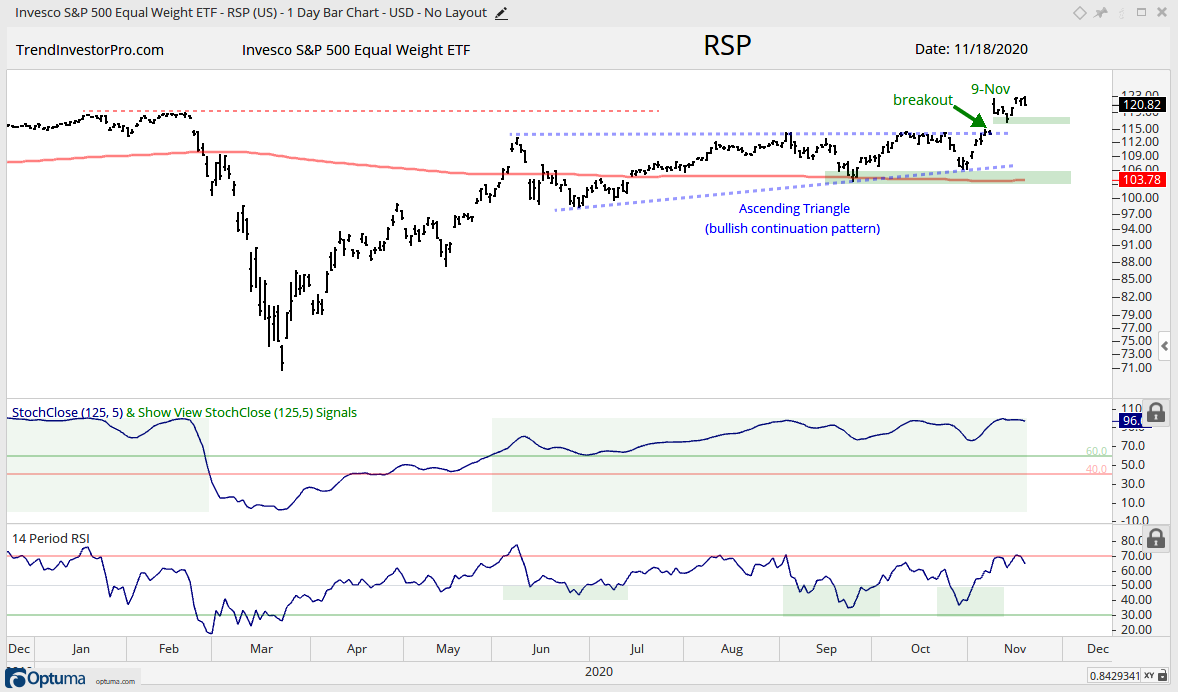
The next three ETFs have Ascending Triangles and breakouts working. The S&P 500 EW ETF (RSP) and S&P SmallCap 600 SPDR (IJR) surged for clear breakouts, while the High-Yield Bond ETF (HYG) is barely above its breakout zone. HYG is also well below its January-February highs. The chart below shows RSP with a gap-laden surge from November 2nd to 16th. The November 9th gap held with a bounce on Friday-Monday and last week’s low marks short-term support. The inability to hold the V-day gap would be negative, but not enough to fully reverse the bigger uptrend.
Consolidation Breakout and 9-12 month High
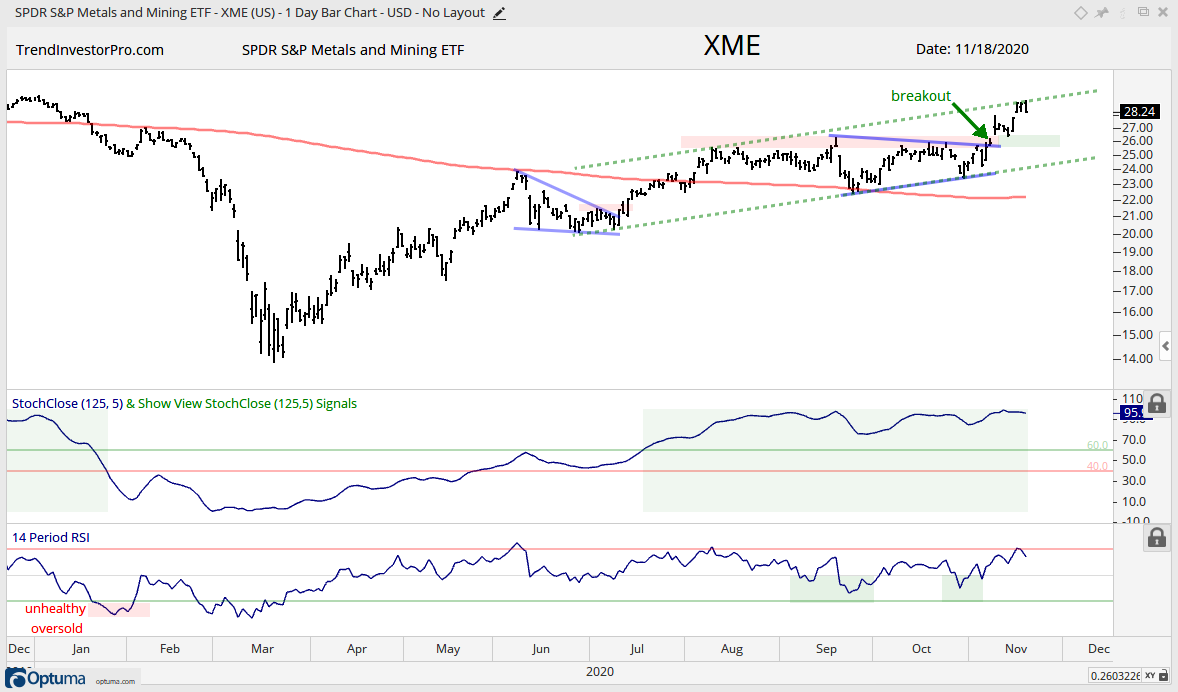
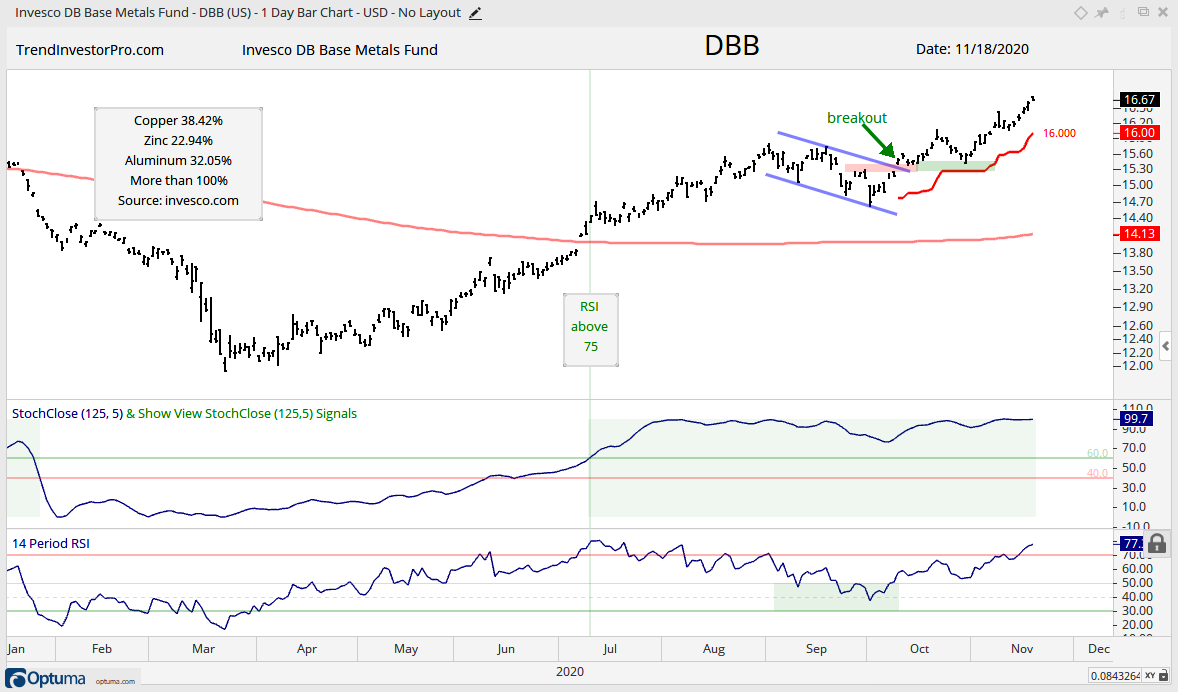
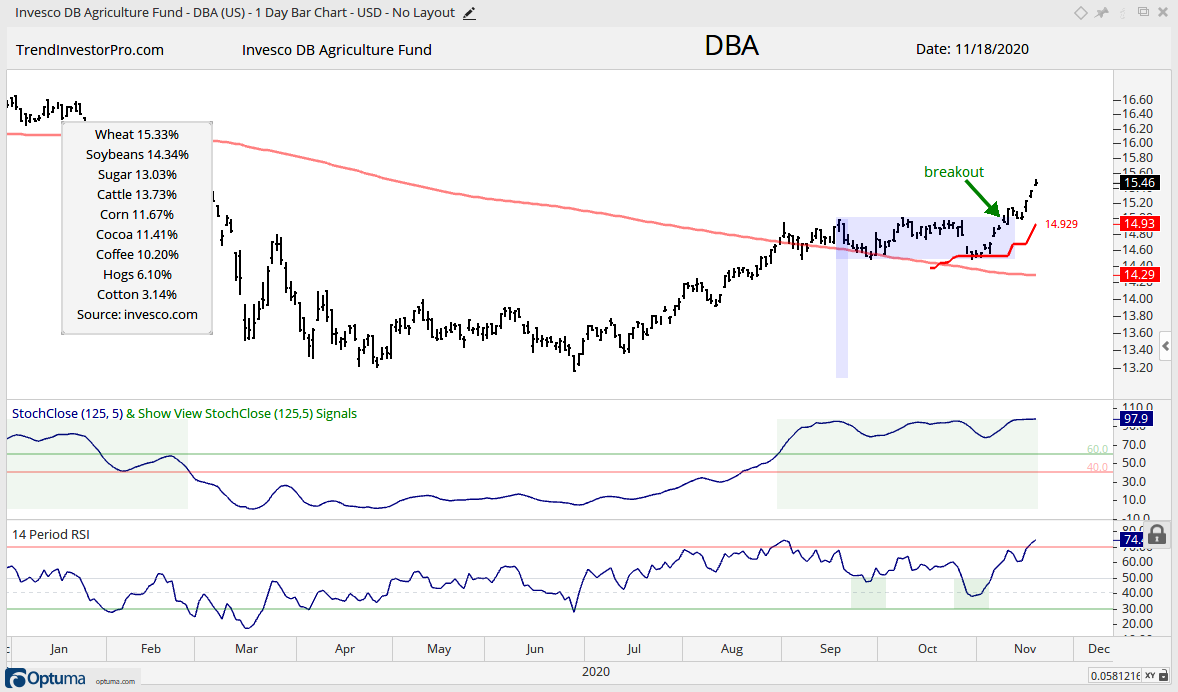
XLB, XME, DBB, DBA
The Metals & Mining SPDR (XME) broke out of a triangle pattern and gapped above the September highs on vaccine day. Note that XME is 50% steel, 20% aluminum, 15% gold/silver, 8% diversified metals, 5% copper and 3% coal/other. The overall trend is clearly up with RSI touching 70 this week and price tagging a possible rising channel line. The breakout zone around 26 turns first support to watch should we see a throwback.
The DB Base Metals ETF (DBB) continued its beast-mode move by tacking on another 3.5% the last five days. RSI also moved above 75, which is both overbought and strong. Notice how RSI first moved above 75 on July 10th and this coincided with a StochClose move above 60 (bullish trend signal). DBB could continue higher, but a little caution is advised because the ETF is up substantially since early October. The DB Agriculture ETF (DBA) is also on a tear.
New high in October and Choppy Trading
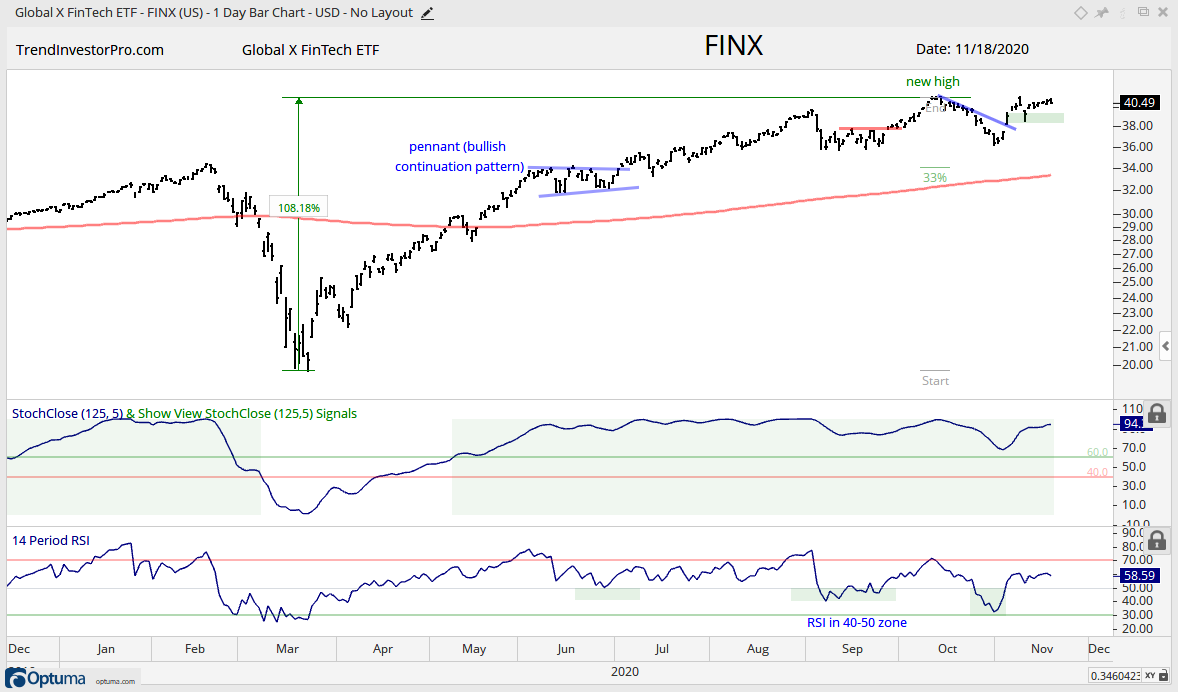
XLY, FINX, ITB, TAN
ETFs in this next group were firmly in the leadership group in October with new highs, but they did not exceed their October highs here in November (so far). This is a minor issue for the Consumer Discretionary SPDR (XLY) FinTech ETF (FINX) and Solar Energy ETF (TAN), but the Home Construction ETF (ITB) is struggling a little more. The first chart shows FINX with a pullback into early November, an RSI move into the oversold zone and a breakout on November 4th. This breakout is holding, but follow thru was limited. Last week’s low marks first support and a break here would negate the breakout. Such a move could lead to a deeper correction towards the rising 200-day.
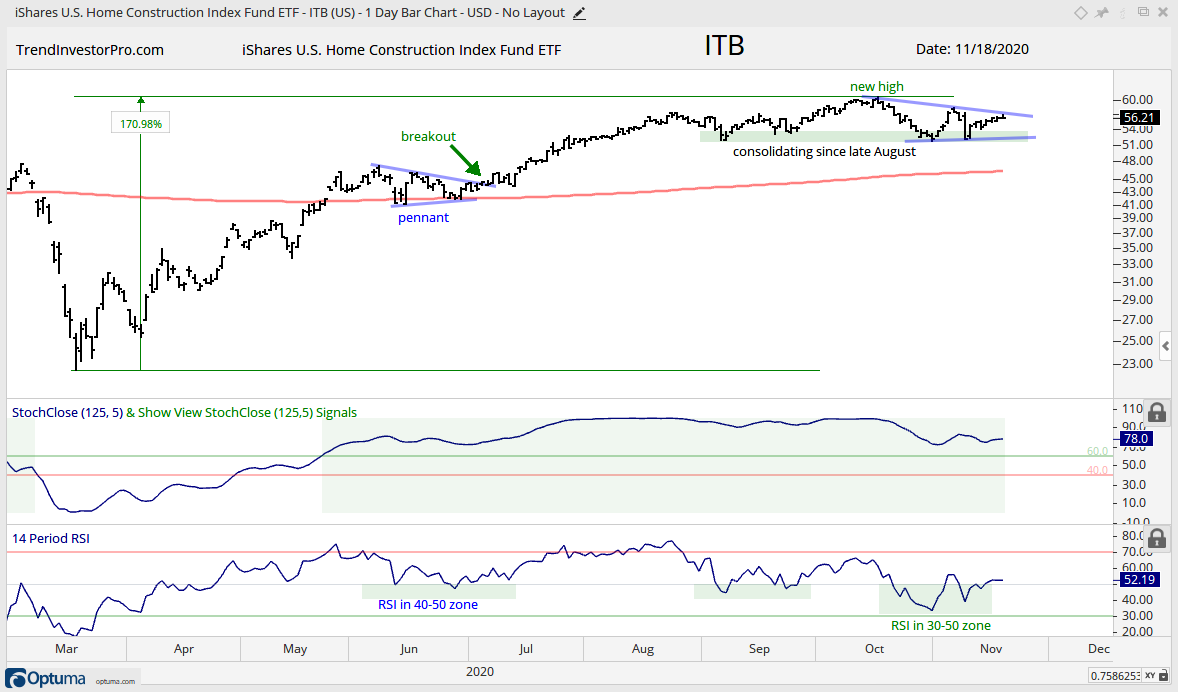
The next chart shows ITB with a triangle since mid October and a consolidation since mid August. SPY and RSP moved to new highs in November, while ITB stalled and is below its November 4th high (post election). The bigger trend is up, but short-term underperformance would point to a correction period and perhaps a test of the 200-day.
Consolidation Breakout, but Back below early Sept High
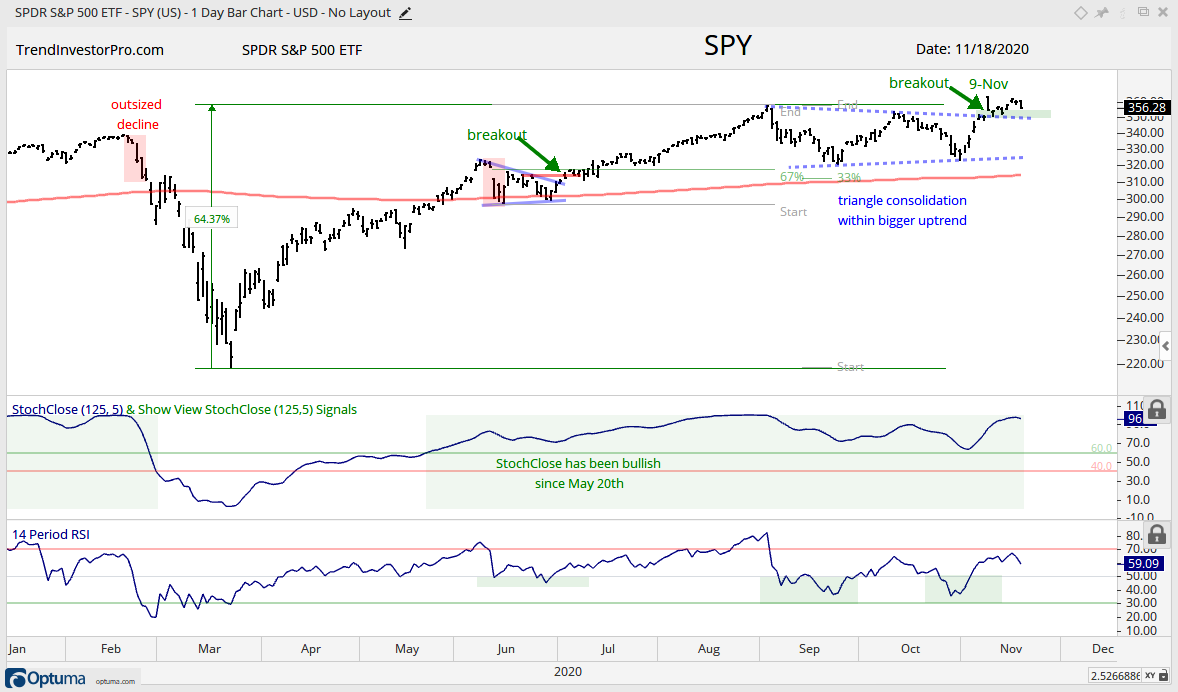
SPY, XLC, XLP
The S&P 500 SPDR (SPY) broke out of a triangle pattern with a gap up on vaccine day (November 9th) and this gap is largely holding. We have yet to see follow through or failure. The cup should be considered half full as long as the breakout holds. A close below 350 would negate the breakout and put SPY back into its consolidation. Such a move would be short-term negative, but not enough to derail the bigger uptrend.
Consolidation, but Struggling to Break Out
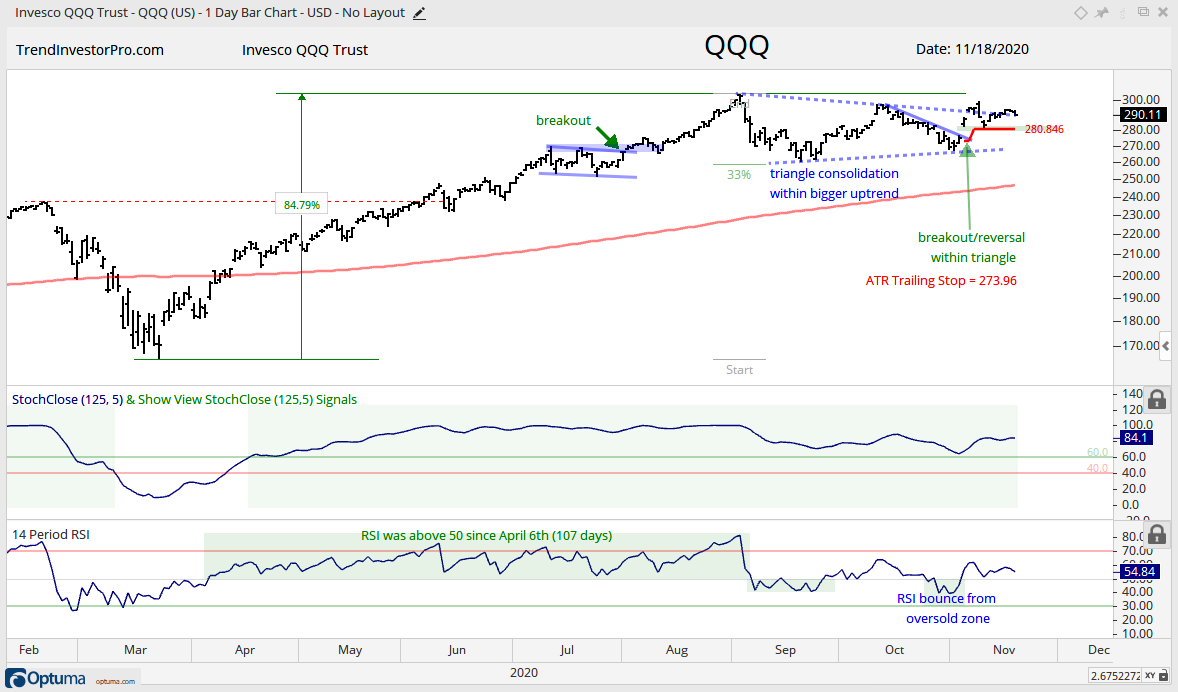
QQQ, XLK, SLV
ETFs in this group are slightly weaker than SPY because they have yet to exceed their October highs and are struggling to break out. The chart below shows QQQ with a breakout within a bigger triangle. The November 4th gap and breakout are holding, but we have yet to see follow through and a triangle breakout. The bulls get the benefit of the doubt as long as last week’s low holds (call it 280).
New High in September, Stuck in Consolidation
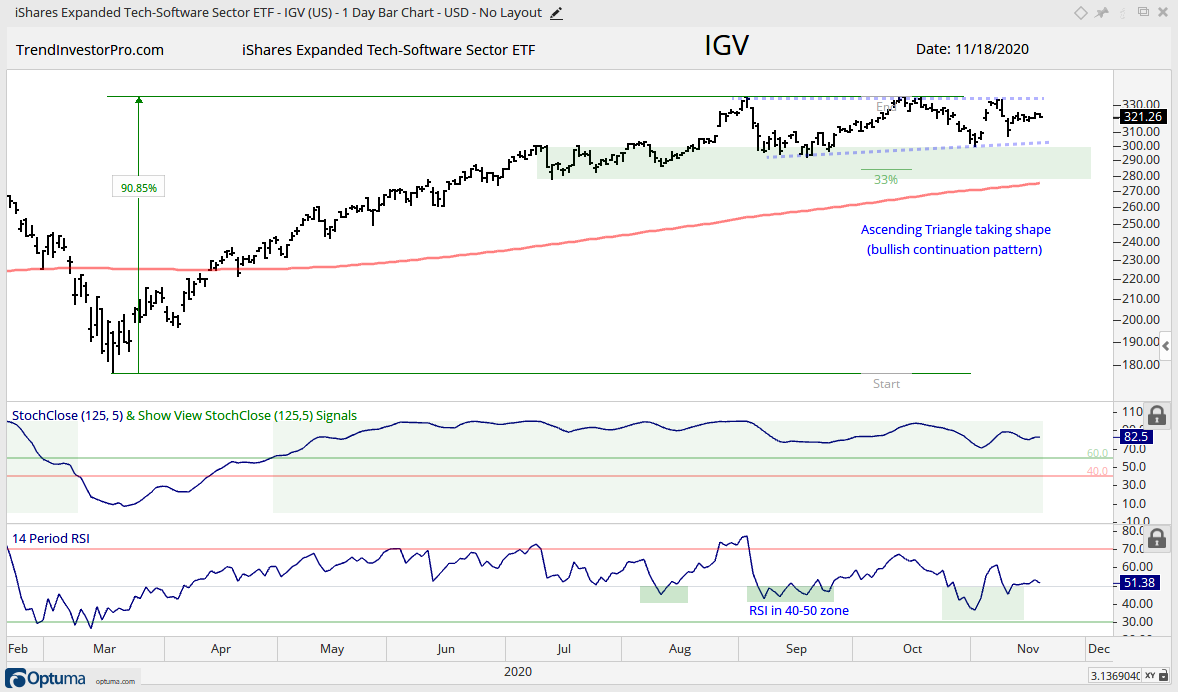
IGV, FDN, SKYY, HACK
Four tech-related ETFs feature in this next group. They hit new highs in early September and then consolidated the last 2+ months. The Software ETF (IGV) and Internet ETF (FDN) have Ascending Triangles working, the Cloud Computing ETF (SKYY) sports a flat consolidation and the Cyber Security ETF (HACK) has a falling channel. They are all consolidations within uptrends and this means they are bullish continuation patterns. I am concerned, however, because these groups are underperforming and down since vaccine day.
Falling Wedge, Normal Correction and Breakout
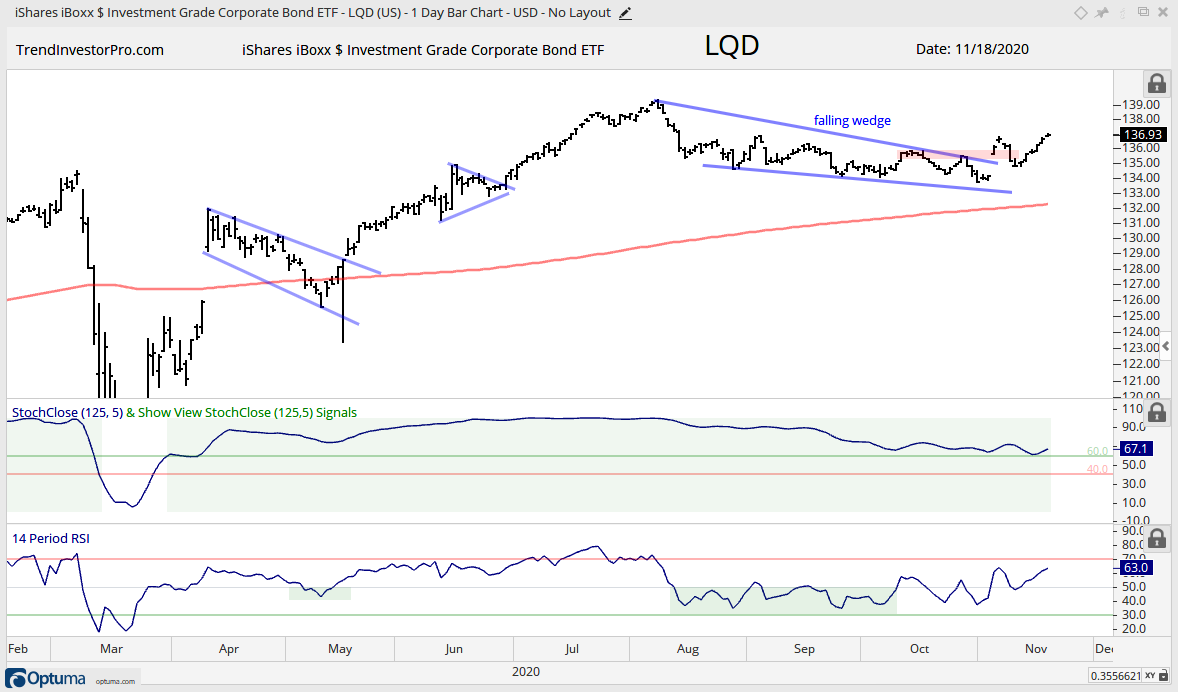
LQD
The Corporate Bond ETF (LQD) distanced itself from the Treasury-bond ETFs with a falling wedge breakout on November 4th and move above the early November high this week. Overall, the falling wedge is a bullish pattern that marks a correction within a bigger uptrend. Notice that LQD held above the rising 200-day. The Regional Bank ETF (KRE) and Oil & Gas Equipment & Services ETF (XES), in contrast, were below their falling 200-day SMAs when their falling wedges formed.
Long Triangle, Breakout, Overbought
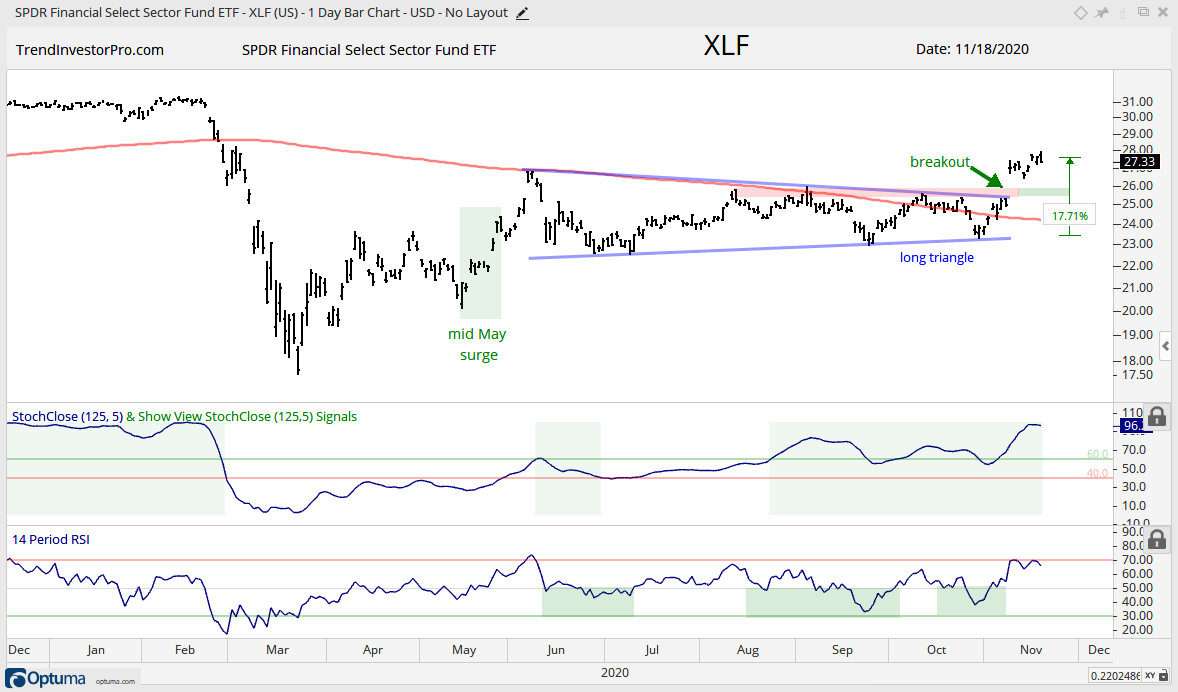
XLF, REM, REZ, KIE, XLU
ETFs in this next group formed long triangle consolidations (June to October) and broke out as the world order changed on November 9th. XLU broke out earlier, but the patterns are similar. XLF, REM, REZ and KIE are short-term overbought after big moves in November. The breakouts are bullish, but it is time to let the dust settle and wait for a bullish continuation setup (pennant, flag, wedge and/or RSI dip into the 40 area).
Long Falling Wedge, Breakout, Overbought
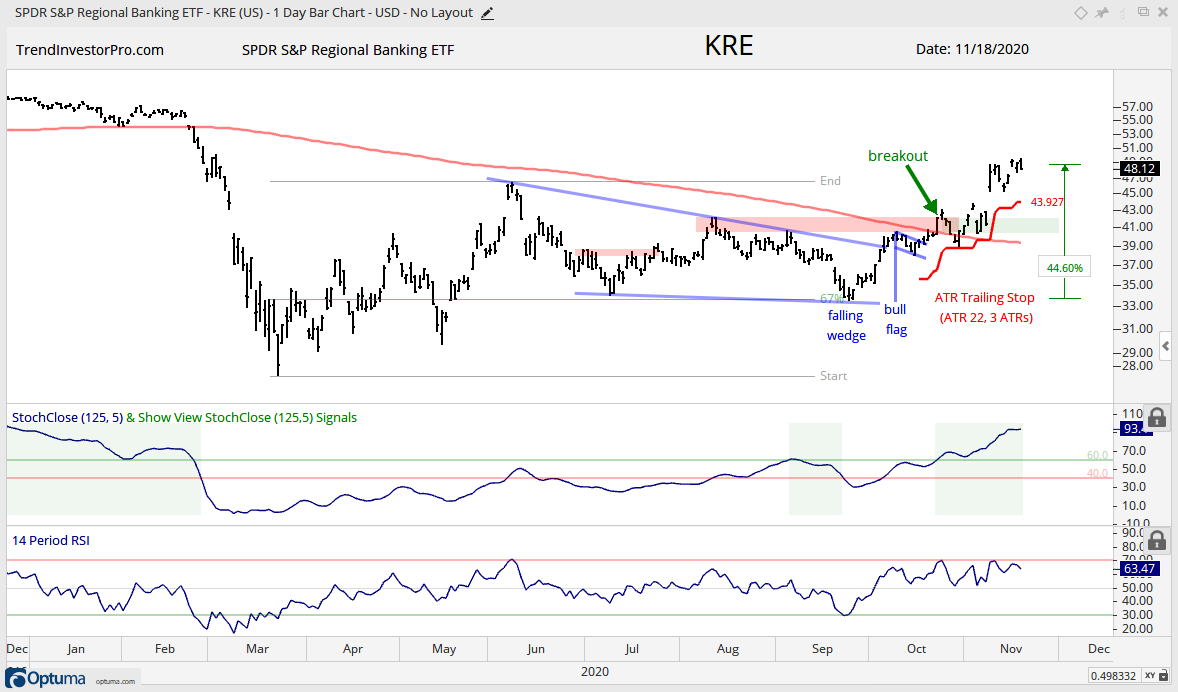
KRE, ITA, XLE, XES, XOP, AMLP, FCG
ETFs formed big falling wedges and broke out over the last few weeks. The Regional Bank ETF (KRE) is the ring leader here with a breakout in late October and a 40+ percent advance from the late September low. It is a big move, but, as MC Hammer would say: Can’t Touch This! Again, it is time to let the dust settle and wait for a bullish continuation setup.
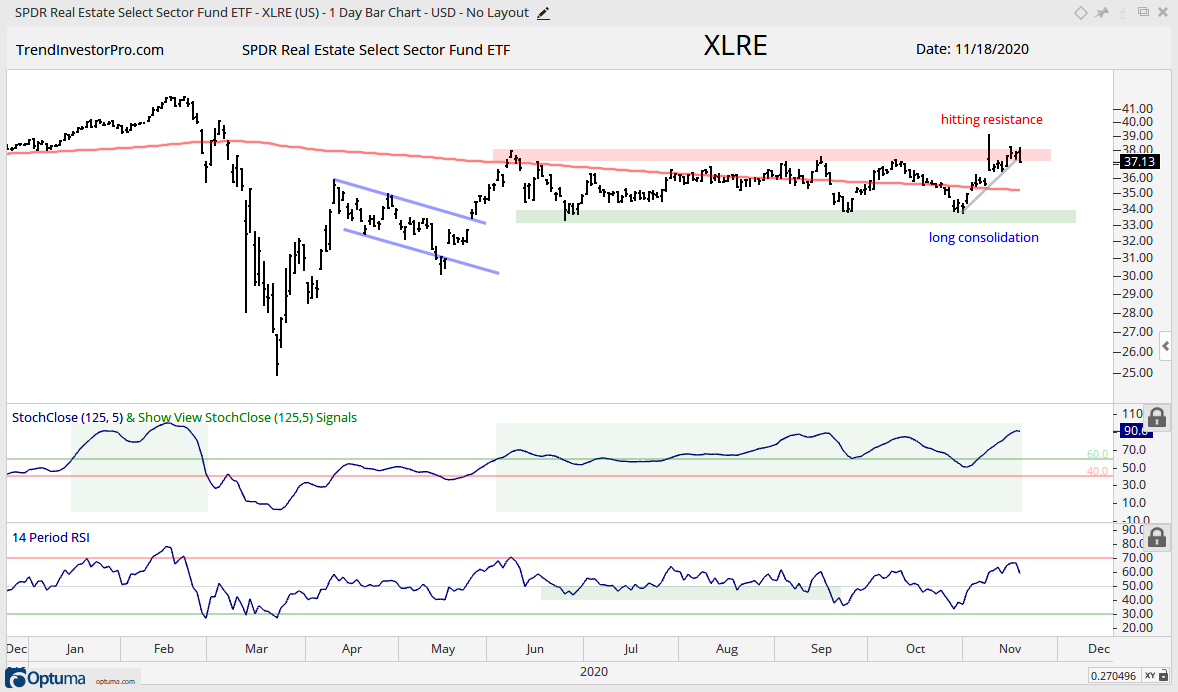
Long Consolidation, Hitting Resistance
XLRE
The Real Estate SPDR (XLRE) edged above its September-October highs this week (closing prices), but is hitting a resistance zone overall.
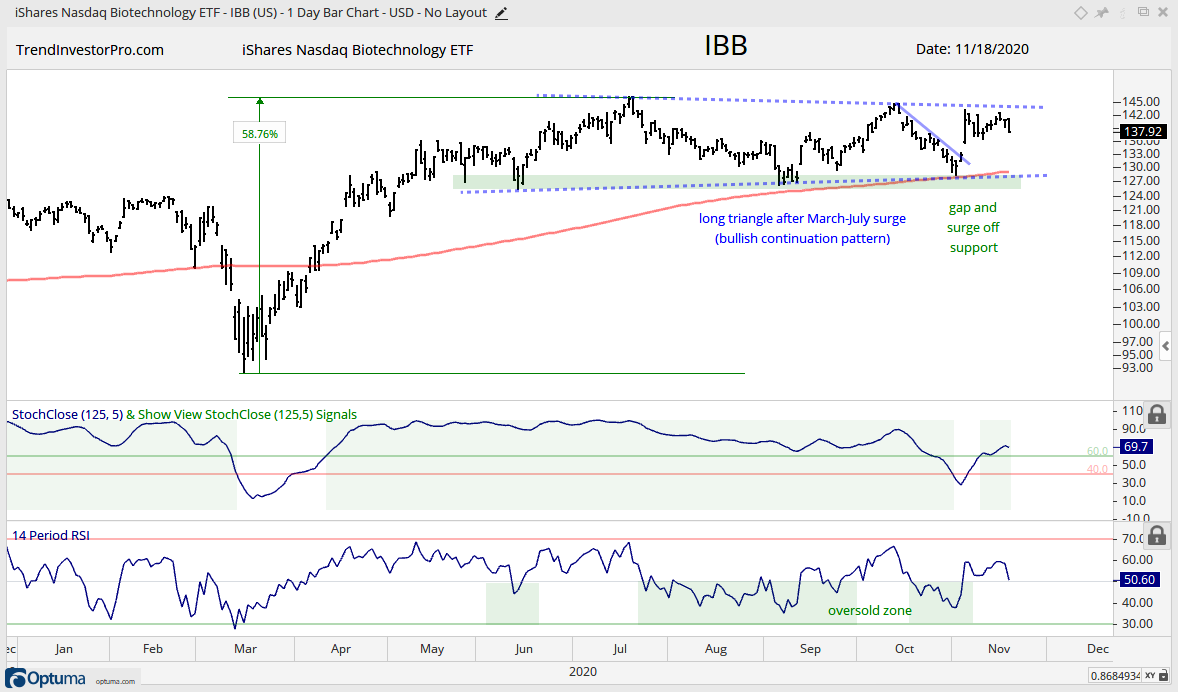
Stuck in Long Consolidation, No Follow Thru
IBB
The Biotech ETF (IBB) is above the rising 200-day with a big consolidation working. Even though this is a bullish continuation pattern, IBB has lower highs working the last few months and is underperforming everything that hit a new high in September/October and/or broke above its October highs recently.
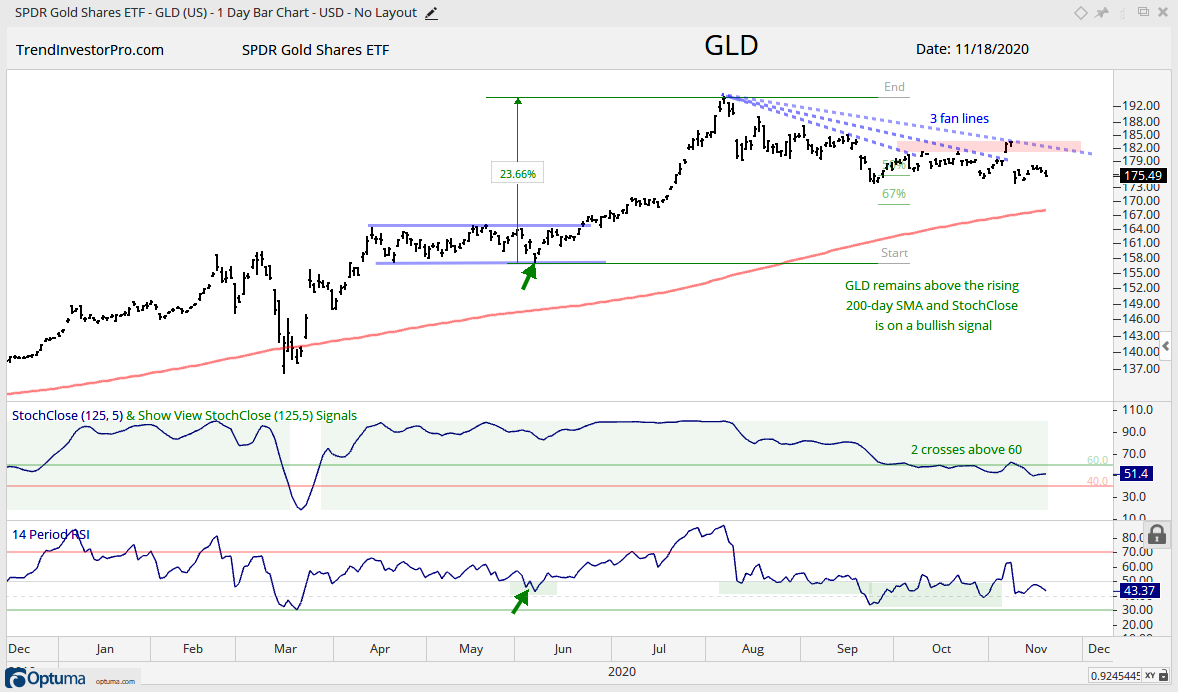
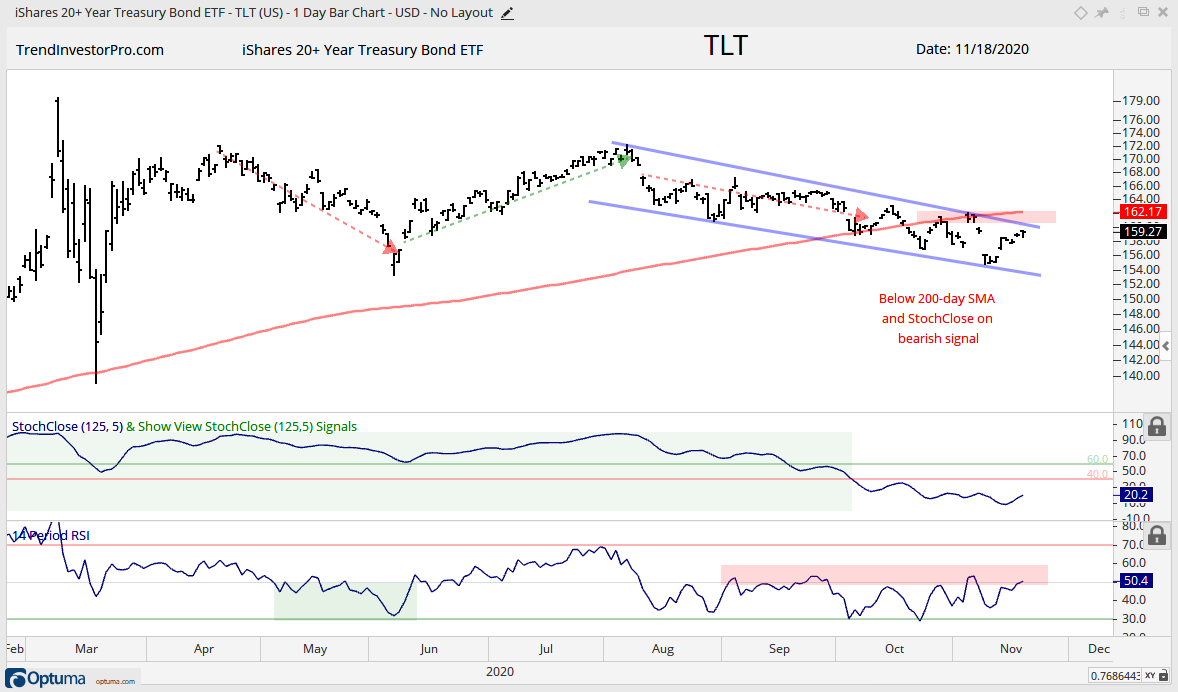
Downtrend since August
TLT, TIP, AGG, GLD, GDX, DBP
The 20+ Yr Treasury Bond ETF (TLT) and the Gold SPDR (GLD) are at the bottom of the ladder because they have been trending lower since August. TLT is clearly weaker because it is below its 200-day and the November low is below the October low. GLD still has the potential for a bullish continuation because it is above the rising 200-day. Three fan lines extend from the August high and a break above the third would reverse the downtrend.
")