The next report will be on Wednesday, January 15th.
The weight of the evidence remains bullish, but stocks have yet to recover from the December beat down. This means we are currently in a pullback or correction phase within a bigger bull market. One short-term breadth indicator shows improvement, but the other dipped to new lows and shows continued deterioration. SPY and QQQ remain with their pennant patterns, but small-caps broke to lower lows with sharp declines the last four days. There are still some sizable pockets of weakness within the stock market. At this point, we need to see evidence that the correction is ending and the bull market is resuming. Note that a thrust signal from the breadth indicators and short-term breakouts in the major index ETFs would provide such a signal.
Short-term Breadth Short of Thrust Signal
This report starts with two short-term breadth indicators: the percentage of stocks above their 20-day SMAs (%Above 20-day) and the percentage of stocks above their 50-day SMAs (%Above 50-day). %Above 20-day formed a bullish divergence over the last two weeks and this shows less downside participation. However, %Above 50-day continues to deteriorate. Both became oversold recently and this paves the way for an oversold bounce, but they remain short of thrust signals that would signal the start of a new leg higher.
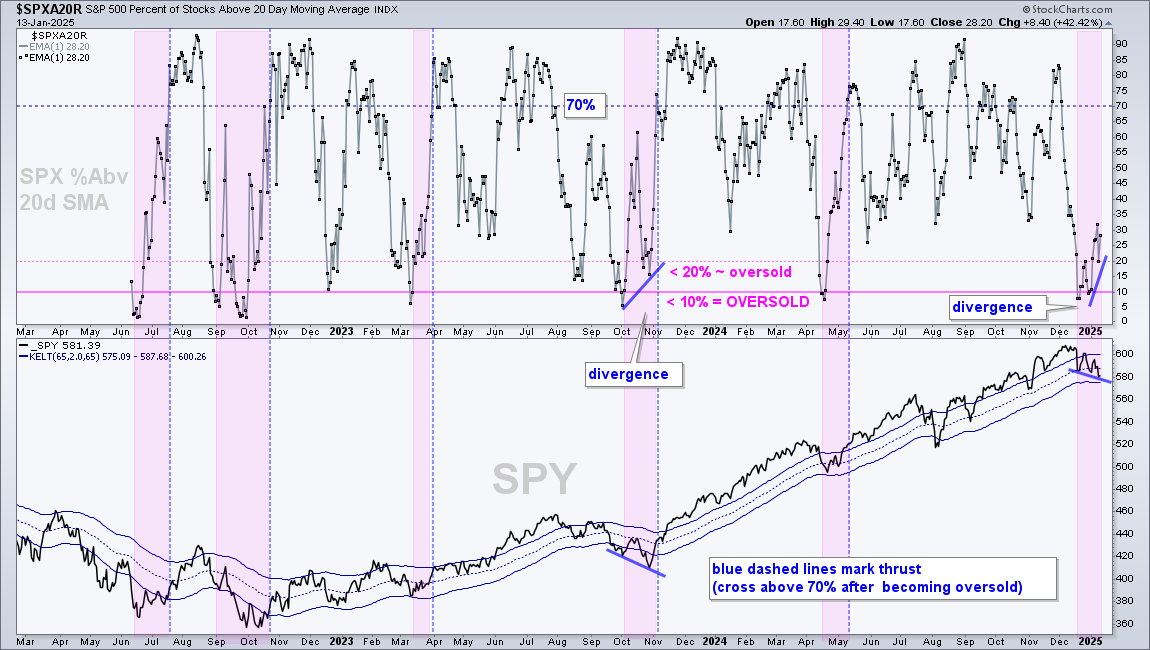
The first chart shows S&P 500 Percent Above 20-day SMA ($SPXA20R) in the top window and SPY in the lower window. The solid blue lines show the higher low in the indicator and the lower low in SPY (divergence). A surge above 70% would show a material increase in upside participation and this would be bullish.
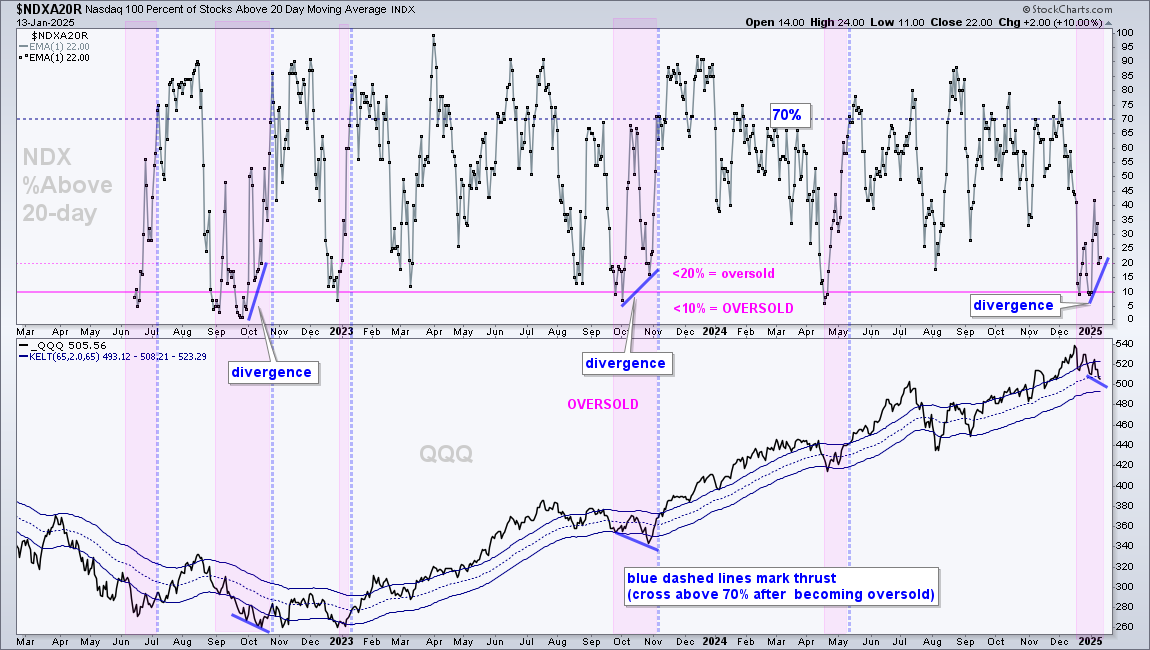
The next chart shows Nasdaq 100 Percent Above 20-day SMA ($NDXA20R) with a divergence forming over the last few weeks. The indicator became oversold with dips below 10% and held the 20% level with last week’s dip (blue line). The bottom window shows QQQ with a lower low. Breadth is diverging from price and this means fewer Nasdaq 100 stocks took part in the recent dip.
%Above 50-day SMA Indicators Have yet to Firm
The %Above 20-day SMA is more sensitive than %Above 50-day SMA because the moving average timeframe is much shorter. This means it is more prone to noise and false signals. The %Above 50-day SMA indicators did not form divergences and continued to weaken. This detracts from the divergence in the %Above 20-day indicators.
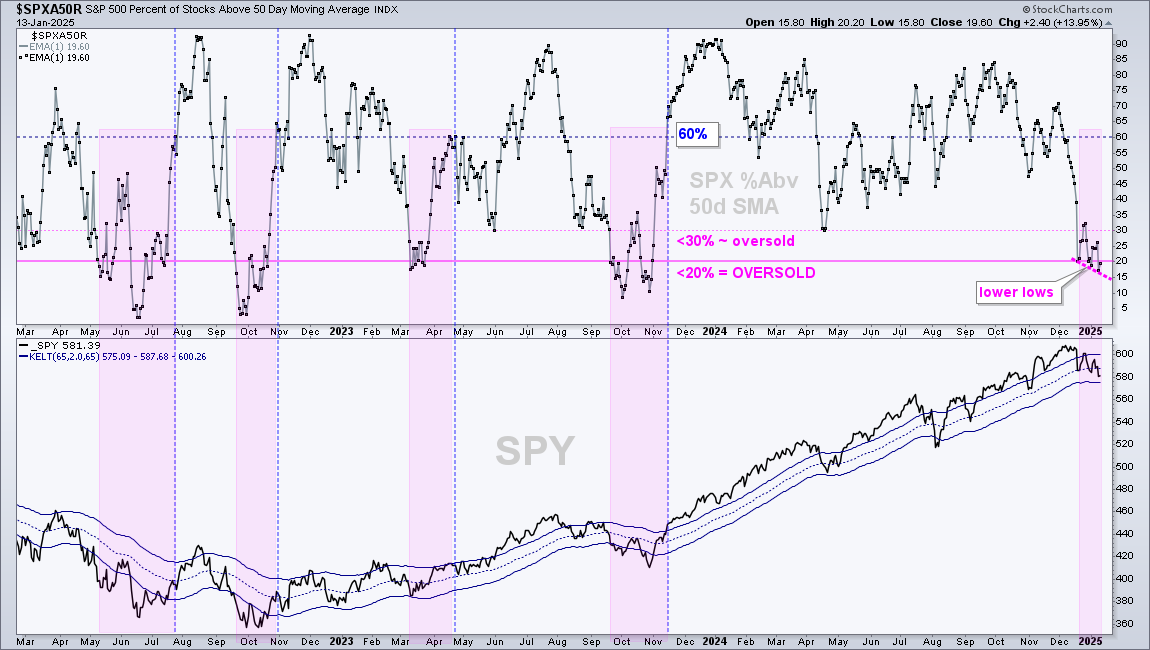
The first chart shows S&P 500 Percent Above 50-day SMA ($SPXA50R) moving below 20% three times in the last few weeks. This means it became oversold and remains oversold. The indicator reached 17% on Friday for its third lower low. Thus, downside participation increased for this indicator.
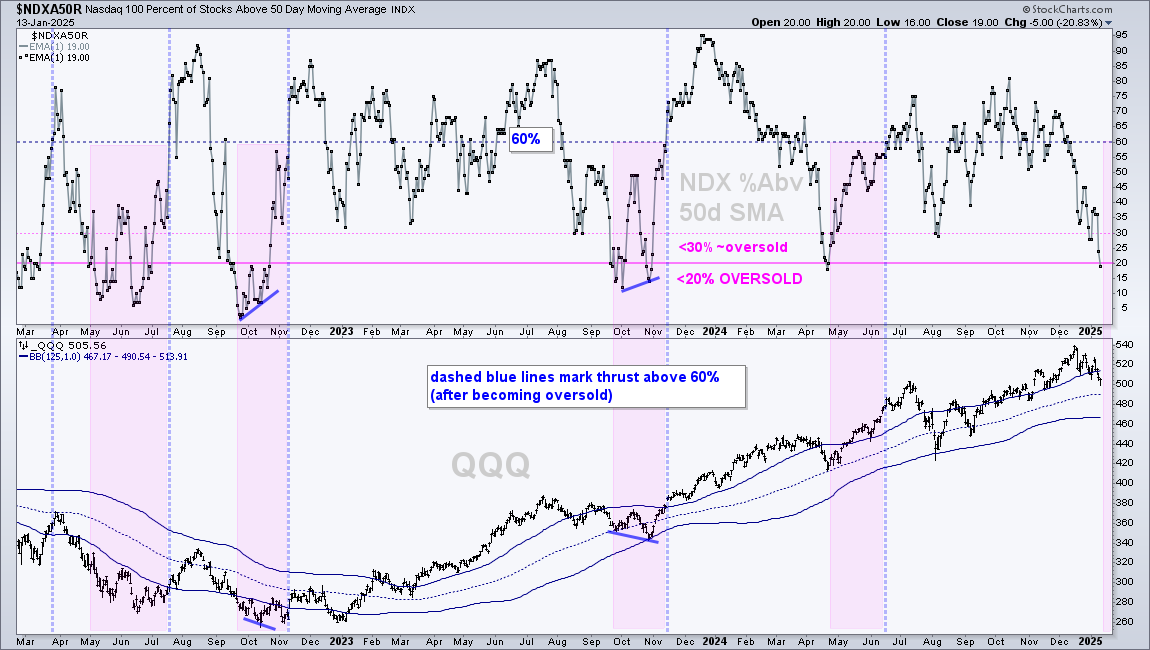
The next chart shows Nasdaq 100 Percent Above 50-day SMA ($NDXA50R) moving below 20% for the first time since April. Currently only 19% of Nasdaq 100 stocks are above their 50-day SMAs and this is the lowest reading since mid April. The indicator is oversold and this could give way to a bounce.
Overall, short-term breadth became oversold recently and this means stocks are ripe for a bounce. Will this be a dead-cat bounce or a bounce with legs? A bounce with a breadth thrust would show a material increase in upside participation and suggest that the bounce has legs. %Above 20-day needs to exceed 70% or %Above 50-day needs to exceed 60%.
SPY and QQQ Remain with Pennant Consolidations
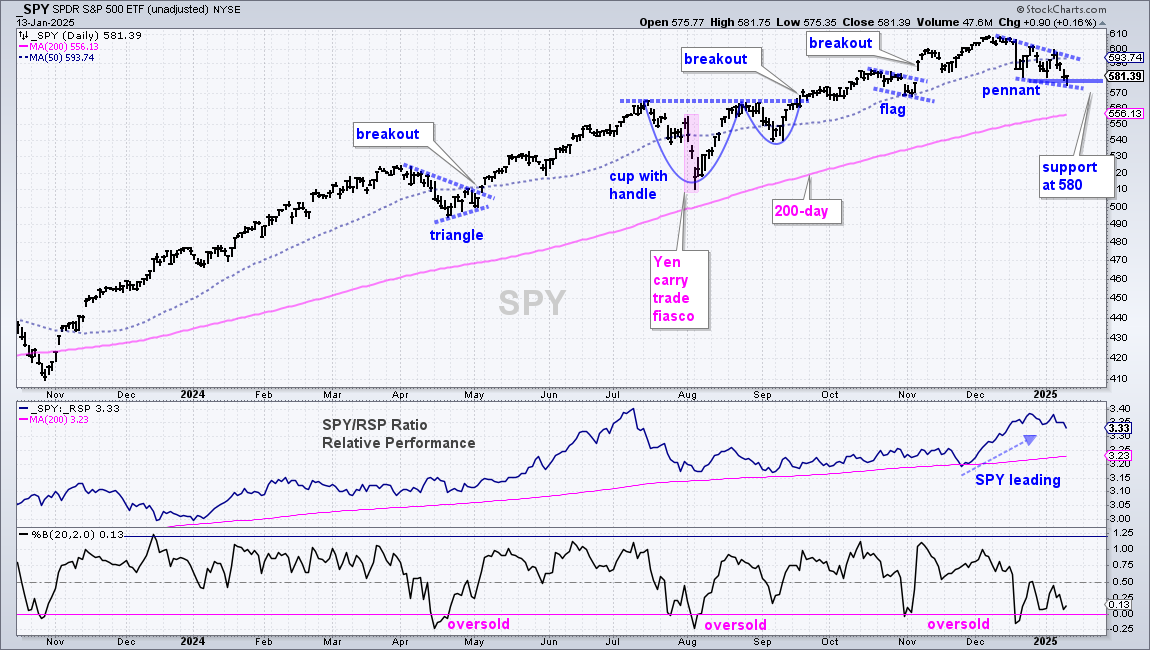
SPY remains in a long-term uptrend with a bullish pennant forming the last few weeks. The ETF became oversold in mid December as %B dipped below 0. This oversold condition means there was a pullback within the bigger uptrend and traders should be on watch for a bullish setup. On the price chart, SPY formed a pennant the last few weeks and this is a short-term bullish continuation pattern. A breakout at 600 would be bullish. I am marking short-term support at 580 and a break here would argue for a test of the rising 200-day SMA.
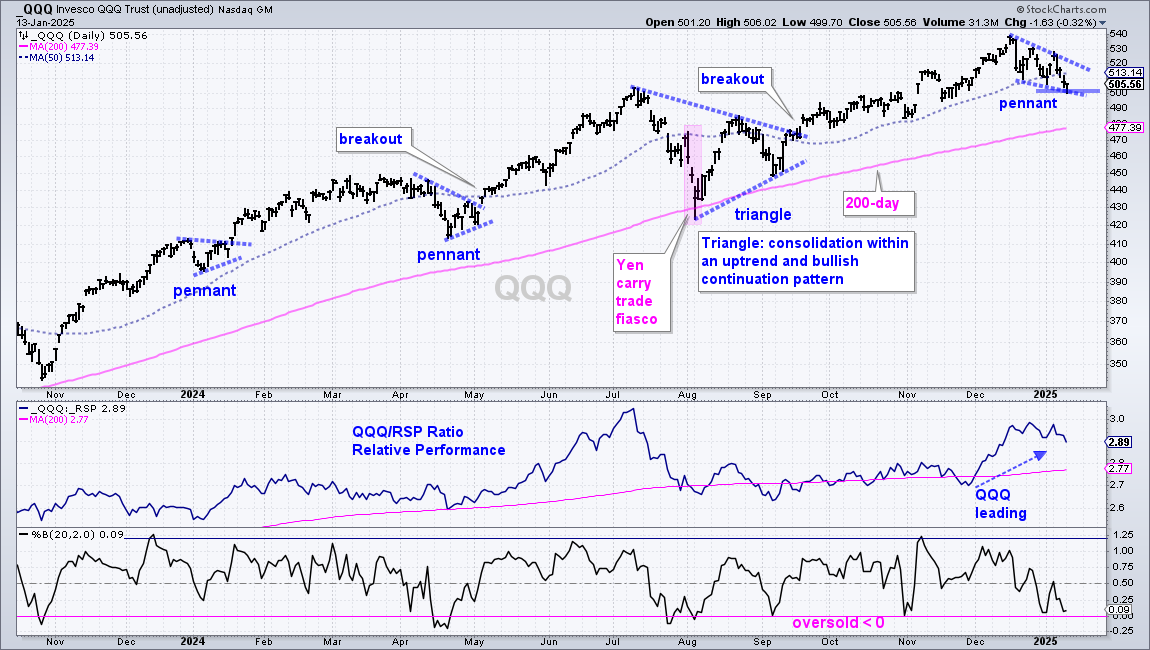
QQQ remains in a long-term uptrend with a bullish pennant taking shape. The ETF did not become oversold the last few weeks as %B held above 0. This means QQQ held up better than SPY, which became oversold. A breakout at 525 would confirm the pennant and signal a continuation higher. I am marking support at 500. A break here would negate the pennant and argue for a test of the rising 200-day SMA.
S&P 500 EW ETF Firms
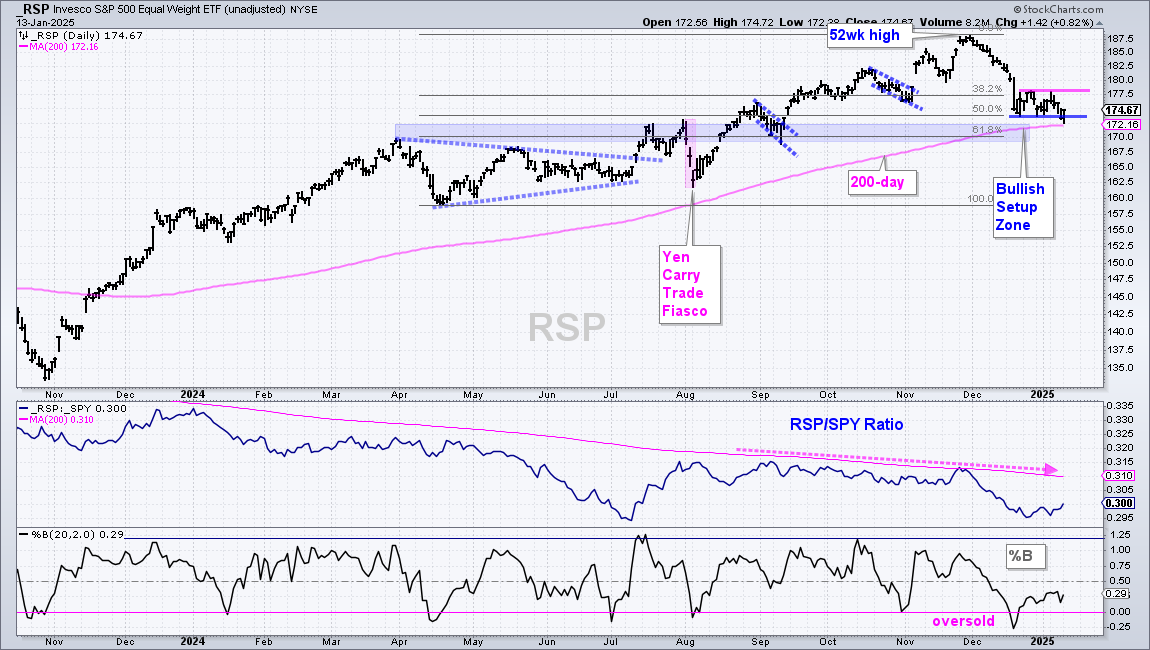
The S&P 500 EW ETF (RSP) consolidated the last three weeks with clear support and resistance levels that will help determine the next move for stocks overall. First, RSP remains in a long-term uptrend with a 52-week high in early December and price above the rising 200-day SMA. RSP fell sharply in December, became oversold as %B dipped below 0 and then firmed near a Bullish Setup Zone. The 50% retracement, broken resistance turned support and rising 200-day mark this zone (blue shading). This zone is where we can expect firming after a pullback and a possible upside reversal. The battle lines are drawn with the three week consolidation. A breakout at 179 would be bullish, while a break below 173 would be bearish. RSP represents the “average” stock in the S&P 500 so the direction of the break will have consequences for the broader market (mid-caps and small-caps).
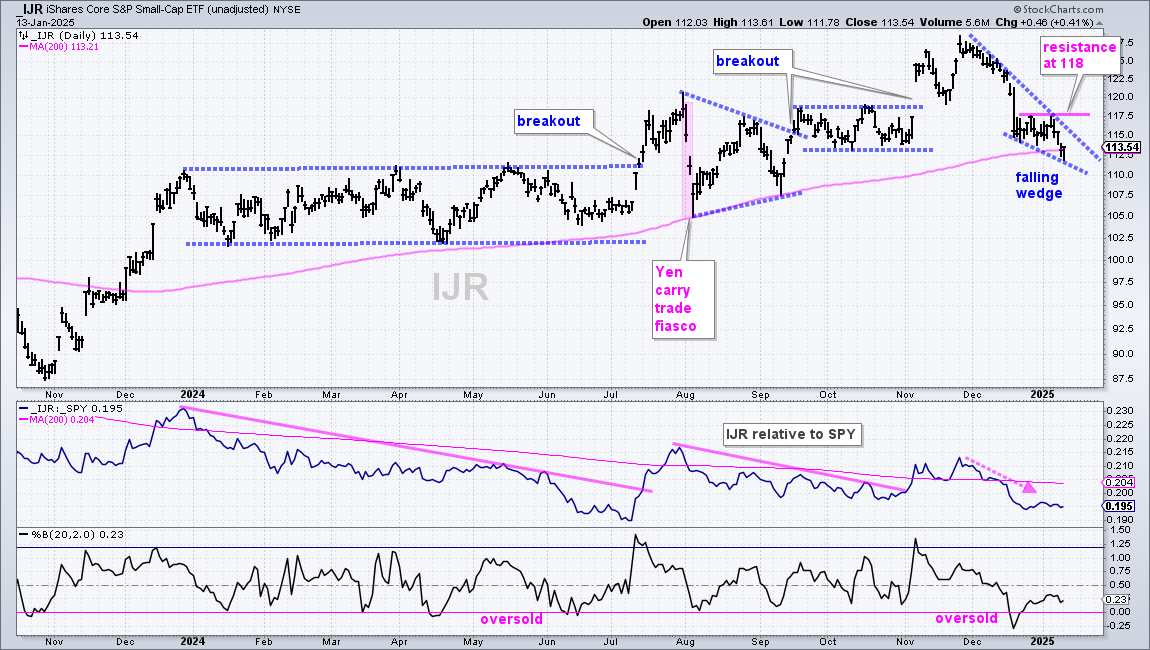
IJR is lagging SPY as it fell to the 200-day SMA the last few days and broke the late December lows. The long-term trend is still up with a 52-week high in late November and IJR is trading right at its rising 200-day SMA. A falling wedge is taking shape with resistance marked at 118. A breakout here would reverse the short-term downtrend.
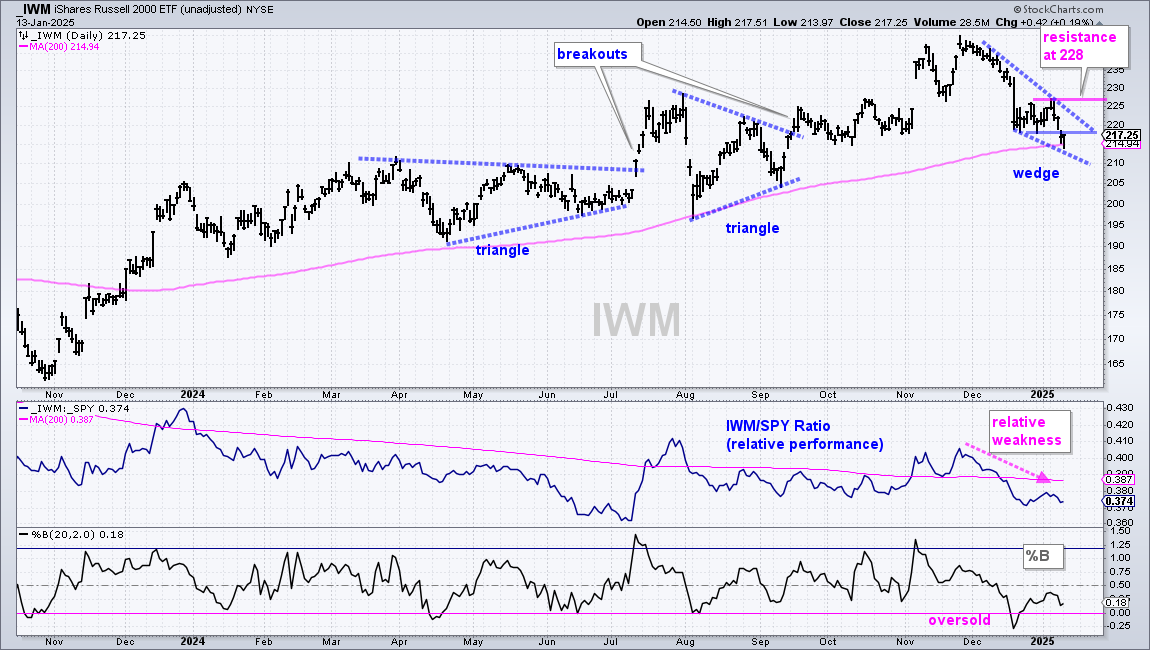
IWM is lagging SPY as it fell to the 200-day SMA the last few days and broke the late December lows. The long-term trend is still up with a 52-week high in late November and IWM is trading right at its rising 200-day SMA. A falling wedge is taking shape with resistance marked at 228. A breakout here would reverse the short-term downtrend.
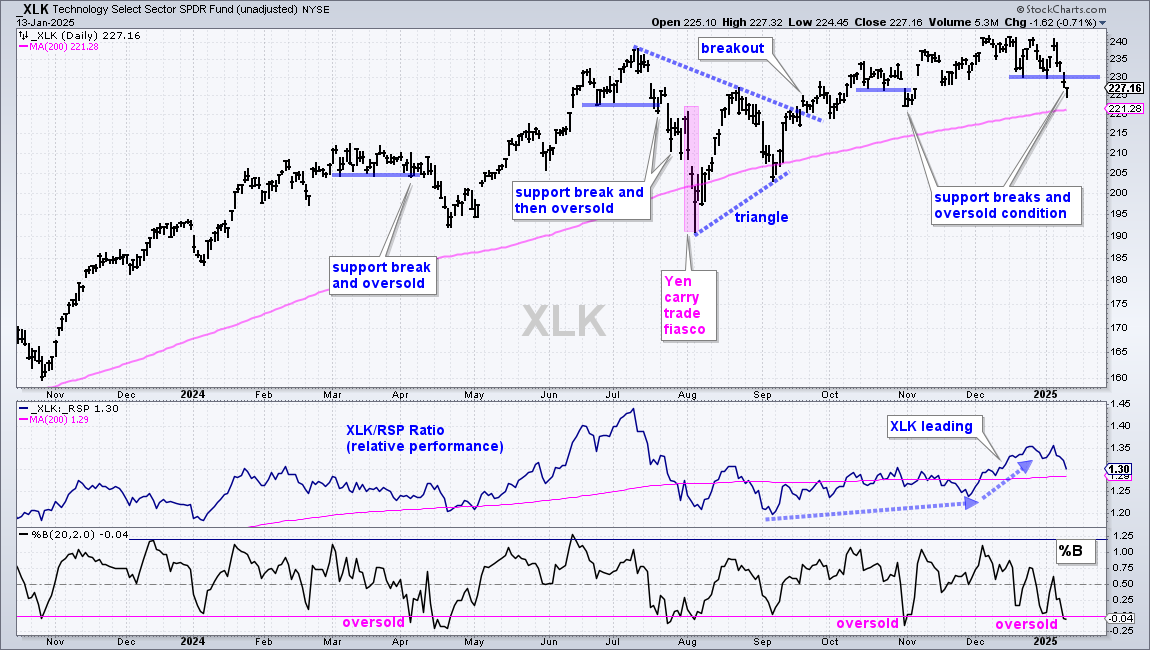
Technology SPDR Breaks Support and Becomes Oversold
The Technology SPDR (XLK) had a pennant working, but broke the late December lows and negated this setup. Even so, the ETF is still in a long-term uptrend and %B is oversold. Short-term support breaks are not sell signals. More often than not, they lead to a tradable pullback when the long-term trend is up. The chart shows short-term support breaks and oversold conditions in mid April, mid July, late October and now.
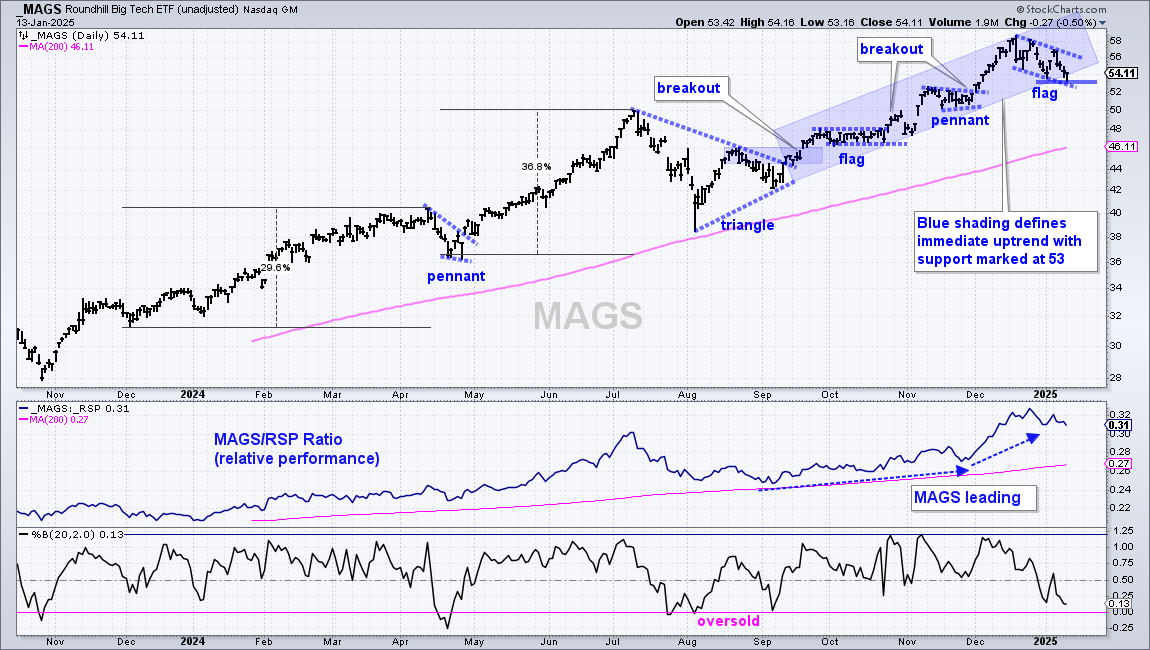
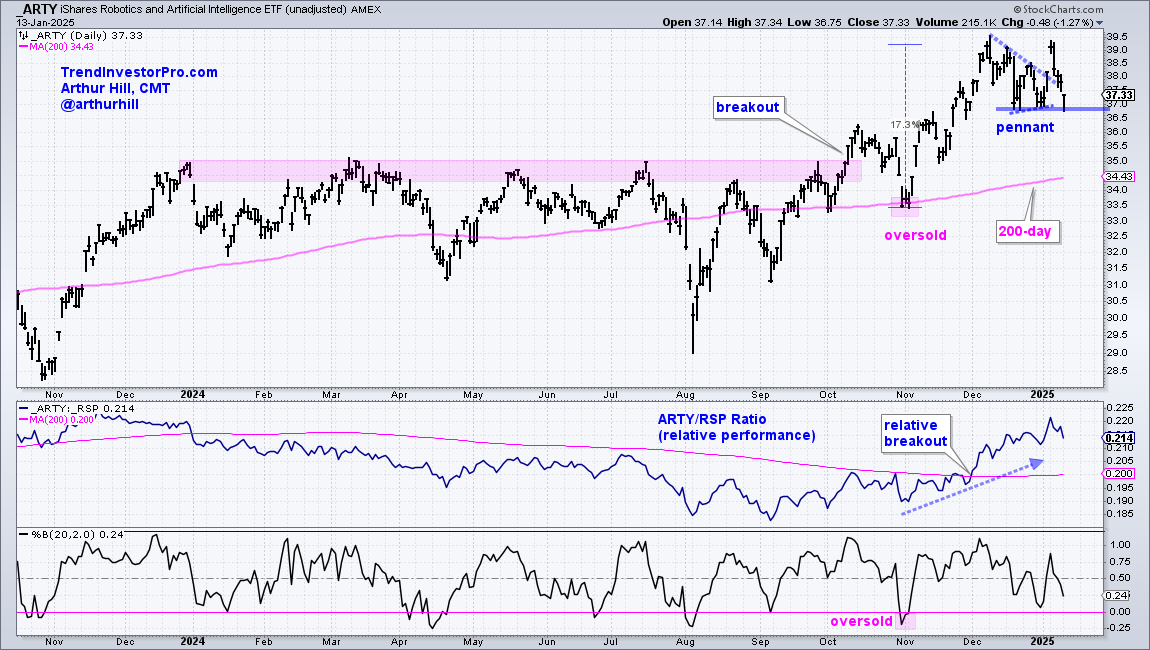
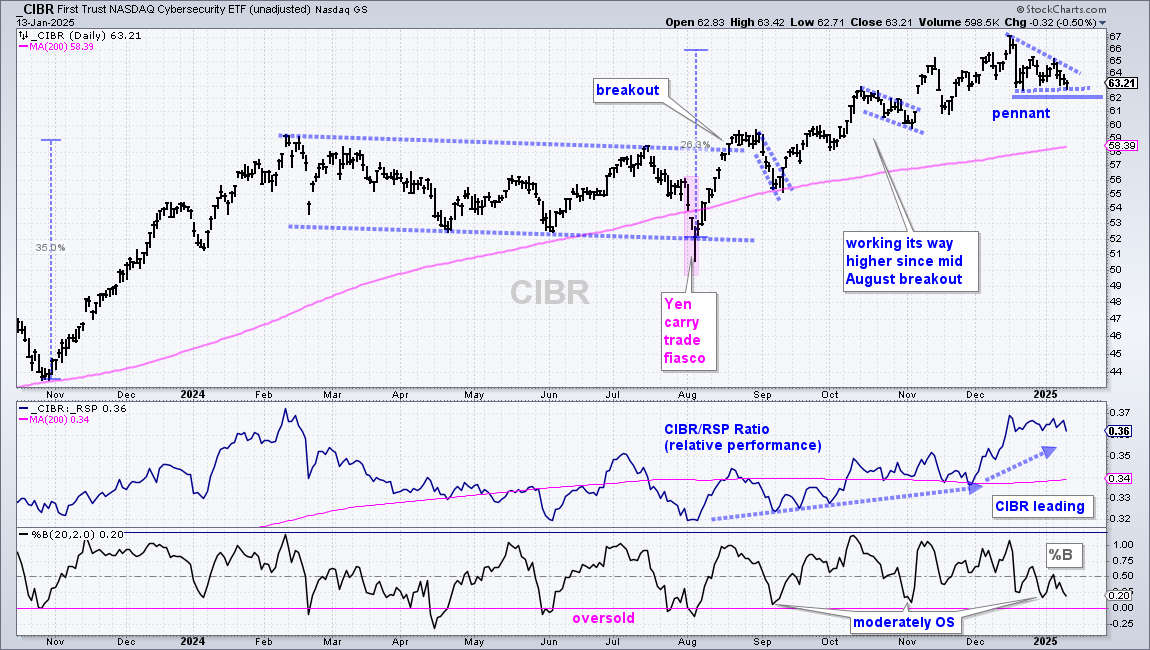
MAGS, ARTY and CIBR Hold Support
In contrast to XLK above, the next three charts shows the Mag7 ETF (MAGS), the Robotics & AI ETF (ARTY) and the Cybersecurity ETF (CIBR) holding up better over the last three weeks. All three formed short-term bullish continuation patterns and they remain in play.
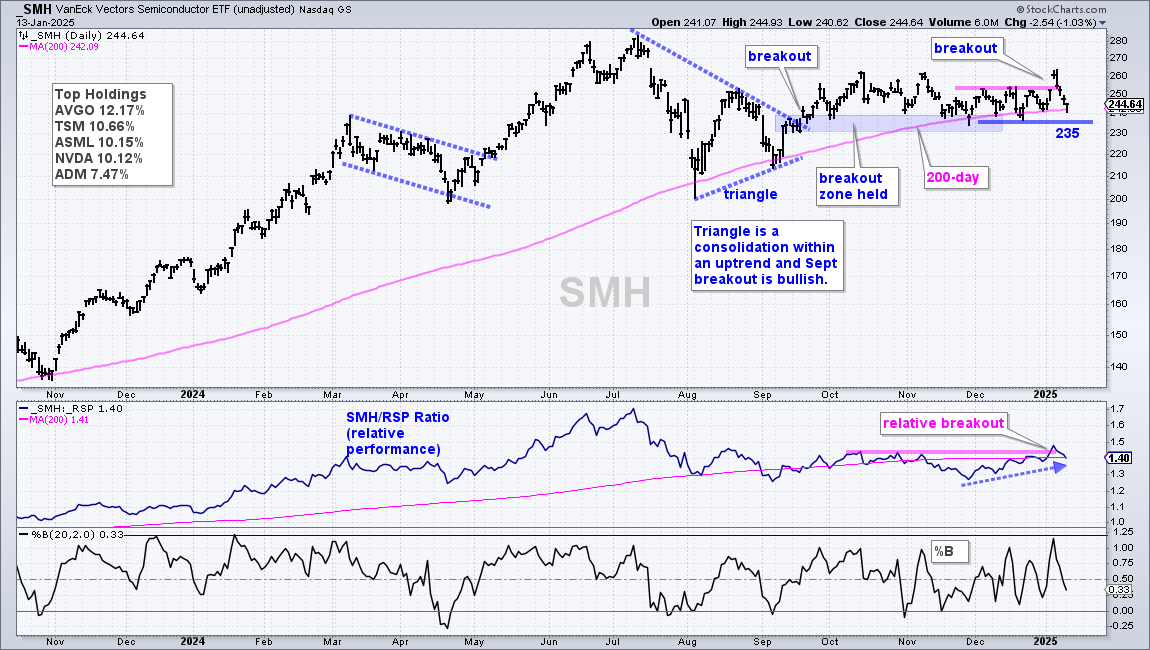
Semiconductor ETF (SMH) Still Holding Support
The Semiconductor ETF (SMH) broke its December highs with a surge on Monday and then fell back with the rest of the market over the last four days. I am not ready to call this breakout a failure and view the cup as half full. However, SMH is at a critical juncture as it tests support in the 235 area. The mid September triangle breakout is the dominant pattern and this breakout held, even though SMA is essentially flat this this breakout. The ETF is holding the 200-day SMA and prices are working their way higher since the August low. The bulls get the benefit of the doubt as long as 235 holds. A break here would be negative for semiconductors, the Technology sector and the broader market.
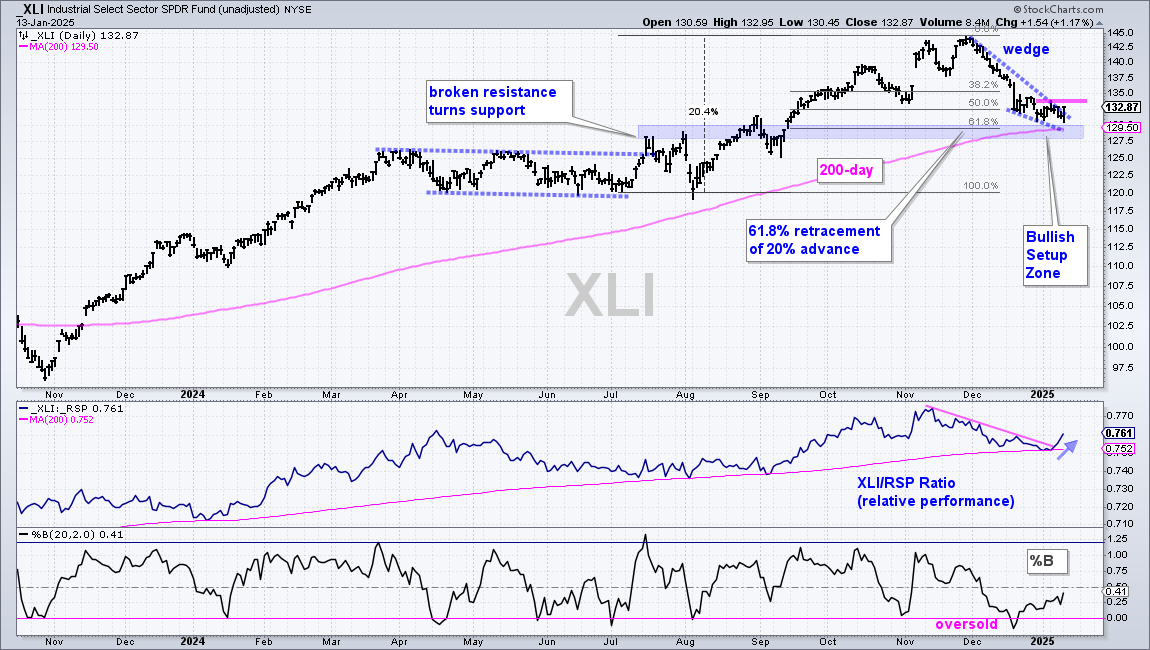
Industrials and Defense Forms Bullish Wedges
The Industrials SPDR (XLI) is trading near a Bullish Setup Zone with a falling wedge taking shape. The blue shading marks broken resistance turned support, the 61.8% retracement and the rising 200-day SMA. This is an area to watch for support and a reversal when the bigger trend is up. Also note that %B became oversold in mid December. XLI is firming, but remains short of a breakout. Resistance is set at 134 and a breakout here would be bullish. The middle window shows the price-relative (XLI/RSP ratio) turning up in January as XLI shows signs of relative strength (blue arrow). Note that a breakout in this sector would be positive for the market.
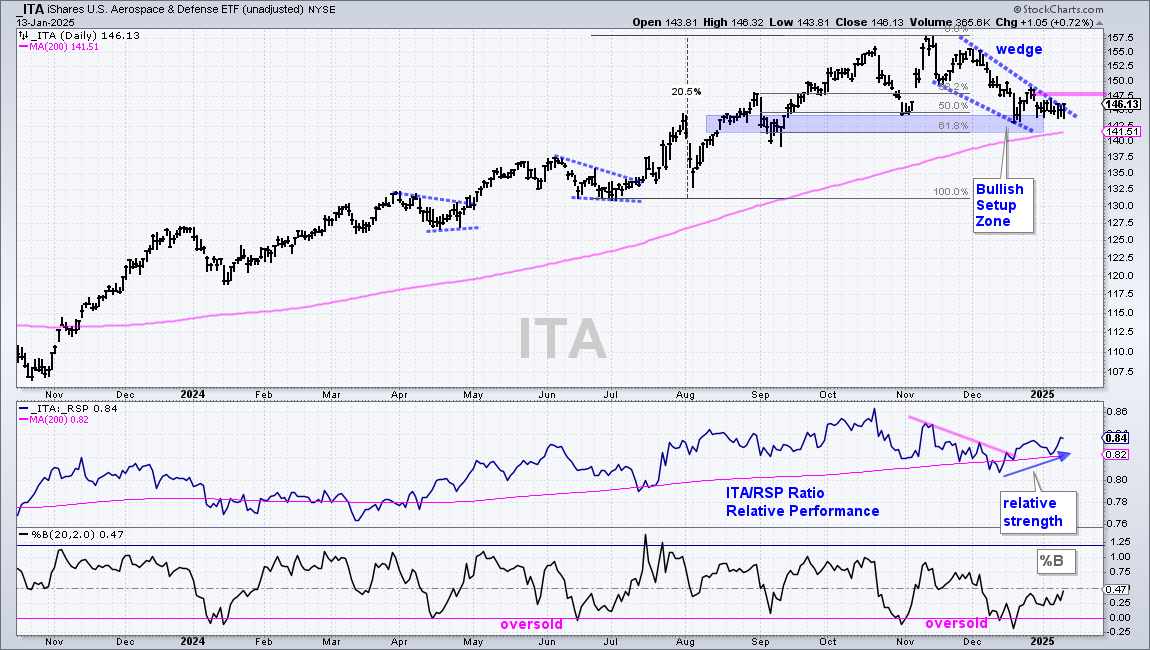
The Aerospace & Defense ETF (ITA) shows relative strength as a bullish wedge takes shape. First and foremost, the long-term trend is up because ITA hit a new high in November and price is above the rising 200-day SMA. The ETF fell from mid November to December and this is deemed a correction within the bigger uptrend. ITA hit the Bullish Setup Zone in late December and firmed into January. I am marking resistance at 148 and a breakout here would reverse the short-term downswing. The middle window shows the price-relative (ITA/RSP ratio) turning up the last few weeks as ITA starts showing relative strength again.
")