Research & Education

-Research/Education

8 Trend-Following Indicators – Impulse/In-State Signals -Thresholds – Combining with Momentum (Premium)

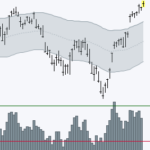
This report/video covers eight trend-following indicators: BBands, Keltner Channels, Donchian Channels, StochClose, %Difference betw SMAs, ROC of SMA, CCI-Close and eSlope. We show how to reduce whipsaws with smoothing and signal thresholds. Each indicator is explained with chart examples. These samples include good trades and bad trades because whipsaws are guaranteed.

Read More »
-Research/Education

Market Timing Models Improve Long-term Performance

The Composite Breadth Model (CBM) turned negative on Monday (-1) and the weight of the evidence is now bearish for stocks. This development means risk in stocks is above average. Strategies that trade stocks and stock-based ETFs perform poorly when risk is above average

Read More »
-Research/Education

Why Use Market Filters?, Indicator Settings Are Double-Edged Swords, the Best Performing Market Filter

Today’s report will dive into the market filter, which is used to define bull and bear markets. Market filters are an important part of trend-following and momentum strategies that trade stocks and stock-based ETFs. The Composite Breadth Model has not worked well over the last 15 months, but this is a relatively short timeframe in the grand scheme

Read More »
-Research/Education

Separating Consistent Trends from the Inconsistent Trends

In an ideal world, trends would be consistent and persist for months. An ideal uptrend would march higher by consistently recording higher highs and higher lows. Once reversed, a downtrend would take over and work its way lower with lower lows and lower highs. There are plenty of chart examples for these consistence and persistent trends.

Read More »
-Research/Education

Identifying and Trading the Falling Wedge (Video) – Successes, Failures and Two Current Setups

The falling wedge is a bullish continuation pattern that chartists can use to trade or invest in the direction of the underlying trend. I realized that some books show falling wedges as bullish reversal patterns, but I am only interested in bullish continuation patterns and I choose to ignore names that are hitting new lows. This video will show

Read More »
-Research/Education

Turn of the Month Strategy – Strong Long-term Performance, Beats Buy-Hold, Some Weak Months

The turn of the month shows a strong bullish bias with an extremely stable equity curve that really took off the last few years. This strategy, which is only invested 38% of the time, outperformed buy and hold with a higher Compound Annual Return. Overall, the eight day percentage change at the turn of the month is positive 68% of the time for SPY. Despite strong numbers overall, February is weakest month when testing over the last twenty years, and we just happen to be in February.

Read More »
-Research/Education

Exit Indicators – Trend Reversal, Chandelier, Parabolic SAR and ATR Trailing Stop – Resources

Chartists trading oversold bounces and short-term bullish continuation patterns have two basic choices when it comes to an exit: trailing stop or trend reversal. Trailing stops are used initially as stop-losses and then trail price if/when it moves higher. Trend reversal exits are used to accumulate during an uptrend and exit when the longer-term trend reverses. This article will cover the trend reversal exit and three trailing stop alternatives.

Read More »
123
-Research/Education

Identifying Trend Changes and Tradable Pullbacks within Uptrends (w/ Video)

2021 is just around the corner and chartists without a strategy should think long and hard about getting one. Trading in the direction of the trend is pretty much my bread and butter strategy. I do not fish for bottoms or attempt to pick tops. Tempting as it often is, I try to refrain from such endeavors as much as possible. More often than not, we are better off using trend-following indicators to identify bullish and bearish trend reversals

Read More »
Scroll to Top