
Pattern Trading vs A Systematic Approach for ETFs
Trading short-term patterns can be messy business with whipsaws, failed breakouts and support breaks. This is especially true for ETFs, which have dozens of moving parts (stocks). Each stock has its
Research & Education

Trading short-term patterns can be messy business with whipsaws, failed breakouts and support breaks. This is especially true for ETFs, which have dozens of moving parts (stocks). Each stock has its

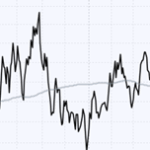
This report focuses on the Trend Composite, which is a long-term trend-following indicator. First, I will shows the 5/200 cross for reference. Second, I dissect the components of the Trend Composite and show how it works. Third, I will show why we should be using data that is not adjusted for dividends. We then get into recent Trend Composite signals within the S&P 500 and show four
SPY and QQQ crossed above their 200-day SMAs with big moves on Monday, and held above these long-term moving averages the entire week. The V-Reversal was extraordinary and SPY seems short-term overbought, but this cross above the 200 day SMA cross is a bullish signal for the most important market benchmark. Despite a bullish signal, long-term moving averages are

Stocks plunged into early April and surged into early May, suggesting that a “V” reversal is in the making. With the recent gains, SPY is back near the 200-day SMA and 61.8% retracement, which puts this key benchmark at an “interesting” juncture. Interesting? Yes. Bull market? No. What does it take to go from an interesting juncture to a bull market?

The market does not always follow the same script or sequence, but bear markets end with a bottoming process that often goes in stages. First, there is the capitulation phase, which suggests that selling pressure reached extremes and a bottom may be close. There was a capitulation setup in early April. Second, short-term thrust indicators mark a sharp recovery after an

Developed by the late great Marty Zweig, the Zweig Breadth Thrust uses advance-decline data to identify material shifts in participation. This indicator sets up with when the advance-decline data becomes oversold and triggers when there is a sharp broadening in upside participation (advancing stocks). It is a time sensitive indicator that must trigger within a 10 day window.

Successful trading strategies use filters to improve the odds. Market filters tell traders when to trade and when not to trade. Trend filters decide which names to trade and which to avoid. For equity strategies, traders can improve their odds by trading only in bull markets, and only trading names that are in uptrends. This report first covers market and trend filters, and then shows how the Trend Trio indicator can reduce whipsaws.

Price and breadth indicators are hitting panic levels as investors indiscriminately dump stocks. Several key indicators already reached extremes that could foreshadow a bounce. However, these extremes result from strong selling pressure and increasing downside momentum, which is bearish. The vast majority of stocks moved into long-term downtrends and new lows surging. Such serious technical damage is unlikely to be reversed with the first bounce.

The market gods smiled upon us in 2024 as stocks advanced throughout the year. 2025 is turning out differently as the major index ETFs reverse their long-term uptrends and two of the three market models turn bearish. As painful as they are, bear markets and corrections are part

2024 was a good year, even though it finished with a drawdown in December. The rotation trader strategies put in solid performances, especially RO-Trader-SPX. The rotation investor strategies started off well in November, but took a hit in December as the market fell. Momentum rotation strategies follow the ebb

Not all pullbacks result in long-term trend changes and not all drawdowns lead to bear markets. The odds favor the bulls as long as the bull market signal is valid and drawdowns provide opportunities during bull markets. Today’s report will analyze the drawdowns in the Rotation Investor strategies. We will show the Maximum Drawdown, Median Drawdown and a drawdown range for putting money to work.

Momentum-Rotation strategies get their edge from upward momentum. More often than not, this means there will be entry signals for stocks that seem overbought. Not all overbought stocks continue higher and some correct hard after becoming overbought. Can we improve performance by avoiding stocks that are extremely overbought? Today’s report will discuss the recency bias, show some overbought examples and puts an overbought filter to the test.

It is important to understand the ebb and flow of the equity curve when trading a strategy. How long is the strategy flat or down? How often do we see strong momentum runs? How often does the strategy experience double-digit drawdowns? How can we take advantage of drawdown? We will answer these questions and more.

Buying stocks that seem overbought is difficult, but this is often required when trading a momentum-rotation strategy. By design, these strategies buy the strongest stocks and many seem “overbought”. Momentum is all about buying high and selling higher. This report will test the original Rotation Investor strategies with the addition of an overbought filter. In other words, we will avoid stocks that are overbought. Does this filter help or hurt performance?

Everyone has a trading plan until they go into drawdown. The Dual Momentum Rotation Strategies are off to a great start here in 2024. This is the easy part. Don’t forget that RISK is always lurking in the equity markets and this is something we must always take into account. There is no reward without risk.