Global Clean Energy ETF Stalls after Flag Breakout
The stock market remains quite mixed, but the pockets of strength are still larger than the pockets of weakness. Some 60% of S&P 500 stocks are above their 200-day SMAs, but this means 40% are below, and in long-term downtrends. There is a large pocket of weakness within the S&P 500. Mixed markets make trading difficult because our odds of success are reduced. Keep this in mind. The Fed starts its two-day meeting today (Tuesday) and will make its policy statement on Wednesday afternoon. In addition, the 10yr T-Yield is at a make or break level. We can expect some extra volatility this week.
A Mixed Bull Market
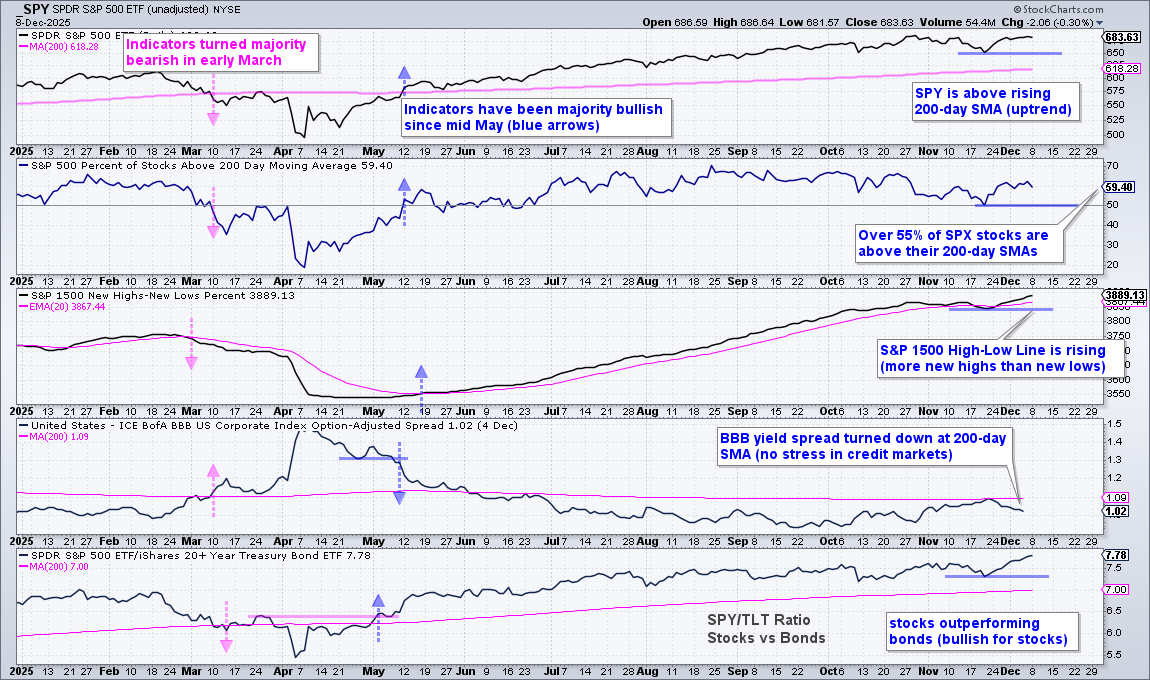
The weight of the evidence remains bullish for stocks. SPY is above its 200-day SMA and trading close to a new high (uptrend). 59% of S&P 500 stocks are above their 200-day SMAs, which means the vast majority of component stocks are still in long-term uptrends. And finally, the S&P 1500 High-Low Line hit a new high this week as new highs continue to outpace new lows. Blue lines mark key levels to watch for all three. These include the November low for SPY, the 50% level for $SPXPA200 and the High-Low Line.
The BBB yield spread hit its 200-day SMA and turned down (narrowed) the last two weeks. This shows increasing confidence in the credit markets. A move above the 200-day SMA would show widening and increasing stress. The SPY/TLT ratio hit a new high as stocks (risk assets) continue to outperform bonds (safe havens).
SPY Consolidates after New High
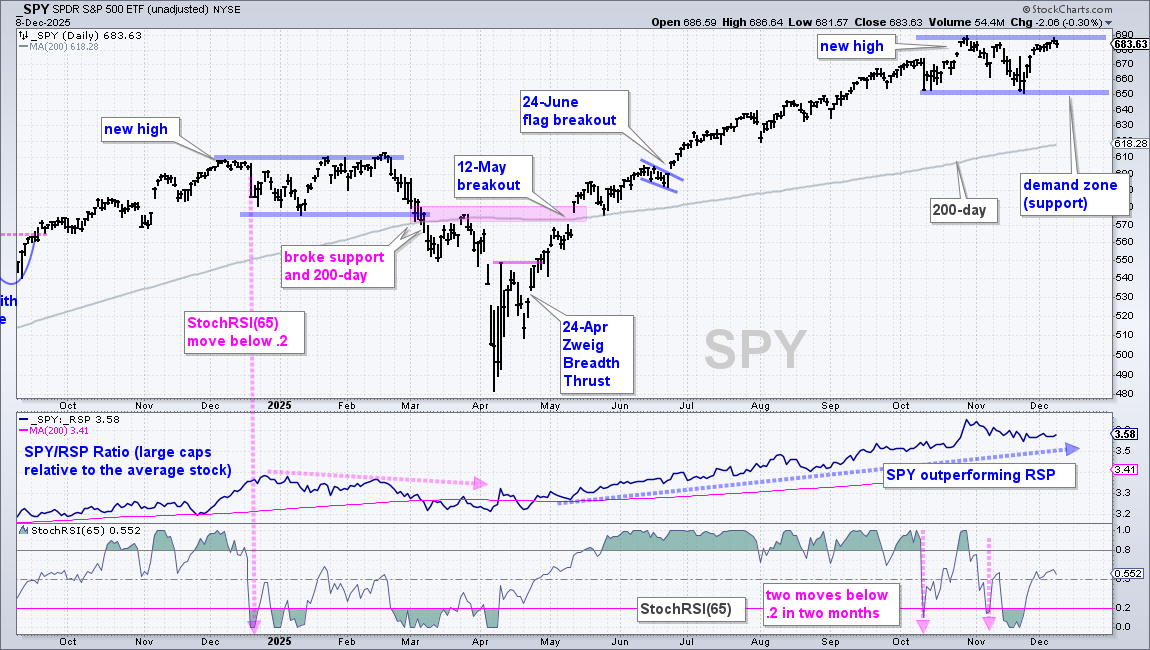
SPY moved into a long-term uptrend with the mid May breakout and has yet to reverse this uptrend. The ETF hit a new high in late October (690), dipped to the 650 area in November and returned to its October high. The thick blue lines mark the current trading range, which is a bullish consolidation or a distribution pattern (top). A break above 690 would extend the uptrend, while a break below 650 would argue for a correction to the 200-day SMA. What happens between 650 and 690 is anyone’s guess.
StockRSI(65) argues for a correction. The bottom window shows StochRSI(65), which is the Stochastic Oscillator applied to RSI. This indicator captures the momentum of momentum. StochRSI plunged below .20 twice since October. These reflect bearish momentum thrusts that can foreshadow a correction, as in December 2025 (pink arrows). Also notice that SPY traded flat after the bearish thrust in December 2025 and did not break down until early March, 53 days after the bearish thrust. The first bearish thrust was on October 10th, 40 days ago.
QQQ Holds Flag Breakout
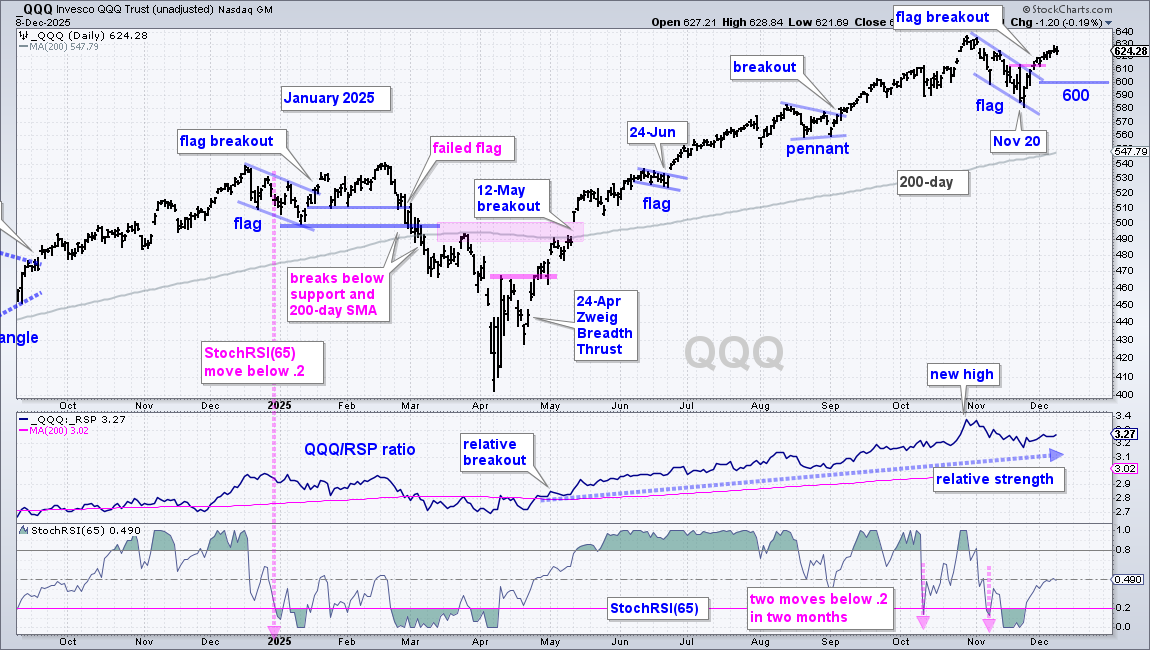
QQQ moved into an uptrend with the breakout in mid-May and remains in a long-term uptrend. The ETF hit a new high in October, corrected with a falling flag into November and broke out with a surge in late November. This breakout is valid as long as the late November surge holds. A break below 600 would erase this surge and negate the breakout, which would be bearish. I would then expect a correction towards the rising 200-day SMA.
As with SPY, StochRSI(65) is arguing for a correction after two bearish momentum thrusts since October. We can also study price action from December-January for clues on current conditions. QQQ triggered a bearish momentum thrust in late December (pink line), formed a flag and broke the flag line in mid January. This breakout held into February and then failed with the break below 510. The failed flag was the first bearish sign. QQQ then broke the January low and 200-day SMA in early March.
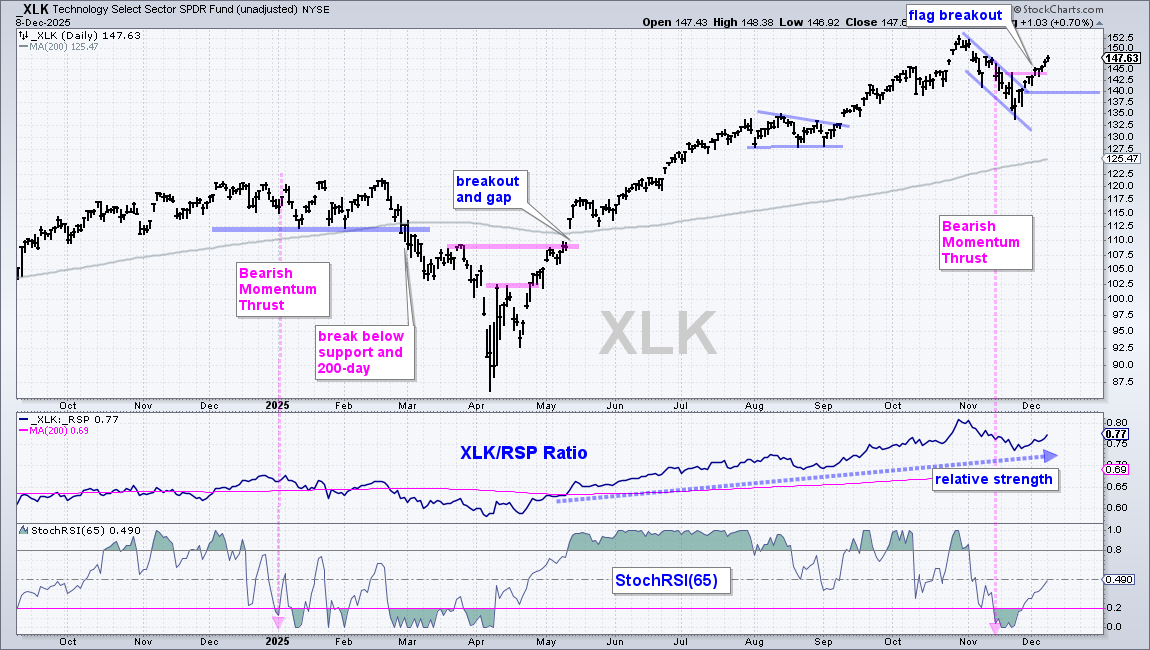
The next chart shows Technology SPDR (XLK) with a similar picture. A close below 140 would negate the flag breakout and argue for a deeper correction.
Flag Breakouts in Tech Related ETFs
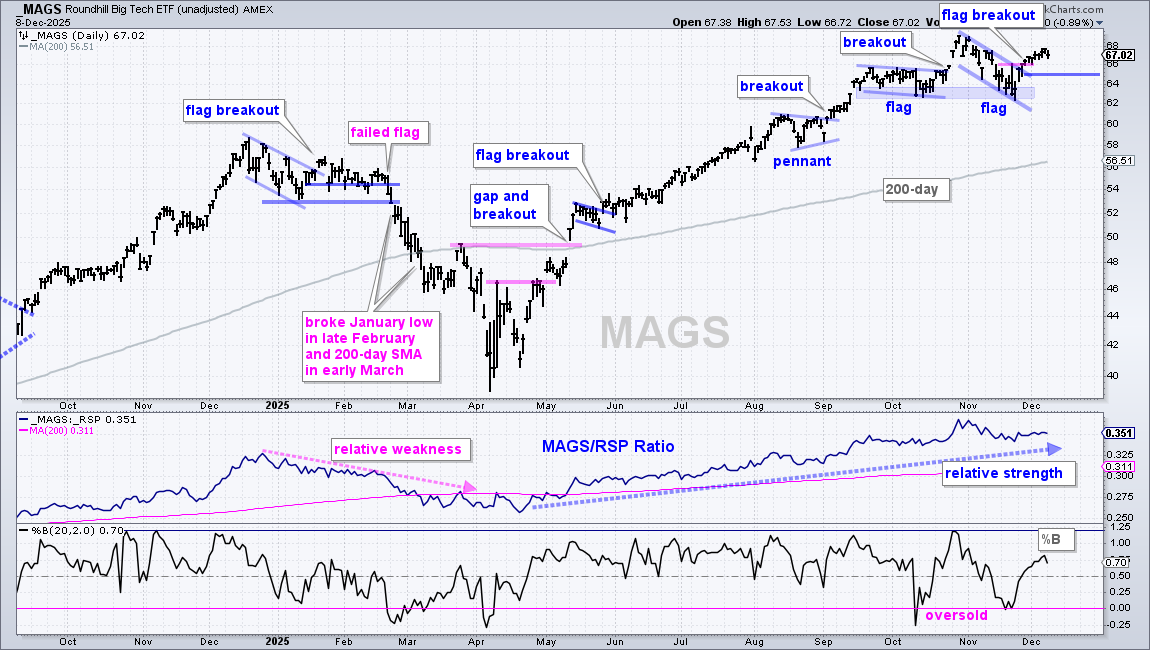
These next charts show five leading tech-related ETFs with their flag breakouts and re-evaluation levels. The Software ETF (IGV), Cybersecurity ETF (CIBR), Cloud Computing ETF (SKYY) and ARK Innovation ETF (ARKK) are not included because they are lagging since October. The first chart shows the Mag7 ETF (MAGS) with a flag breakout and re-evaluation support at 65.
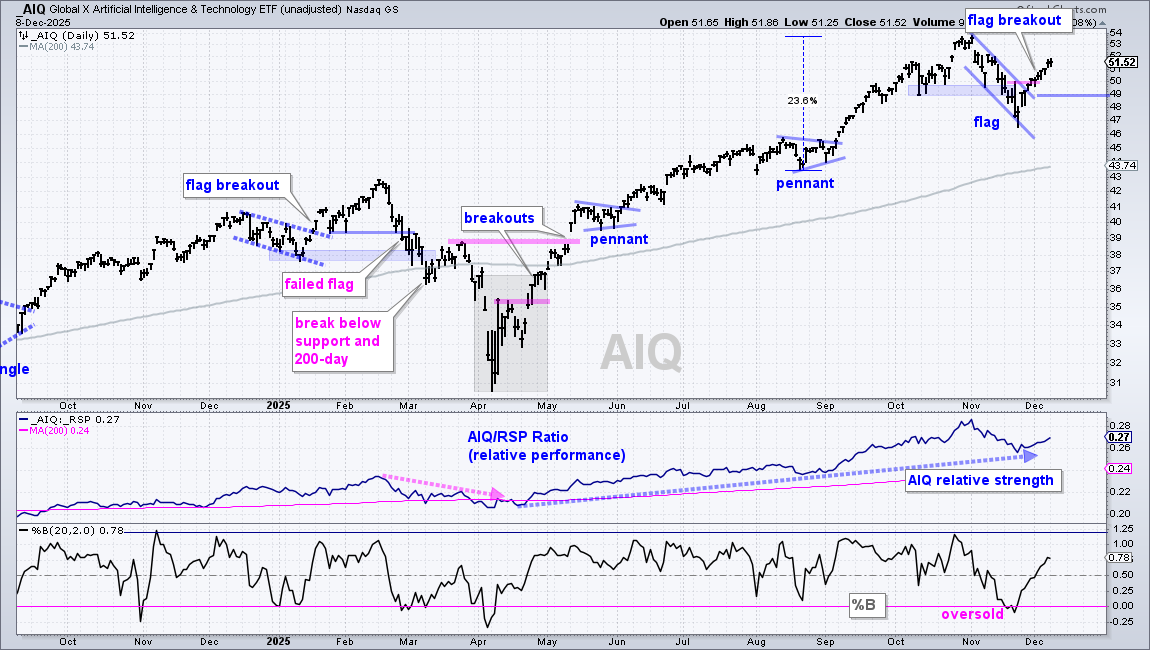
The next chart shows the Global AI & Tech ETF (AIQ) with a flag breakout and re-evaluation support at 49.
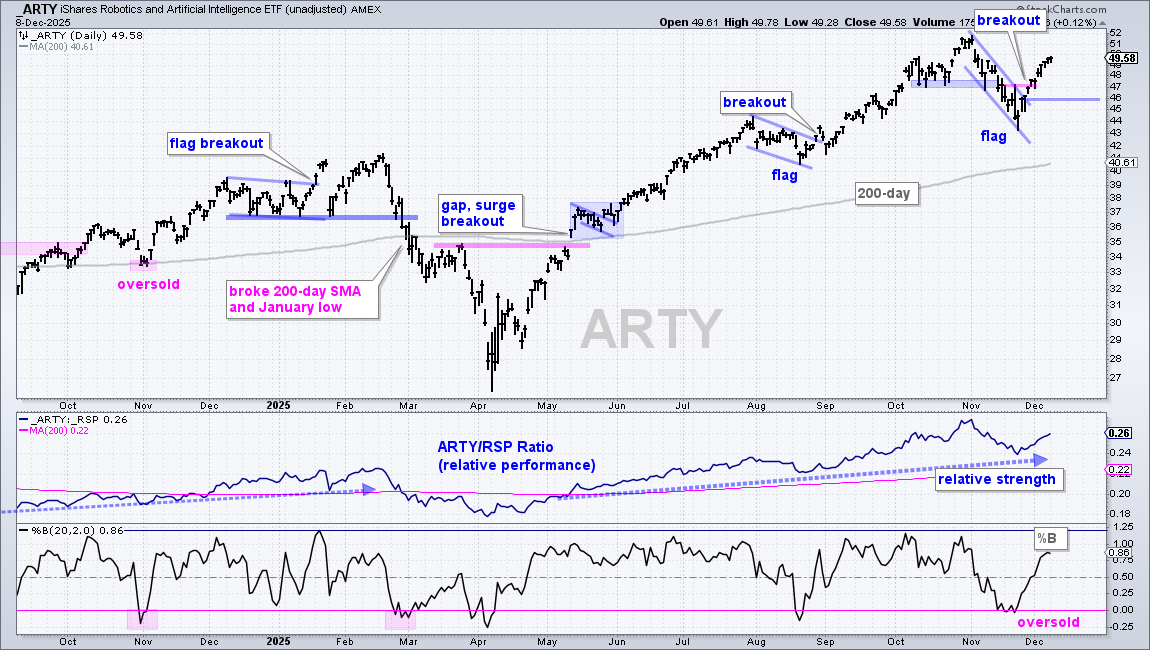
The next chart shows the Robotics AI ETF (ARTY) with a flag breakout and re-evaluation support at 46.
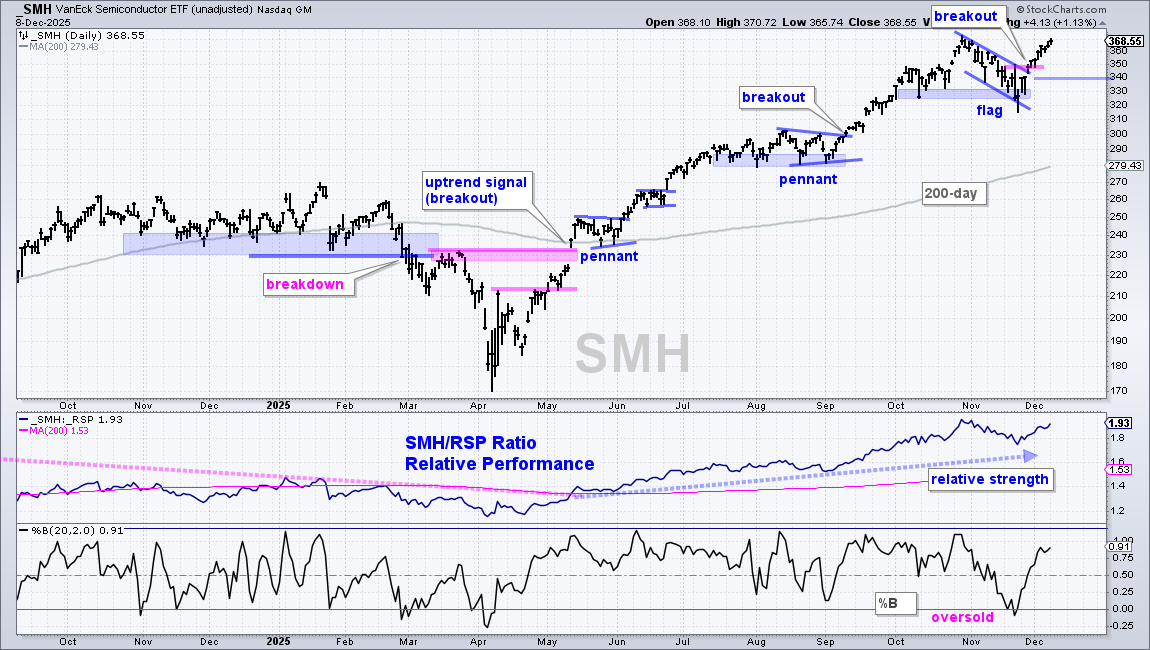
The next chart shows the Semiconductor ETF (SMH) with a flag breakout and re-evaluation support at 340.
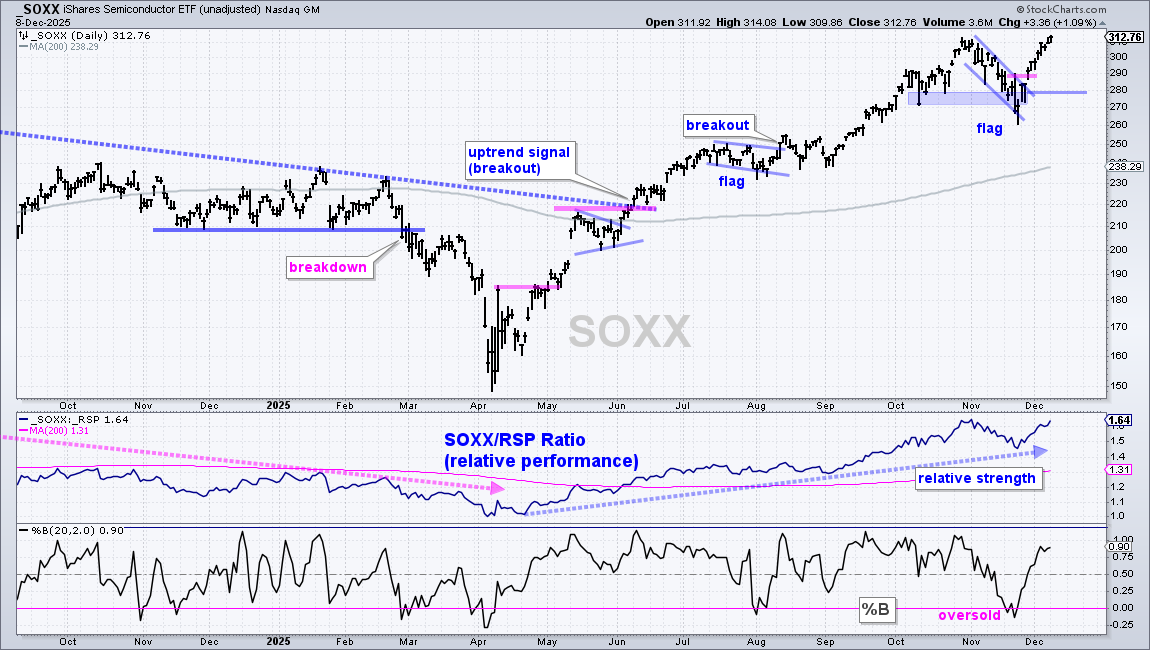
The next chart shows the Semiconductor ETF (SOXX) with a flag breakout and re-evaluation support at 280.
XLV Heading to Oversold Territory
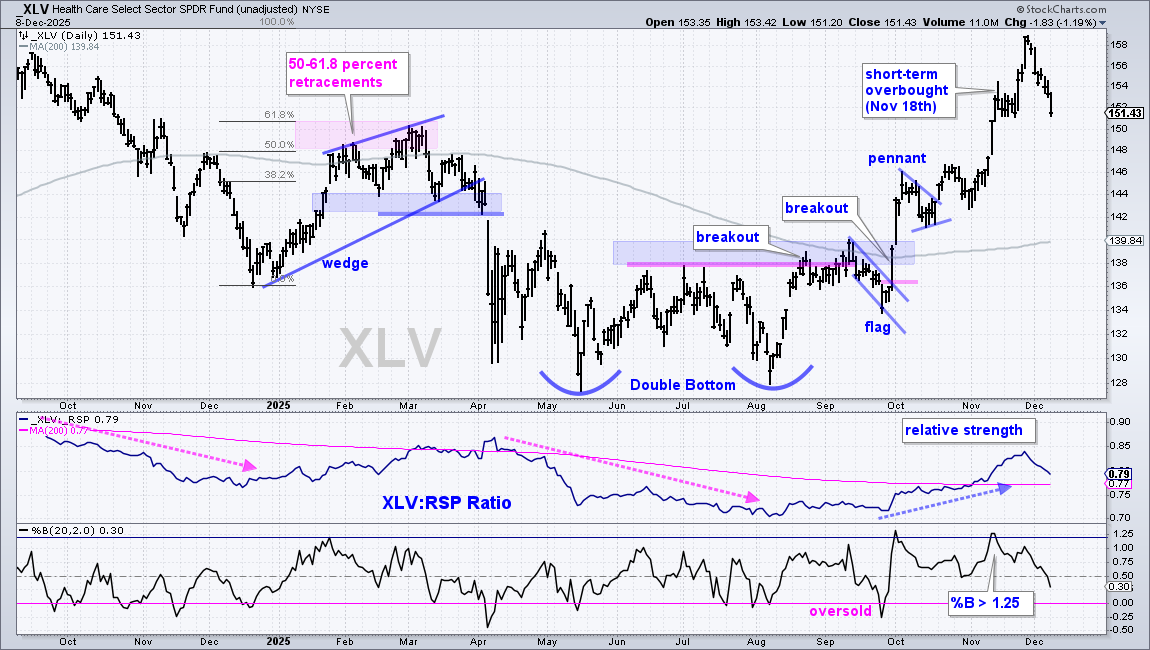
The Healthcare SPDR (XLV) led the market from mid August to late November as it surged from 128 to 158 (20+ percent). I noted that it was overbought on November 18th with %B above 1.2, and XLV became even more overbought, before falling the last eight days. I view this decline as a sharp correction within a leading uptrend. It is a pullback within an uptrend, which presents traders with an opportunity. I do not see a tradable pattern or oversold condition yet. A %B dip below 0 would signal an oversold condition that chartists can use to prepare for a bounce.
XLU Becomes Oversold as Pullback Extends
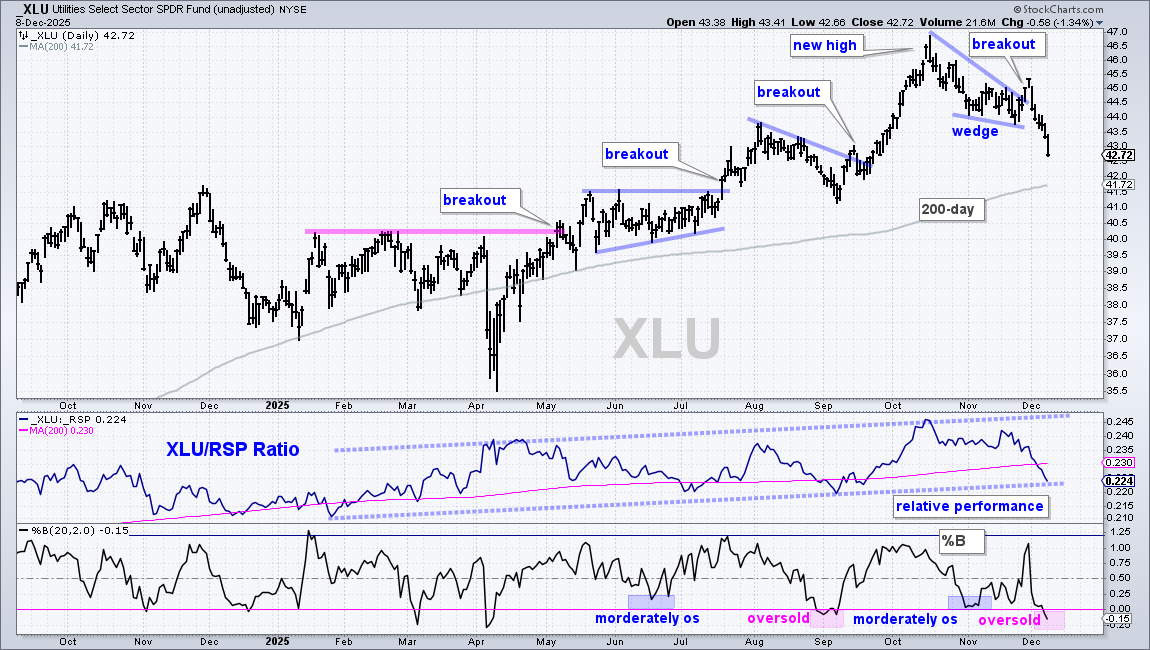
The Utilities SPDR (XLU) provides us with a reminder that short-term setups and breakouts can fail. I featured XLU in late November with a three step process to trading. Look for names with long-term uptrends, relative strength and short-term setups. XLU fit the bill in late November with a falling wedge and moderately oversold condition (%B between 0 and .25). The ETF broke out with a strong move above 45, but this breakout did not hold as XLU plunged below the November low.
Now what? XLU remains in a long-term uptrend with a new high in October and price above the rising 200-day SMA. The price-relative (XLU/RSP ratio) is also in a choppy uptrend since February (blue dashed lines). This indicator crossed below the 200-day SMA in December (pink line), but remains above the September low. This is the moment of truth for the price-relative. %B is short-term oversold with a move below zero. The first setup was based on the pattern. This bullish setup is based on %B becoming truly oversold.
Rates Poised to Break Out
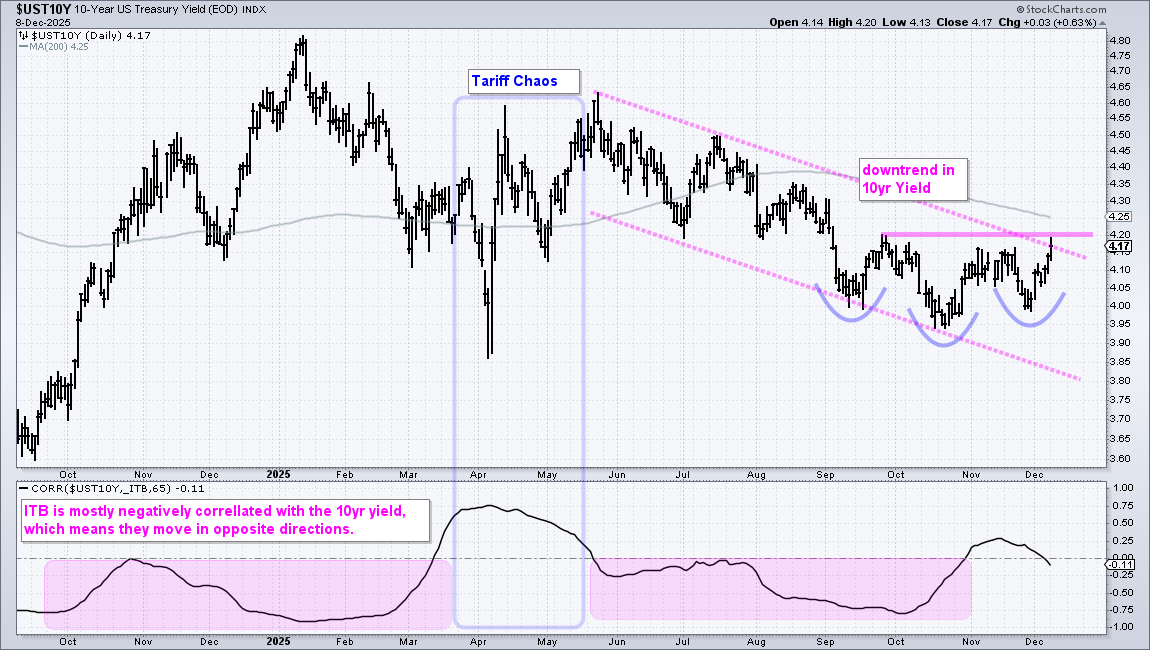
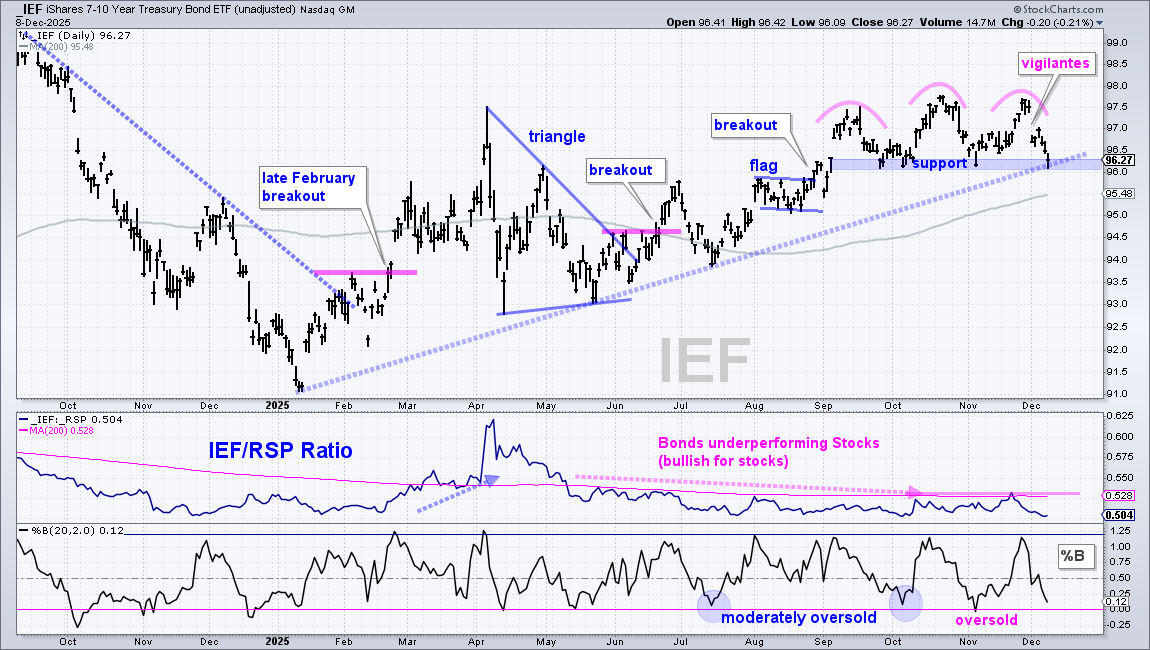
The 10yr T-Yield ($UST10Y) surged back above 4% in December and looks poised to break neckline resistance. The chart below shows the 10yr Yield in a downtrend from June to November. This downtrend slowed in September as the yield formed an inverse head-and-shoulders pattern (blue arcs). The September-November highs mark neckline resistance and a breakout above 4.20% would argue higher rates. This would be negative for rate-sensitive groups, such as housing and small-caps.
The next chart shows the 7-10Yr TBond ETF (IEF) with a mirror image. I noted the appearance of the bond vigilantes last week as IEF plunged below 97 on December 1st. Overall, a head-and-shoulders pattern or topping formation took shape from September to December. IEF is currently testing neckline support at 96. A break here would reverse the uptrend and argue for lower bond prices. Note that the Fed starts its meeting today and makes its policy statement on Wednesday. This could add to the volatility.
ITB and XHB Pull Back after Breakouts
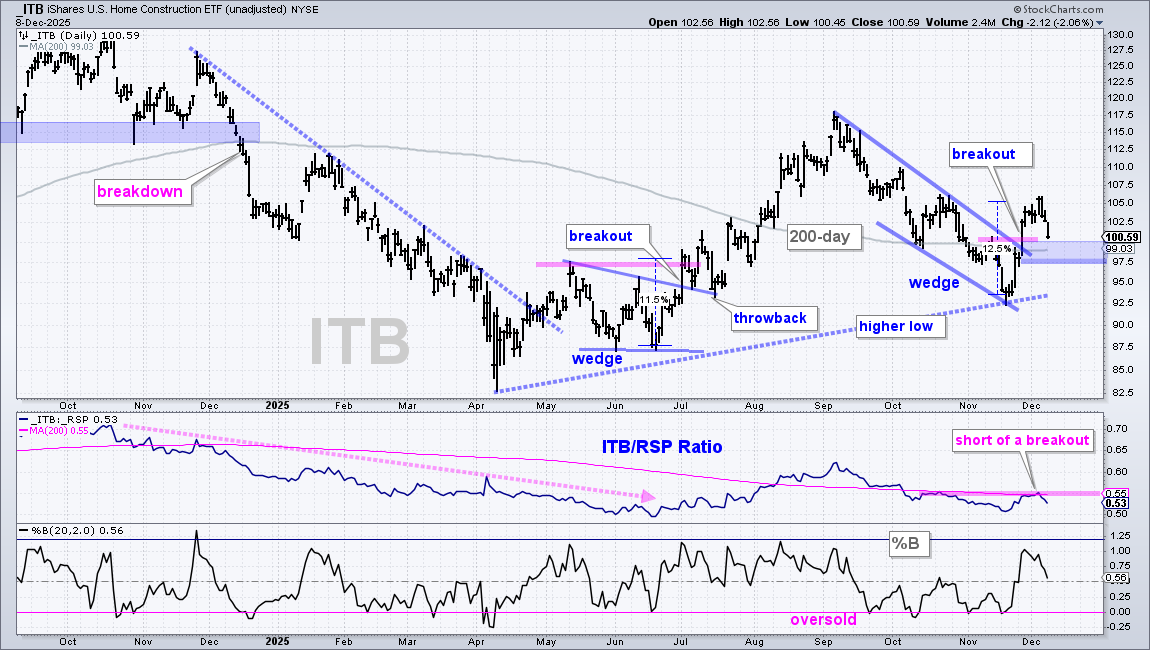
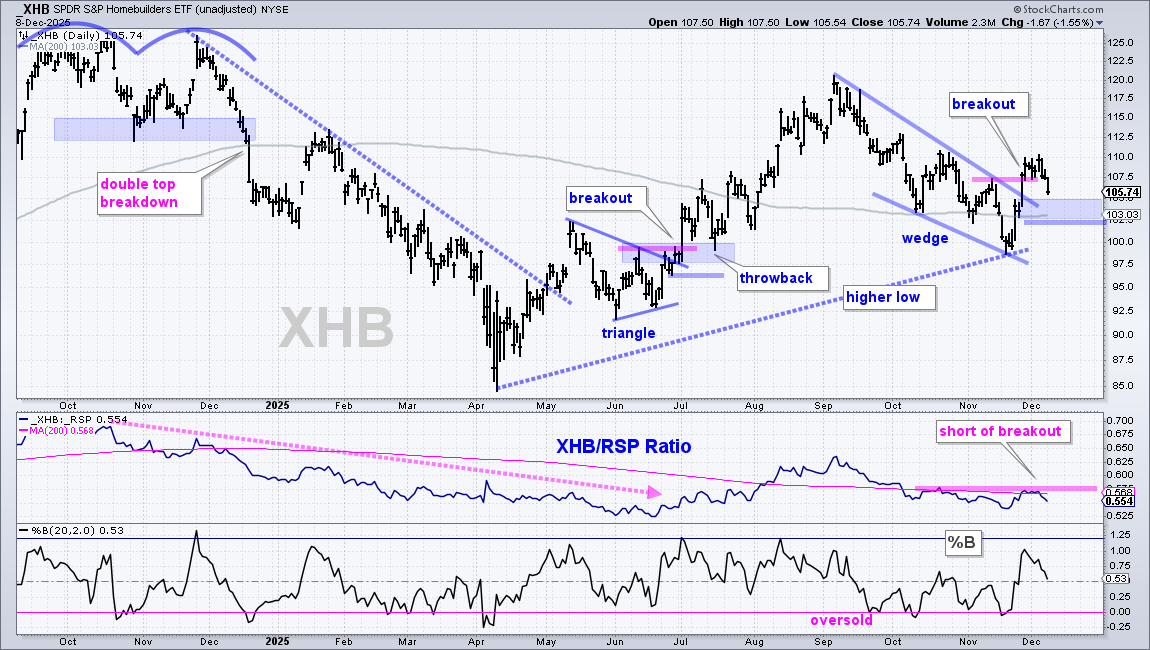
The Home Construction ETF (ITB) and the Homebuilders ETF (XHB) are negatively correlated to the 10yr T-Yield ($TNX). Further strength in the 10yr yield would be negative because ITB and rates move in opposite directions. The first chart shows ITB with a 12.5% surge and breakout in late November. The breakout zone turns first support to watch on the current throwback. Notice how ITB broke out with an 11.5% surge in June and then fell back to the breakout zone in mid July (throwback). The current breakout is bullish as long as the breakout zone holds (blue shading). This means the throwback is near its moment of truth so watch for possible firming in the 99 area. A close below 97 would negate the breakout and put ITB back below its 200-day SMA.
The next chart shows XHB with the blue shading marking the throwback zone (possible support). A close below 102 would negate the breakout and put XHB back below the 200-day SMA.
Mind the Breakouts in XRT and KRE
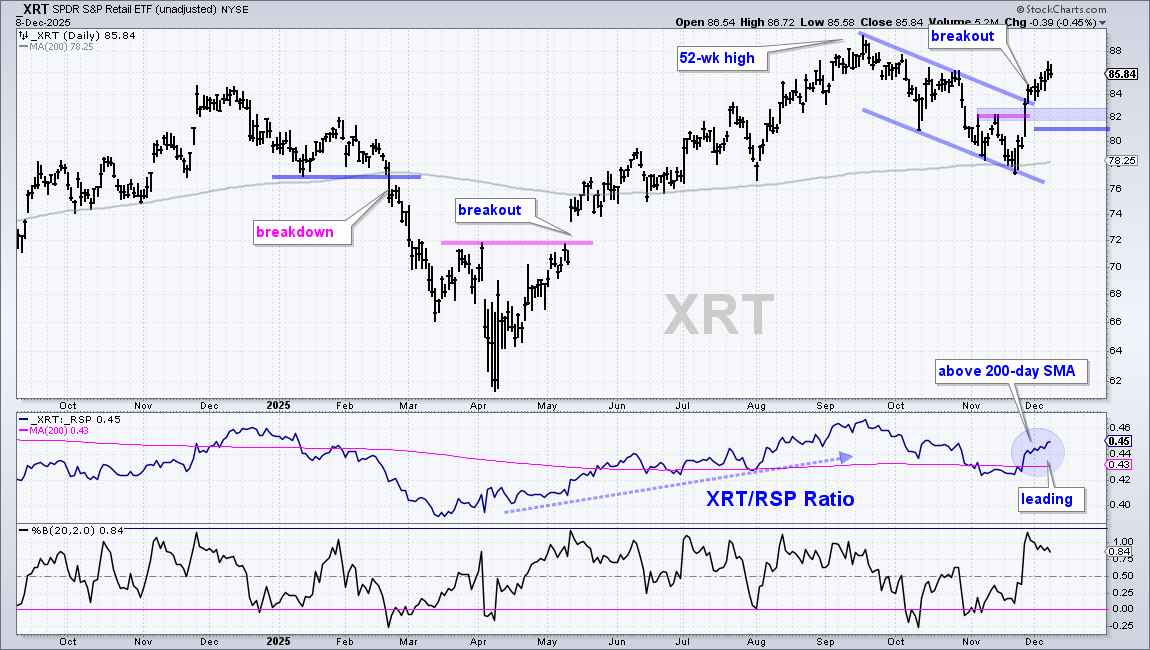
The next chart shows the Retail SPDR (XRT) with a channel breakout in late November and further gains into early December. The blue shading marks the throwback zone to watch for possible support on a pullback (~82). A blue line marks the re-evaluation level at 81. A close below 81 would negate the breakout.
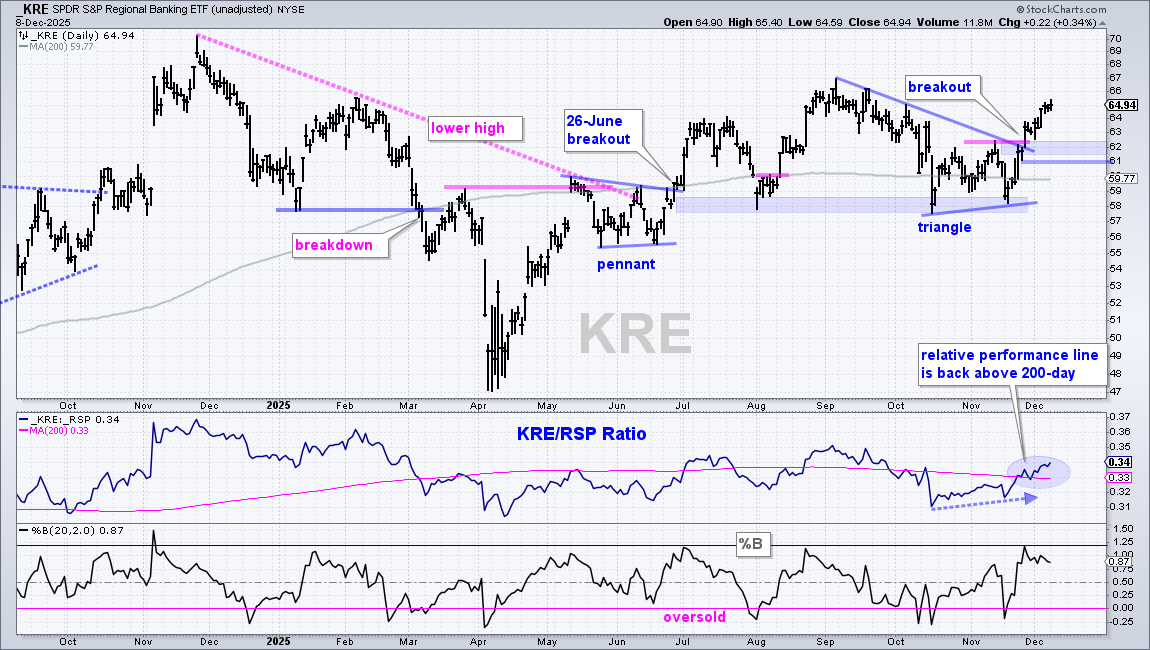
The next chart shows the Regional Bank ETF (KRE) breaking triangle resistance in late November and continuing higher in December. The breakout zone in the 62 area turns first support to watch should KRE fall back (throwback). A close below 61 would negate the breakout.
Aerospace & Defense ETF Sets Up
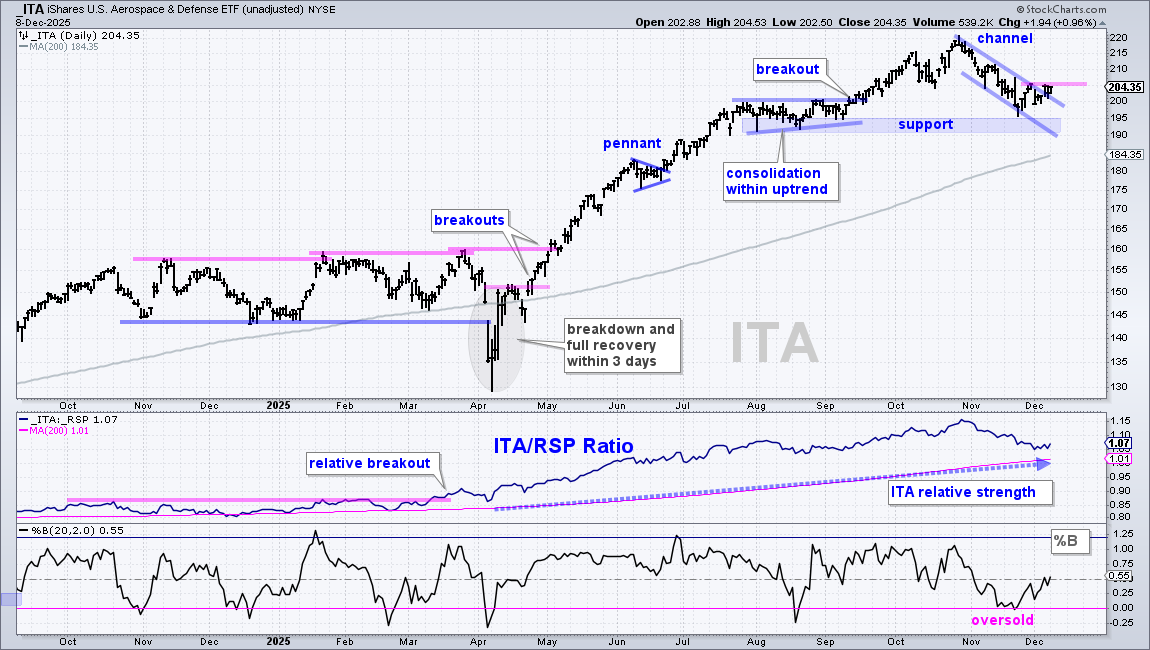
The Aerospace & Defense ETF (ITA) with a classic setup: long-term uptrend, relative strength and short-term oversold. After hitting a new high, ITA corrected with a falling channel, which is typical for a correction within an uptrend. ITA is also just above support from the August lows (blue shading). The lower window shows %B becoming oversold with move below 0. This indicator was last oversold in August. Thus, we have a bullish setup with the corrective pattern, an oversold condition and support. A breakout at 206 would reverse the short-term downswing and argue for a continuation of the long-term uptrend.
Global Clean Energy ETF Stalls after Flag Breakout
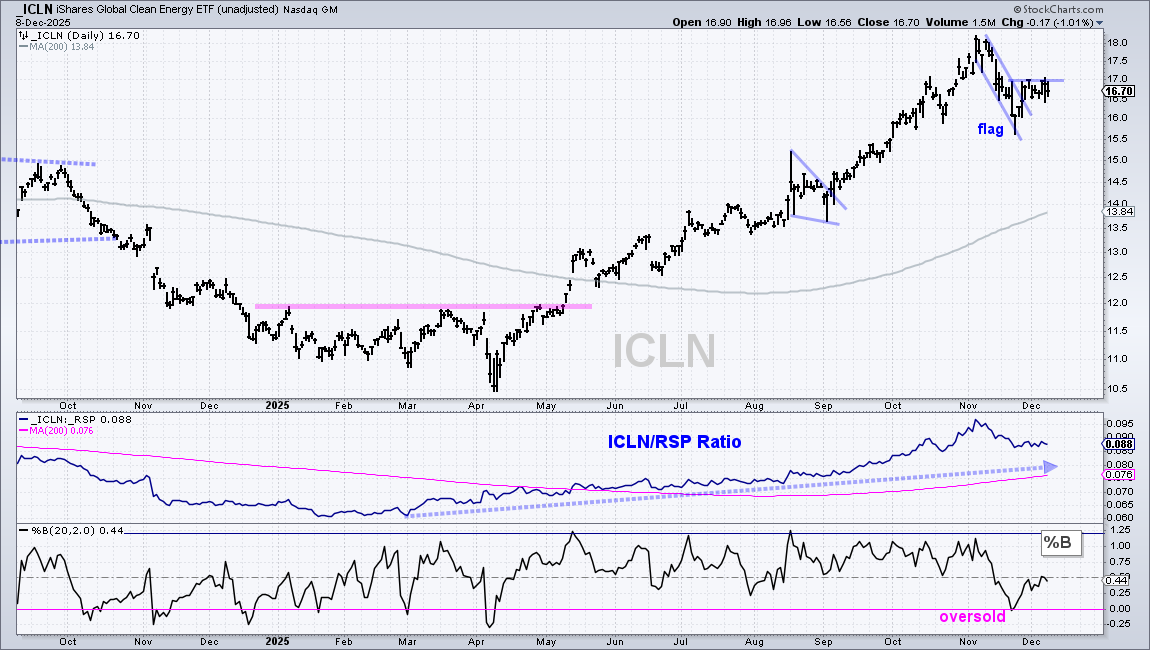
The Global Clean Energy ETF (ICLN) is in a long-term uptrend with a new high in early November and price well above the rising 200-day SMA. ICLN also shows relative strength with the price-relative (ICLN/RSP ratio) above its 200-day SMA. Short-term, %B dipped below zero to become oversold in late November and a falling flag formed on the price chart. ICLN broke the flag line with a surge in late November and then stalled into December with short-term resistance at 17. A breakout here would revive the flag breakout and argue for a move to new highs.
DISCLAIMER: This content provided strictly for informational and educational purposes. It should not be interpreted as an offer to buy or sell any security, nor as a solicitation to engage in any investment activity. Nothing here constitutes a recommendation regarding any specific security, portfolio, transaction, or investment strategy.
At times, the author or affiliates may hold positions or interests in securities discussed. Any stocks or examples mentioned are not endorsements or suggestions to purchase. This material does not consider your individual financial goals or circumstances, and you should seek guidance from a qualified financial or investment adviser before making any trading or investment decisions.
Past performance does not guarantee future results.
Send feedback to support(at)trendinvestorpro.com or use the contact form.