The next report will be the Chart Fix (December 4th).
The next Premium report/video will be on Tuesday, December 9th.
Precious Metals Lead as Bitcoin Lags
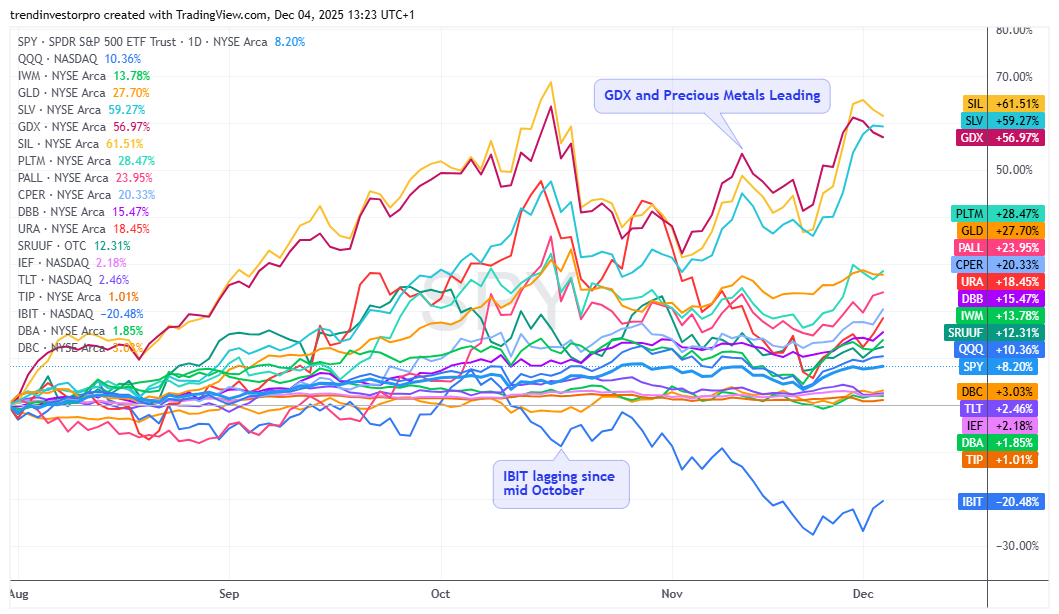
Today’s report covers Gold, Silver, Gold/Silver Miners, Copper, Based Metals, Uranium, Bonds, Bitcoin and the Aerospace & Defense ETF, which has a bullish setup working. The chart below shows the precious metals complex leading since August. In fact, all ETFs on this chart are up since August, except one. The Bitcoin ETF is the lone loser and the clear laggard since October. Even the lowly bond ETFs, IEF and TLT, are up.
In addition to StockCharts, I use TradingView charts to analyze three different timeframes, create comparison charts and access a wide array of indicators.
Gold and Silver Extend on Breakouts
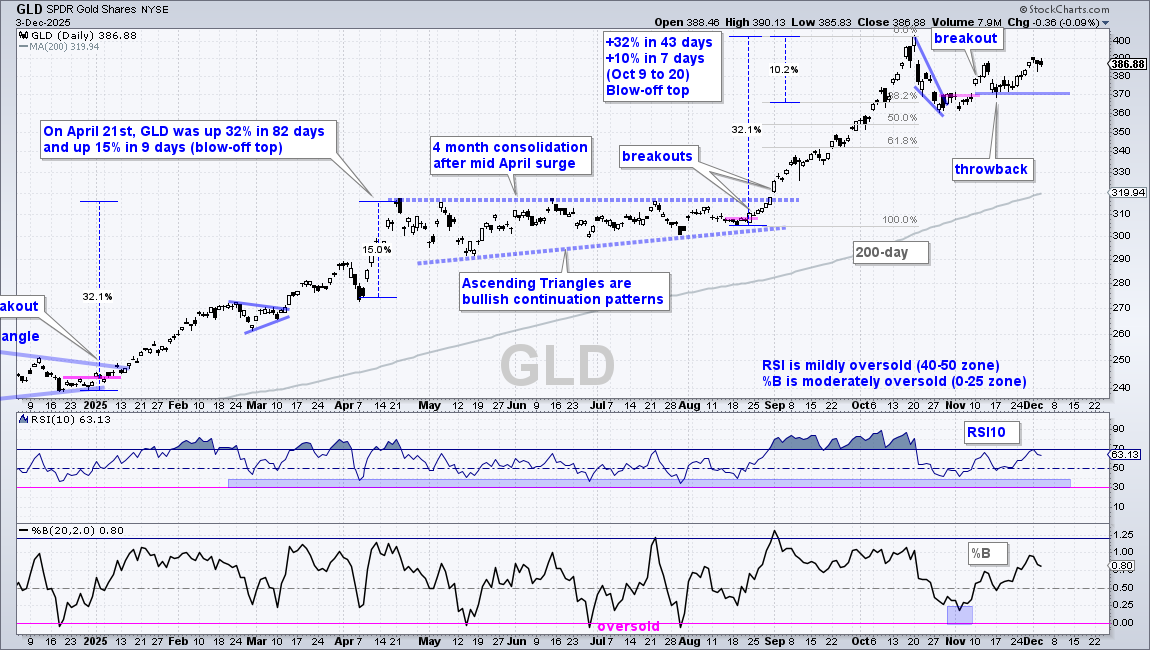
The Gold SPDR (GLD) remains in a leading uptrend with a new high in October and price well above the rising 200-day SMA. Short-term, GLD corrected with a sharp falling wedge into late October and broke out with a surge to 380. Notice the short throwback to the breakout zone in mid November (370). This throwback provided a second chance to partake in the breakout. At this stage, I do not see a setup on this chart, just a strong uptrend and valid short-term breakout. 370 is the first support level to watch for a failed breakout. A close below this level would lead to a deeper correction within the strong uptrend. The next target would be the 61.8% retracement zone in the 340 area.
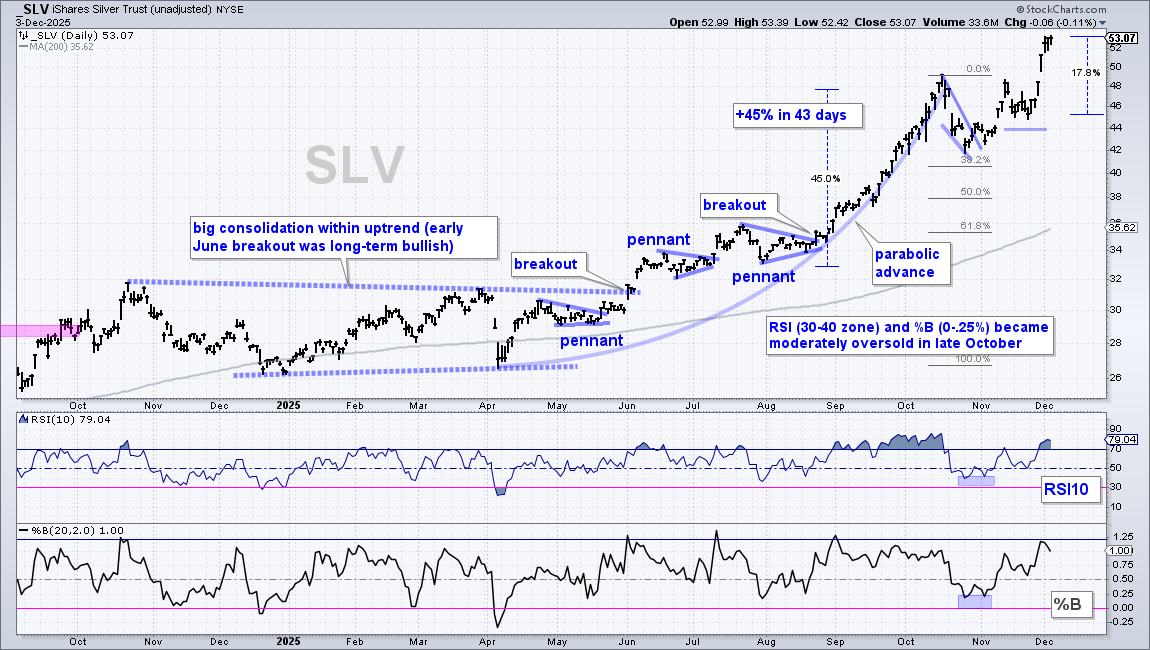
The Silver ETF (SLV) left gold in the dust with a double digit surge to new highs. SLV had the same setup with the falling wedge breakout in late October. After a short pullback in mid November, the ETF surged from 45 to 53 (+18% in seven days!). SLV is short-term overbought, but also in a leading uptrend with a fresh new high. There is no setup on the chart right now.
Gold Miners Follow Gold, But Silver Miners Lag
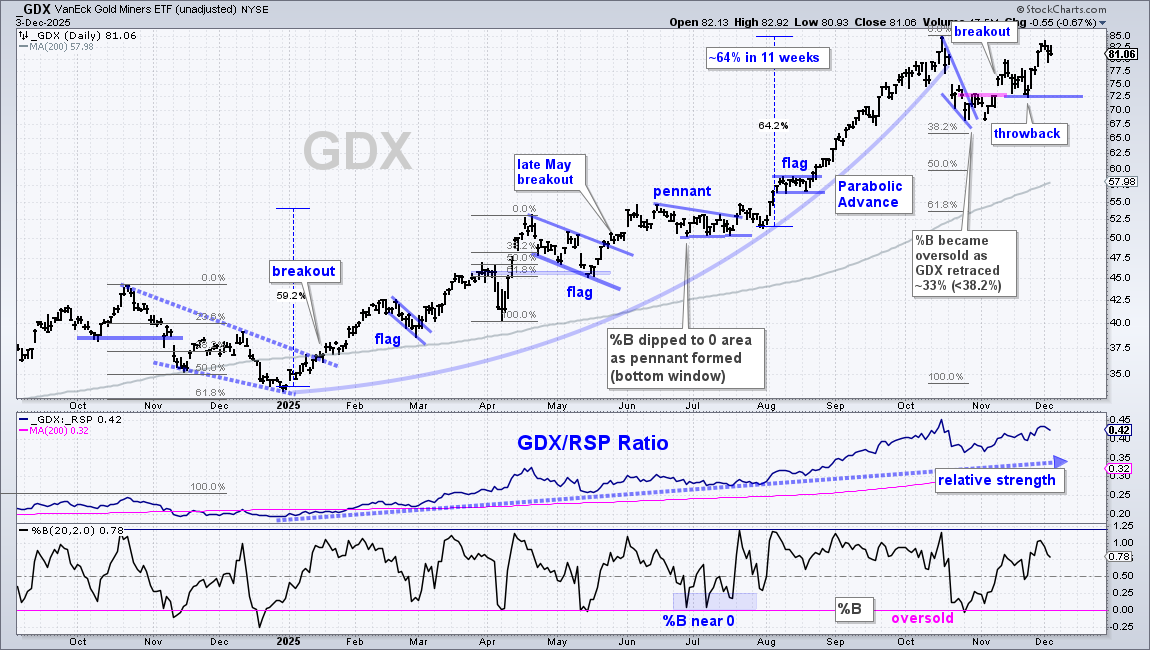
Unsurprisingly, the Gold Miners ETF (GDX) is channeling gold with a wedge breakout in early November, a throwback to the breakout zone and a surge above 80. Keep throwbacks in mind for future trading setups. There is a strong breakout and then a throwback to the breakout zone, which turns first support. This offers a second chance to partake in the breakout, and at the breakout price. Returning to the chart, first support is set at 72.50, a break of which would argue for a deeper correction within the leading uptrend.
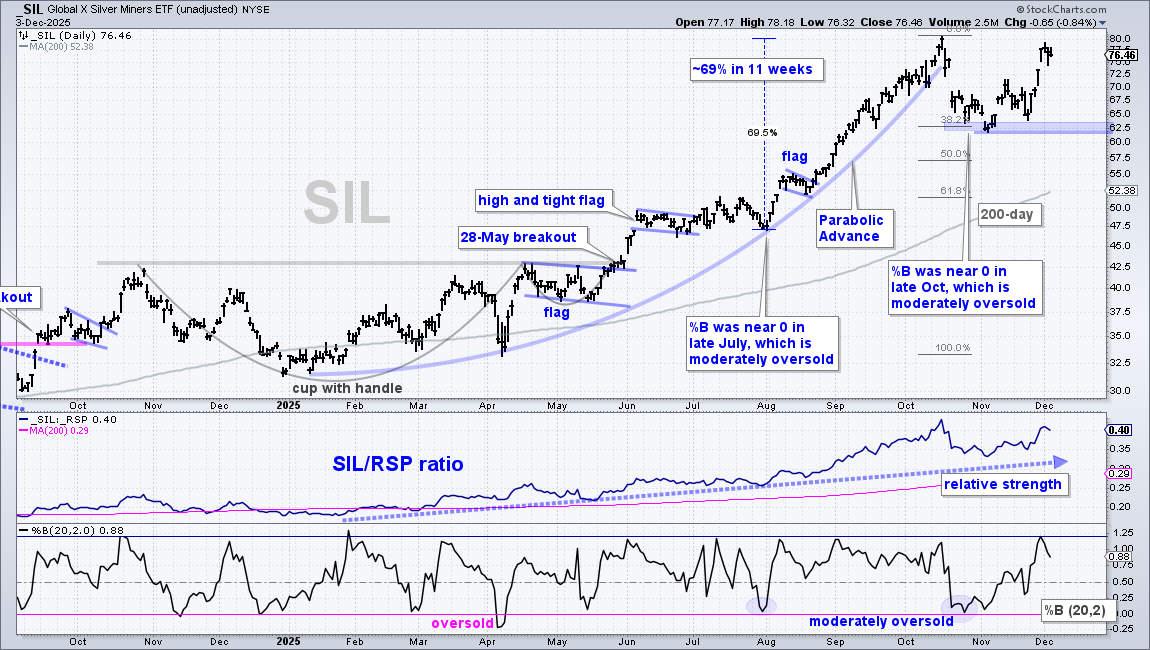
The Silver Miners ETF (SIL) is trading more erratically than GDX, and also lagging the Silver ETF, which hit a new high. SIL remains in an uptrend with price near the October high and well above the rising 200-day SMA. The October-November lows mark a support zone in the 62.50 area. A break here would forge a lower low and argue for a test of the rising 200-day SMA.
Copper Breaks October High as DBB Hits New High
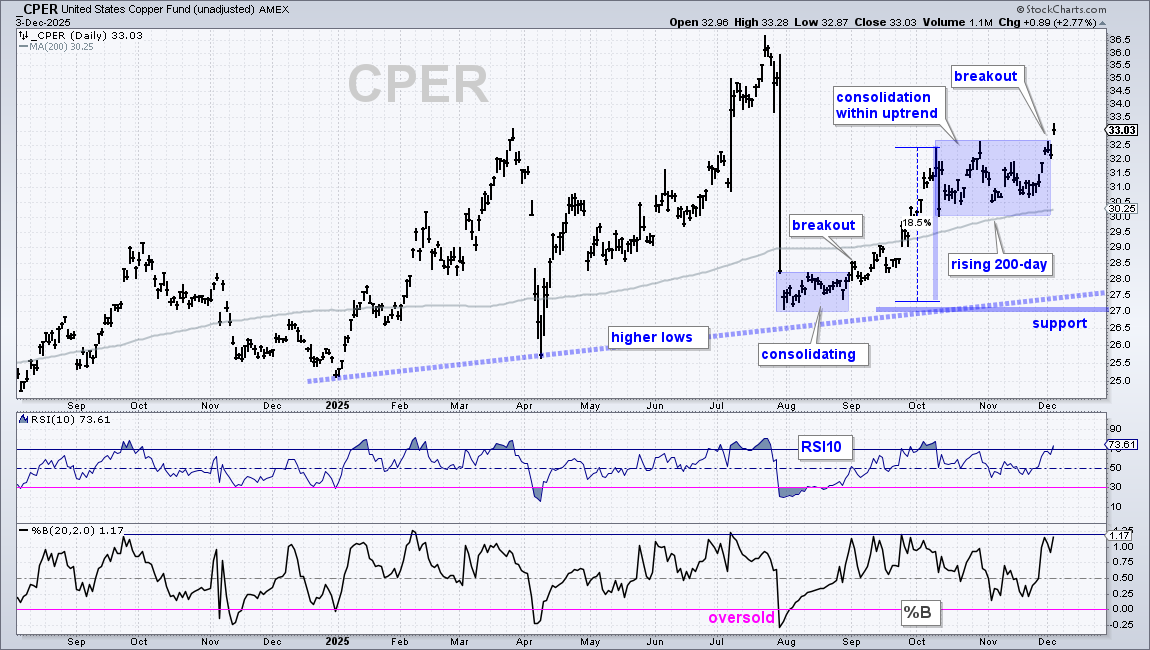
The Copper ETF (CPER) remains in a long-term uptrend with higher highs and higher lows since early 2025. CPER is also above the rising 200-day SMA. The ETF advanced from 27 to 32.5 (+18.5%) and then consolidated with a trading range into November. A consolidation after an advance is a bullish continuation pattern. It is the pause that refreshes and sets the stage for the next move. CPER broke out with a surge on Wednesday. Note that copper is a pretty volatile commodity, which means CPER could fall back into the consolidation zone (blue shading) and still be in an uptrend. While I am tempted to mark long-term support at 30, I will refrain for now and leave long-term support at 27.
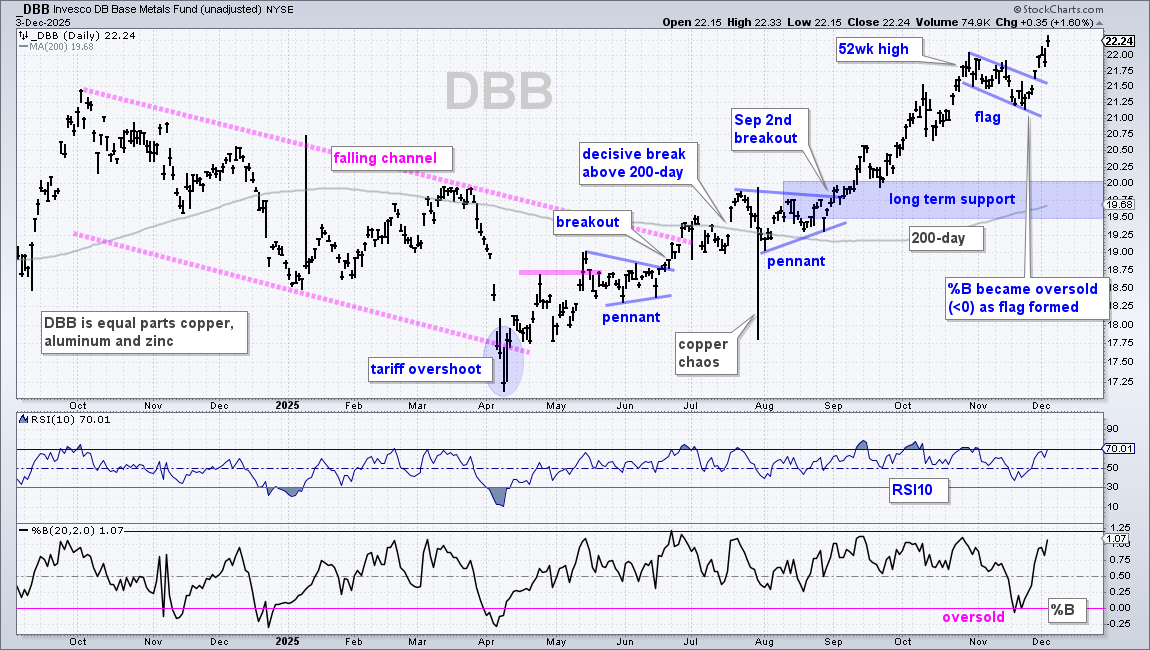
The DB Base Metals ETF (DBB) surged to new highs in October, corrected with a falling flag into November and broke out last week. Also notice that %B became oversold on November 18th. This is a classic combination for trading pullbacks within uptrends (bull flag and oversold condition). DBB extended its flag breakout and hit new highs this week. There is no setup now, just a leading uptrend.
Uranium Holds Support as Bullish Pattern Forms
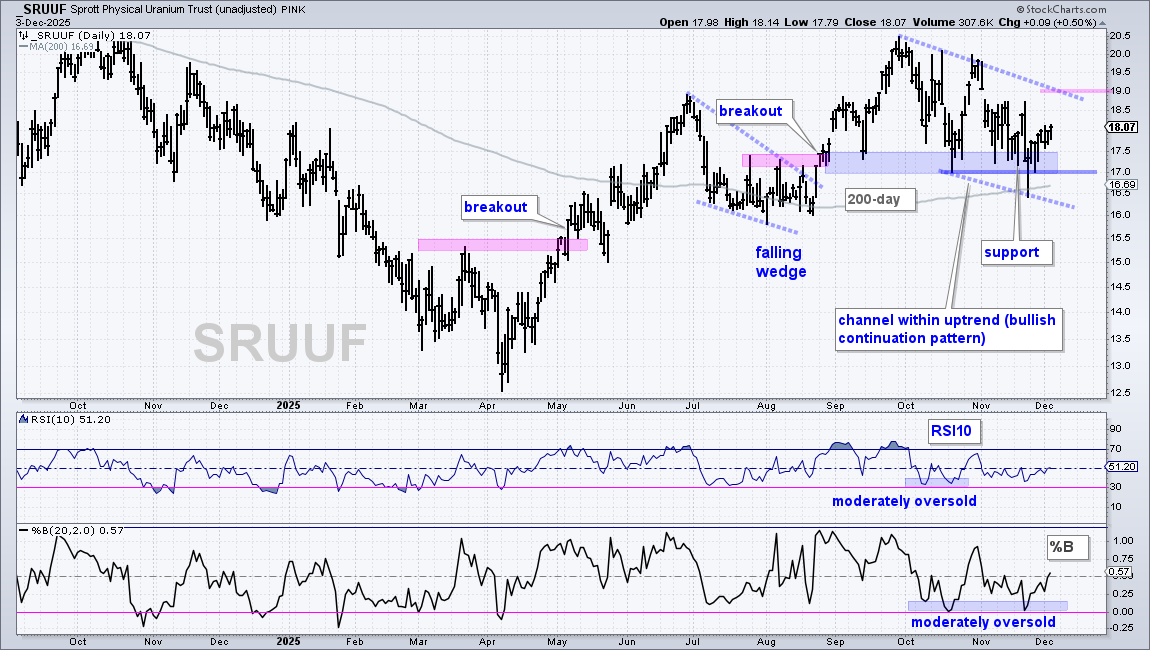
The Sprott Physical Uranium (SRUUF) remains within a choppy correction since October. The long-term trend is up with price above the rising 200-day SMA. After surging from late August to late October, the ETF corrected with a decline back to the 17-17.50 area. The breakout zone (pink shading) turned into support, which held the last three months (blue shading). The blue dashed lines define the falling channel correction and a breakout at 19 would be bullish.
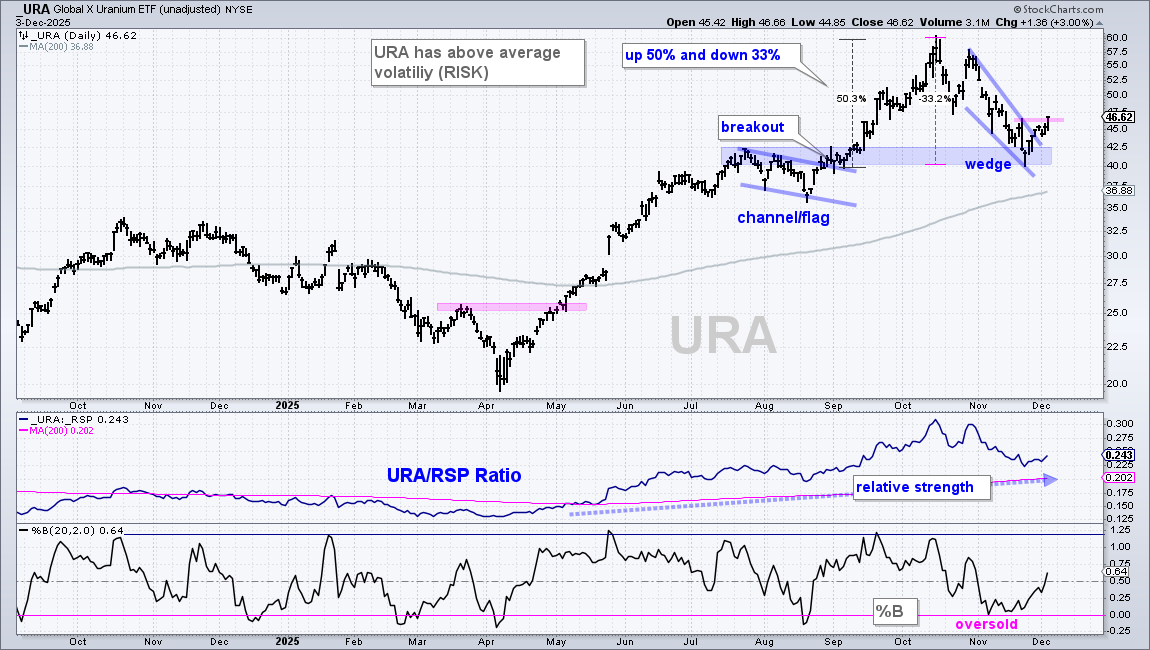
The next chart shows the Uranium ETF (URA), which includes Oklo (OKLO). OKLO advanced 180% from early September to mid October, and then fell 55% into late November. Welcome to the rodeo. During this period, URA surged 50% and then fell 33%.
URA remains in a long-term uptrend with a new high in October and price well above the rising 200-day SMA. The November correction was deep, but URA managed to find support from prior resistance and the channel breakout (blue shading). Also notice that %B became oversold with a dip to 0 in early November. A falling wedge formed with the November 20th high marking short-term resistance. Thus, we have a bullish setup: oversold, falling wedge and return to prior breakouts (support). URA broke out with a surge the last seven days. There are two levels to consider for re-evaluation. First, a close below 42.5 would erase the Thanksgiving week surge. Second, a close below 40 would break the November low, which is some 17% below current prices.
Bond Vigilantes Target IEF
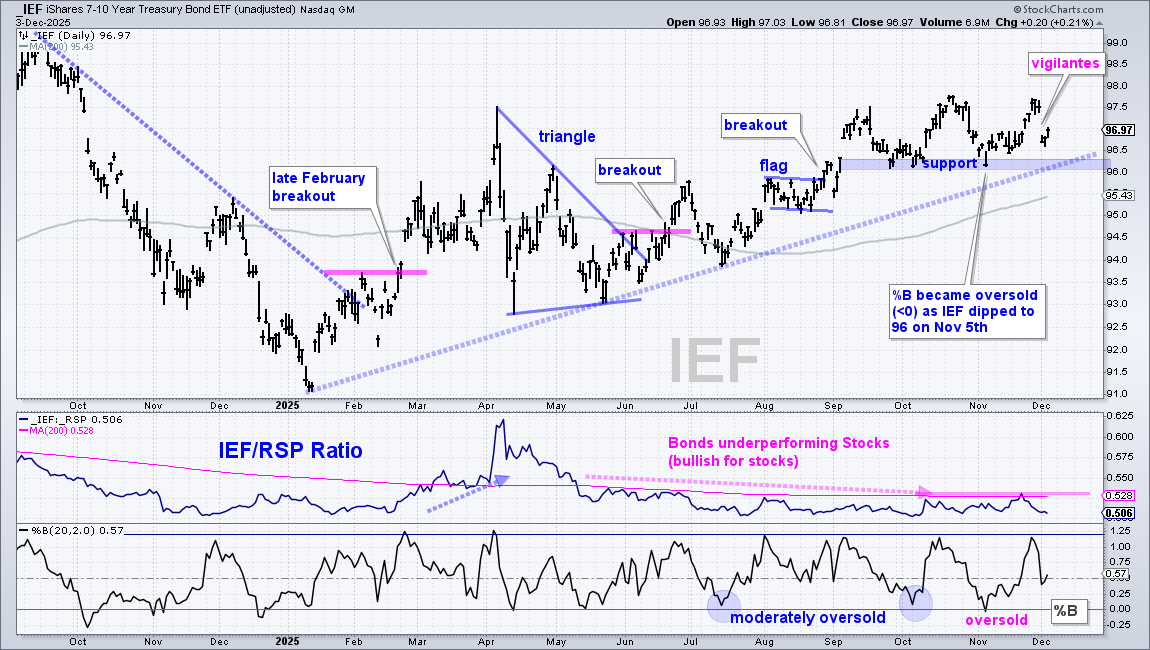
The bond vigilantes became active on Monday as the 7-10Yr TBond ETF (IEF) fell .83%, its largest one day decline since early April. I suspect this is a reaction to the prospect of Kevin Hassett leading the Fed. Hasset’s odds surged from 55 to 76 percent on Monday, IEF fell .83% and the 10yr T-Yield surged to 4.10%, which was covered on Tuesday.
I am watching IEF closely because a breakdown would reverse the uptrend and also signal an upside breakout in the 10yr T-Yield. IEF defended the 96-96.5 area at least three times with bounces since late September (blue shading). A close below 96 would signal an uptick in selling pressure and push IEF to a three month low. For now, IEF remains in an uptrend, despite Monday’s plunge. A break below 96 would reverse this uptrend and could derail the recent moves in rate sensitive groups (Regional Banks, Housing, Retail, Small-caps).
IBIT Gets Oversold Bounce within Downtrend
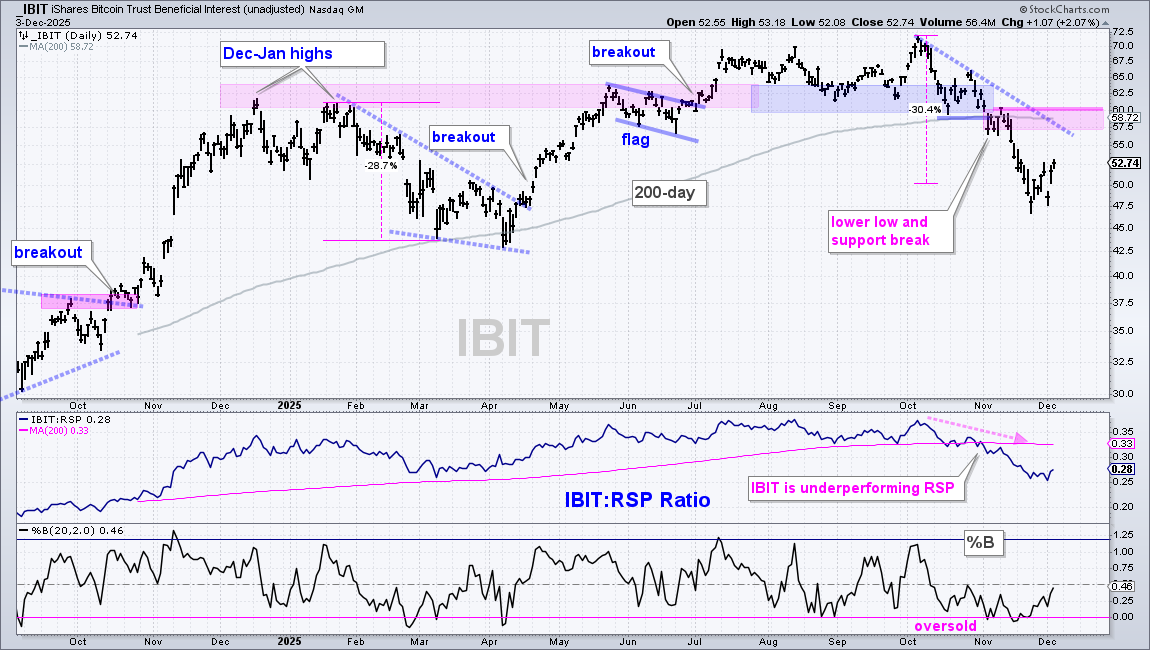
The Bitcoin ETF (IBIT) broke down on November 4th, plunged below 50 in late November and bounced back above 50 here in December. At this point, the long-term trend is down: clear support break and price below falling 200-day SMA. The broken support zone turns first resistance in the 57-60 area (pink shading). IBIT became oversold after the plunge to 47.5, which means an oversold bounce is possible. With the long-term trend down, I am not interested in short-term oversold conditions because the long-term downtrend is a headwind. For trading setups, I would be looking for short-term overbought conditions and bearish continuation patterns, such as rising flags or wedges.
Aerospace & Defense ETF Becomes Oversold
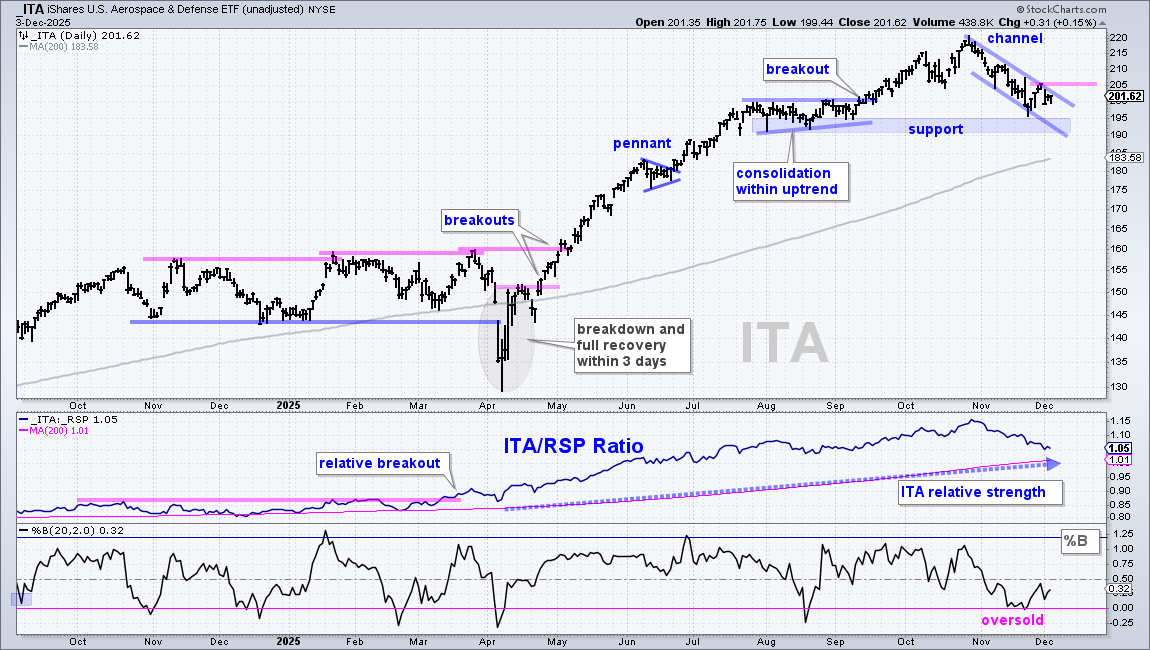
The Aerospace & Defense ETF (ITA) led the market from April to October with a massive advance. ITA then corrected in November with a decline back to the August consolidation. I see a falling channel, which is typical for a correction within an uptrend. ITA is also just above support from the August lows (blue shading). The lower window shows %B becoming oversold with move below 0. This indicator was last oversold in August. Thus, we have a bullish setup with the corrective pattern, an oversold condition and support. A breakout at 206 would reverse the short-term downswing and argue for a continuation of the long-term uptrend.
DISCLAIMER: This content provided strictly for informational and educational purposes. It should not be interpreted as an offer to buy or sell any security, nor as a solicitation to engage in any investment activity. Nothing here constitutes a recommendation regarding any specific security, portfolio, transaction, or investment strategy.
At times, the author or affiliates may hold positions or interests in securities discussed. Any stocks or examples mentioned are not endorsements or suggestions to purchase. This material does not consider your individual financial goals or circumstances, and you should seek guidance from a qualified financial or investment adviser before making any trading or investment decisions.
Past performance does not guarantee future results.
Send feedback to support(at)trendinvestorpro.com or use the contact form.