

Headlines
- Autodesk Forms Higher Low with Strong Breakout
- A Leading Uptrend for Quanta Services
- Freeport McMoran: The Setup within Setup
- Norfolk Southern Extends on Channel Breakout
- CSX Breaks Channel Line with Strong Move
I will update the Market Regime page later today.
Previous Reports Covering Stock Trends, Setups and Breakouts
November 19th: Gen Digital (GEN), Qualcomm (QCOM) and Unity Software (U)
November 12th: Nucor (NUE), Danaher (DHR), Pfizer (PFE), Northrop Grumman (NOC), Norfolk Southern (NSC), AES Corp (AES)
November 5th: Consumer Staples SPDR (XLP), Costco (COST), CSX Corp (CSX), Heico (HEI), Entergy (ETR), Excel Energy (XEL)
October 29th: Cadence Design (CDNS), Tesla (TSLA), Burlington (BURL), Newmont Mining (NEM), Freeport McMoran (FCX)
October 22nd: CrowdStrike (CRWD), Palo Alto Networks (PALO), StandardAero (SARO), Veeva System (VEEV), Home Construction ETF (ITB), Homebuilders ETF (XHB) , Home Depot (HD)
Autodesk Forms Higher Low with Strong Breakout
Autodesk (ADSK) provides software and services for product development and manufacturing to the industrials sector. It has been a choppy ride since July, but the overall uptrend remains intact, and a recent breakout argues for new highs in the coming weeks/months.
I did not draw it on the chart, but there is a massive inverse head-and-shoulders pattern extending back to November 2024. The right side of the pattern, which is the most important side, shows a surge from early April to early July and a choppy range since the sharp decline in early July. There is, however, a slight rise to this range with higher highs and higher lows. Thus, the long-term trend is up since the early May breakout.
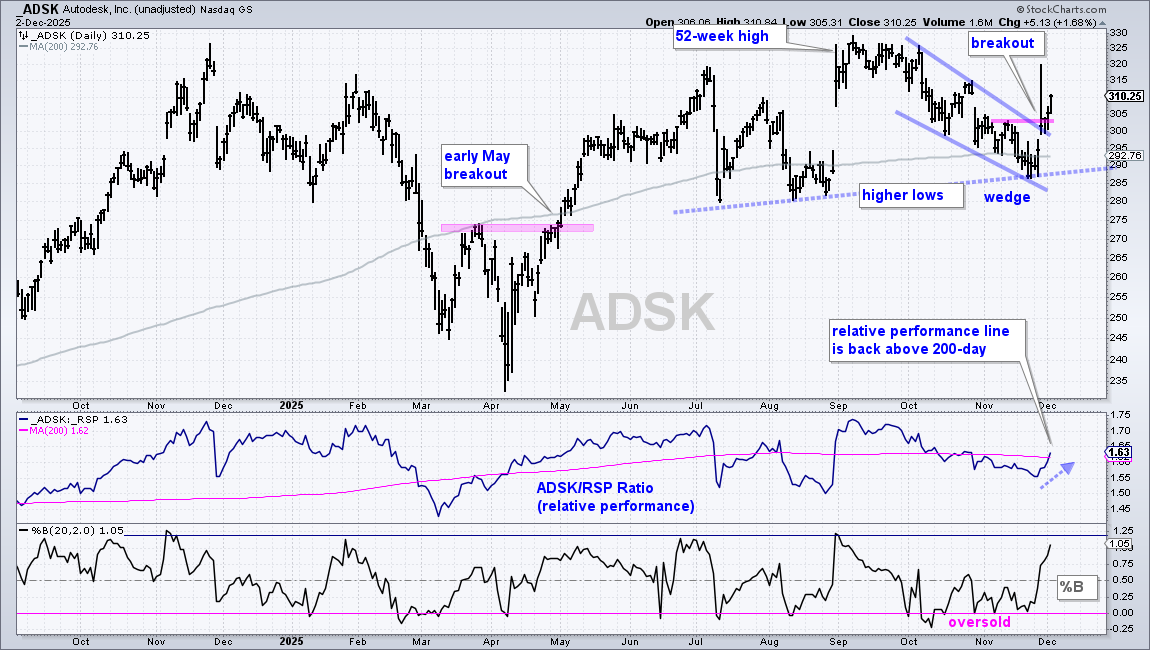
Short-term, ADSK surged in late August with a positive earnings report. The stock then fell back to the 290 area in November. This correction was much deeper than normal, but ADSK managed to hold just above the August lows as a falling wedge formed. The stock broke out with a strong surge the last five days. This breakout reverses the short-term downtrend and signals a continuation of the long-term uptrend. A close below 285 would call for a re-evaluation.
A Leading Uptrend for Quanta Services
Quanta Services (PWR) provides infrastructure products and services to the energy, communications and utilities sectors. It is part of the energy grid trade.
Long-term, the stock is in a leading uptrend with a new intraday high in October and a new closing high in November. Price is well above the rising 200-day SMA. Relative performance is also strong with the price-relative (PWR/RSP ratio) hitting new highs in November and trading well above its rising 200-day SMA. PWR is in a leading uptrend.
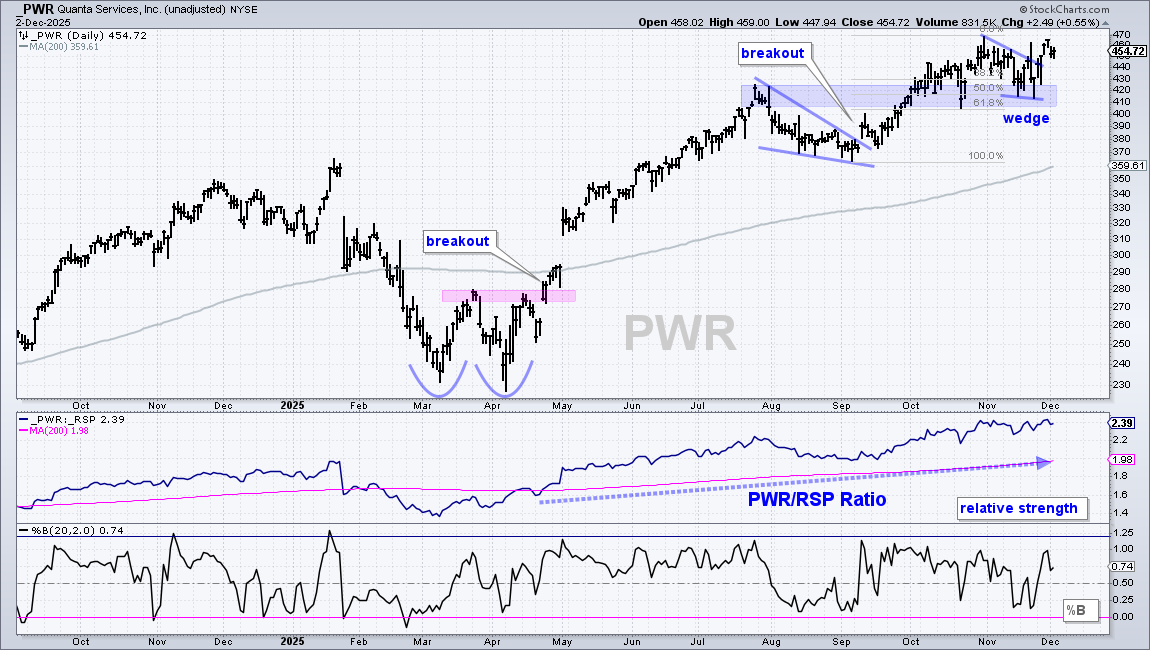
Short-term, the stock consolidated in November with a wedge that retraced around 50% of the September-October surge. The blue shading marks support from broken resistance and the mid October low. Overall, the 410-420 area is a Bullish Setup Zone, which is an area to watch for a reversal. PWR broke out with a surge in late November. A close below 410 would call for a re-evaluation.
Freeport McMoran: The Setup within a Setup
Freeport McMoran (FCX) was featured on October 29th and remains with a similar setup. Freeport McMoran mines metals, including copper and gold. The stock plunged 17% on September 26th on news of a fatal accident at its Indonesian copper and gold mine. Mine production is expected to be 35% lower in 2026, this news is priced-in and could be offset by higher metals prices.
The price chart is constructive with a correction within a correction setup emerging. First, the stock surged from early April to early July, breaking the March high and exceeding the 200-day SMA in the process. FCX then corrected with a decline that retraced around 61.8% (September low). I view the July-November decline as a big correction after the June breakout. A falling channel formed and a breakout at 45 would be long-term bullish.
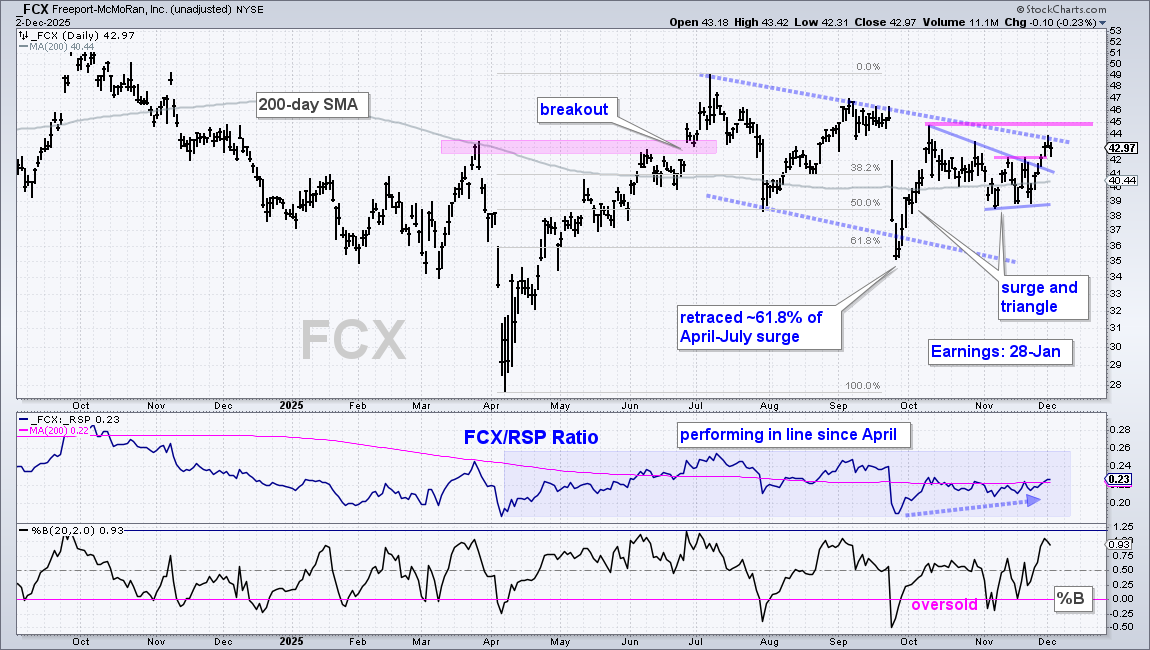
Short-term, the stock recovered after the September plunge with a surge from 35 to 45. FCX then corrected with a triangle into October, which I view as a short-term bullish continuation pattern. It is a correction after the recovery surge. FCX broke the triangle line and mid November highs with a surge above 42 last week. This breakout signals a continuation higher and increases the odds for a bigger breakout at 45. A close below 38.5 would call for a re-evaluation.
Norfolk Southern Extends on Channel Breakout
Norfolk Southern (NSC) was featured on November 12th and recently broke its mid November high. Names that held above their October lows in November and broke their mid November highs show relative strength. NSC, a railroad stock, is one such name.
First and foremost, the long-term trend is up with 52-week highs in July, August and September. Second, the stock shows relative strength because the price-relative (NSC/RSP ratio) is above its 200-day and trending higher (middle window). Names in leading uptrends should be on our watchlist for tradable setups.
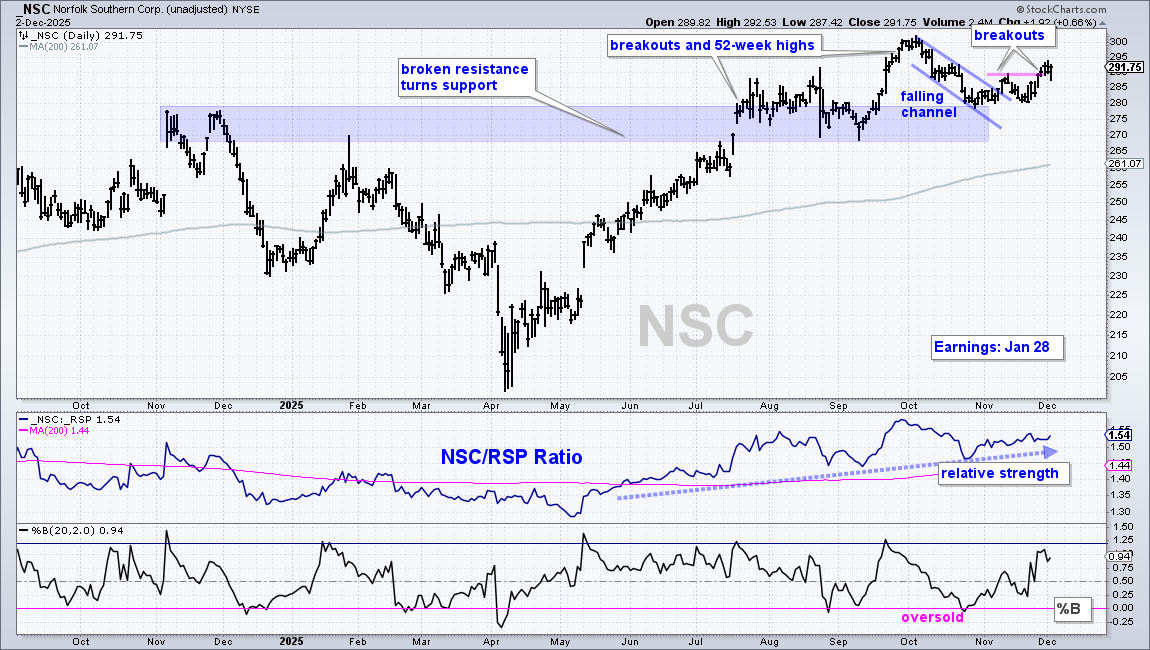
Most recently, NSC surged from 270 to 300 in September and then corrected with a falling channel into late October. The stock broke the channel line in early November, fell back to 280 in mid November and broke the mid November high with the surge above 290. These breakouts signal an end to the correction and a resumption of the bigger uptrend. A close below 275 would warrant a re-evaluation.
CSX Breaks Channel Line with Strong Move
CSX Corp (CSX) is another railroad stock and it was featured on November 5th with a falling flag. This pullback extended to November 20th and became a channel because the decline is too long to be considered a flag. Regardless of the name, I view this as a correction after the September-October advance because it retraced around 61.8% of the advance. More importantly, CSX broke the channel line with a strong three day surge in late November. This breakout reverses the slide and signals a continuation of the September-October advance. A close below 33.5 would call for a re-evaluation.
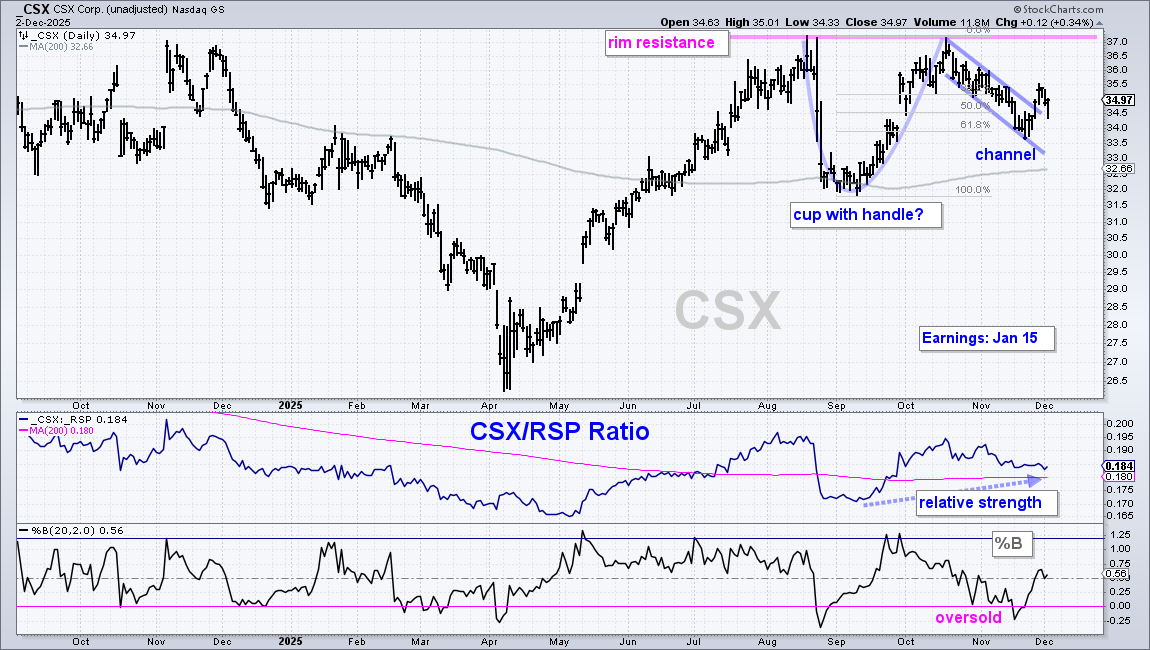
Long-term, a cup-with-handle pattern is possible and a break above rim resistance would confirm the pattern. With a channel breakout working, the odds favor a challenge to rim resistance. Cup-with-handles are bullish continuation patterns that form within an uptrend. This pattern is a consolidation after the surge from 26.5 to 37 (April to August). A break above rim resistance would signal a continuation higher.
DISCLAIMER: This content provided strictly for informational and educational purposes. It should not be interpreted as an offer to buy or sell any security, nor as a solicitation to engage in any investment activity. Nothing here constitutes a recommendation regarding any specific security, portfolio, transaction, or investment strategy.
At times, the author or affiliates may hold positions or interests in securities discussed. Any stocks or examples mentioned are not endorsements or suggestions to purchase. This material does not consider your individual financial goals or circumstances, and you should seek guidance from a qualified financial or investment adviser before making any trading or investment decisions.
Past performance does not guarantee future results.
Send feedback to support(at)trendinvestorpro.com or use the contact form.