The next report will be the Friday Chart Fix (November 7th).
The next Premium report/video will be on Tuesday, November 11th.
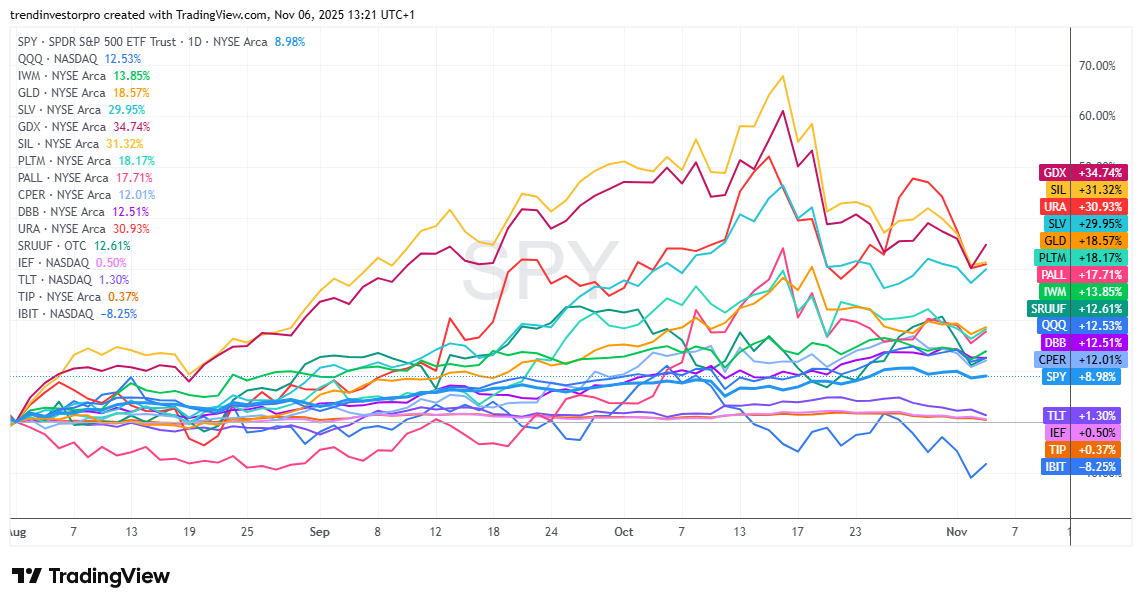
There are some interesting developments in the alternative ETF universe. Gold, silver and their respective miners corrected within leading uptrends. This means they are setting up bullish. Bonds got clobbered the last six days, but TLT is also setting up bullish as it tests the prior breakout. The Bitcoin ETF hit a six month low to become negatively correlated with QQQ for the first time since July 2024. Is this an omen for QQQ? For reference, the chart below shows three month performance with IBIT bringing up the rear (-8.25%) and GDX (+34.74%) still leading.
Gold and Silver Correct within Strong Uptrends
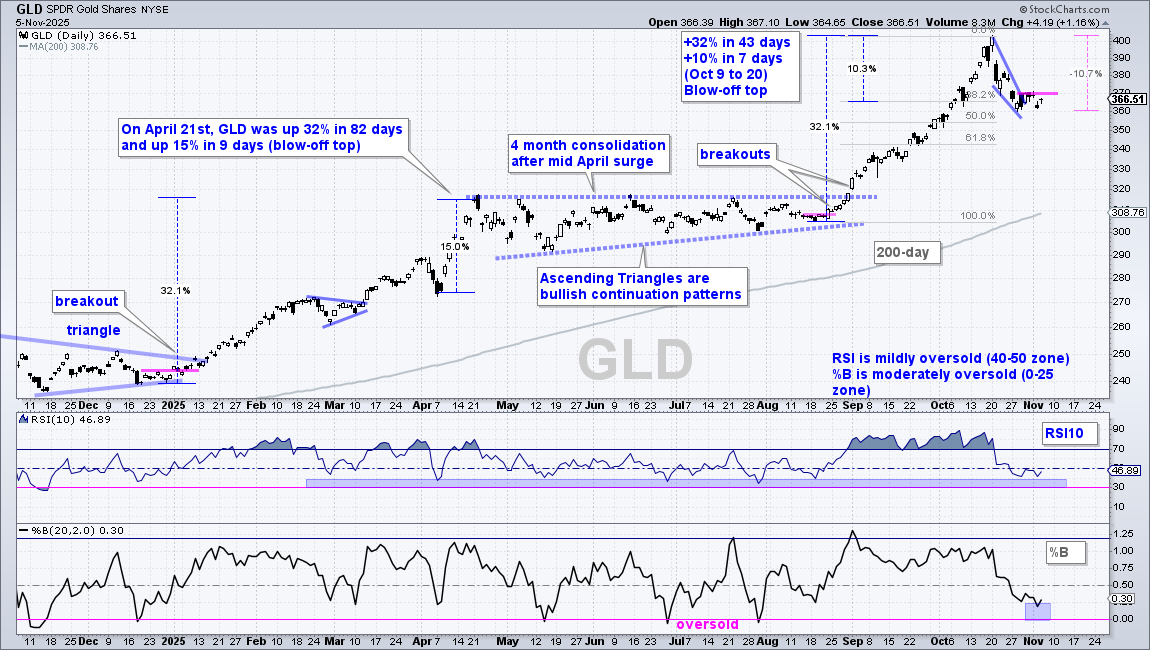
The Gold SPDR (GLD) remains a long-term leader with a year-to-date gain of 51.37%, despite a 10.7% decline from the October high. GLD became overextended after a 32% surge in 43 days and a 10% ramp in 7 days. This created a blow-off top similar to the one seen in April. I do not consider this a major top because the long-term trend is up and GLD was ripe for a corrective phase. Notice that GLD traded sideways for four months after the April blow-off top.
Corrections come in all shapes and sizes. We could see a short-sharp decline and then a resumption higher. GLD could also trade sideways for a period, and then break out. Alternatively, we could see a zigzag lower with a falling wedge or channel forming. Right now, I see a short-sharp correction and price firming in the 38-50 percent retracement zone. The August-October advance marked two steps forward, and the October decline was around one step backward. This is a normal retracement for a correction after a strong advance. GLD is firming in the 360-370 area. A breakout at 370 would be short-term bullish and reverse the short-term slide. A break below 360 would argue for a deeper correction, perhaps to the 61.8% retracement area.
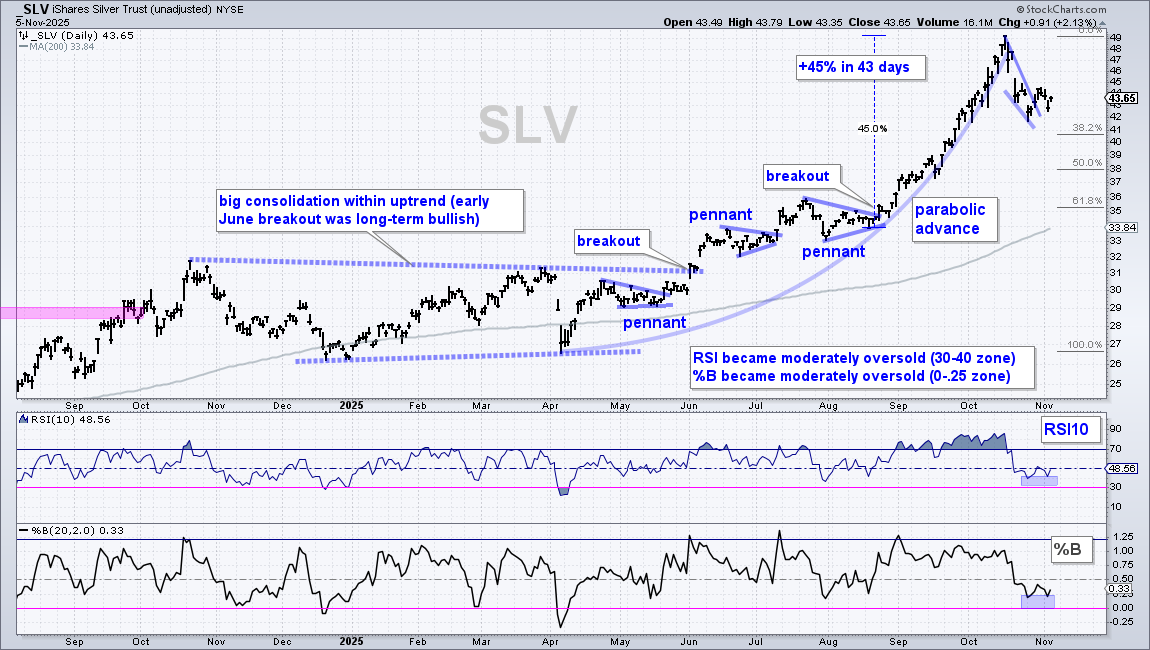
The Silver ETF (SLV), Gold Miners ETF (GDX) and Silver Miners ETF (SIL) are going to follow gold. These three went parabolic into October as existing uptrends accelerated higher. These moves ended with sharp declines into late October, but the long-term trends are still up. Thus, we have pullbacks within long-term uptrends – and pullbacks present opportunities. Keep in mind that it could still be a wild ride because volatility remains high.
The chart below shows SLV with a falling wedge breakout last week and a pullback the last four days. Overall, this breakout remains in play as long as 42 holds. A close below 42 would negate the breakout, possibly leading to a deeper correction. A 50% retracement of the April to October advance would extend to the 38 area, which is around 12% lower.
Gold and Silver Miners Are More Volatile
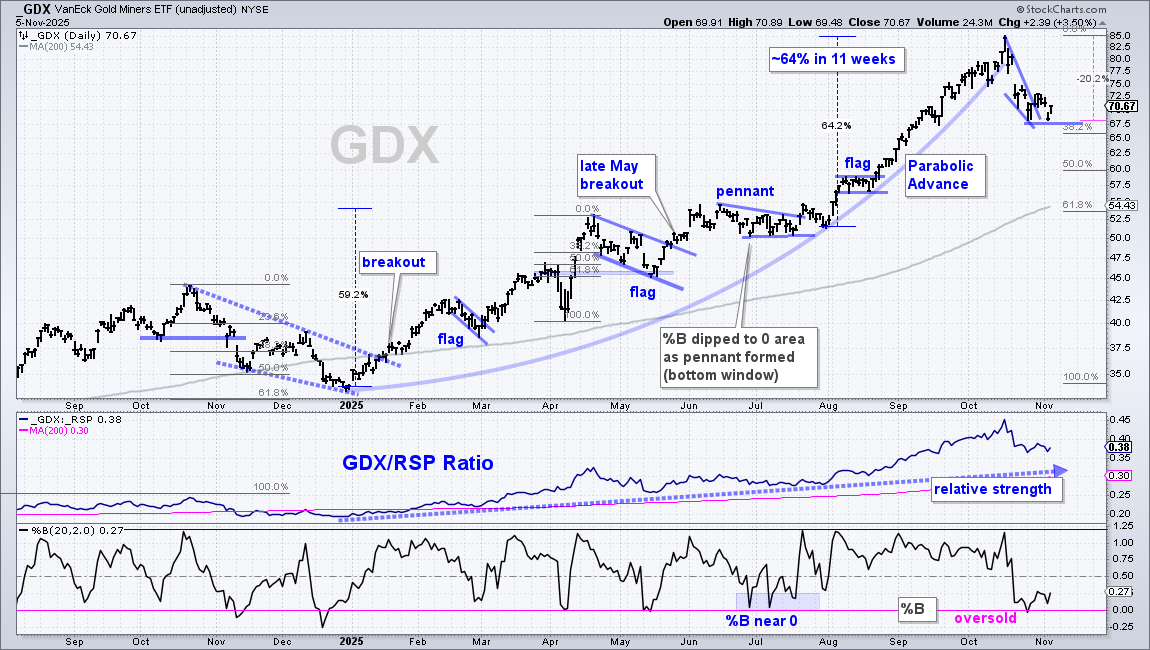
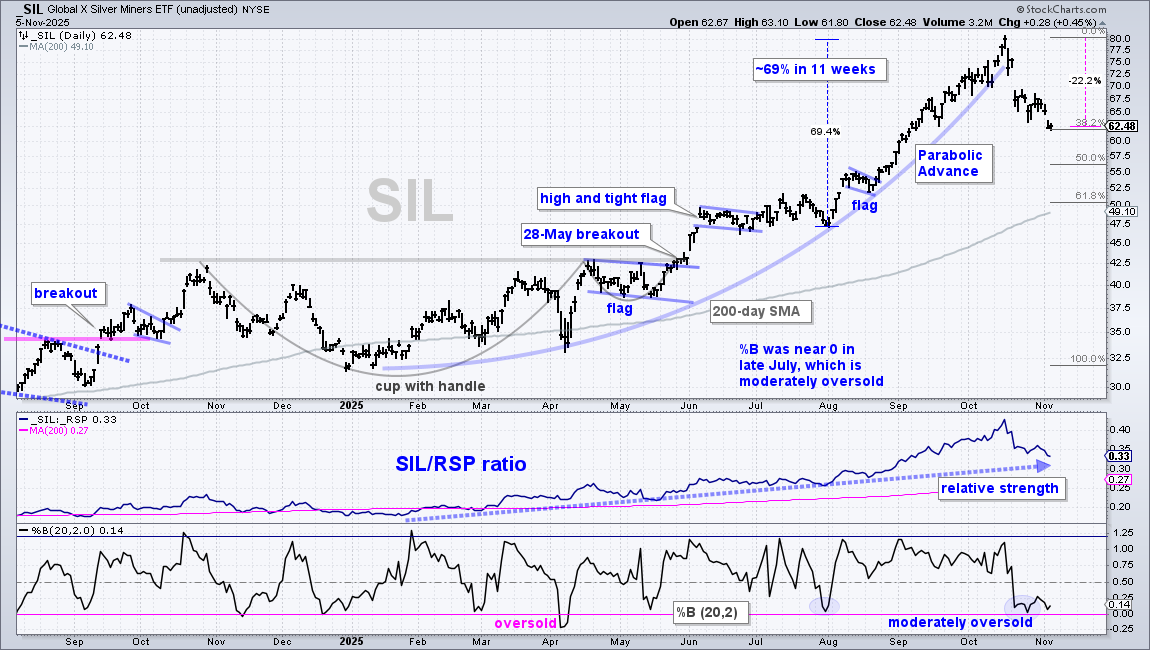
The Gold Miners ETF (GDX) and Silver Miners ETF (SIL) take volatility to another level. This means there is more potential upside reward, but also much more risk (relative to GLD and SLV). GDX was up 64% in 11 weeks and down 20% in three weeks. SIL was up 69% in 11 weeks and down 22% in three weeks. Both are correcting excesses after parabolic advances. They are still in long-term uptrends and, technically, pullbacks within uptrends are opportunities. Traders must also assess the risk associated with these opportunities.
The first chart shows GDX with a falling wedge breakout last week and test of the late October low this week. GDX bounced on Wednesday to affirm support at 67.50. A break here would negate the wedge breakout and argue for a deeper correction, perhaps to the 50% retracement line.
The next chart shows SIL moving below its October low this week, which means it is the weakest of the four. Note that it is also the most volatile of the four, which means we should expect erratic price behavior (overshoots).
DBB Hits New High as Copper Falls Back
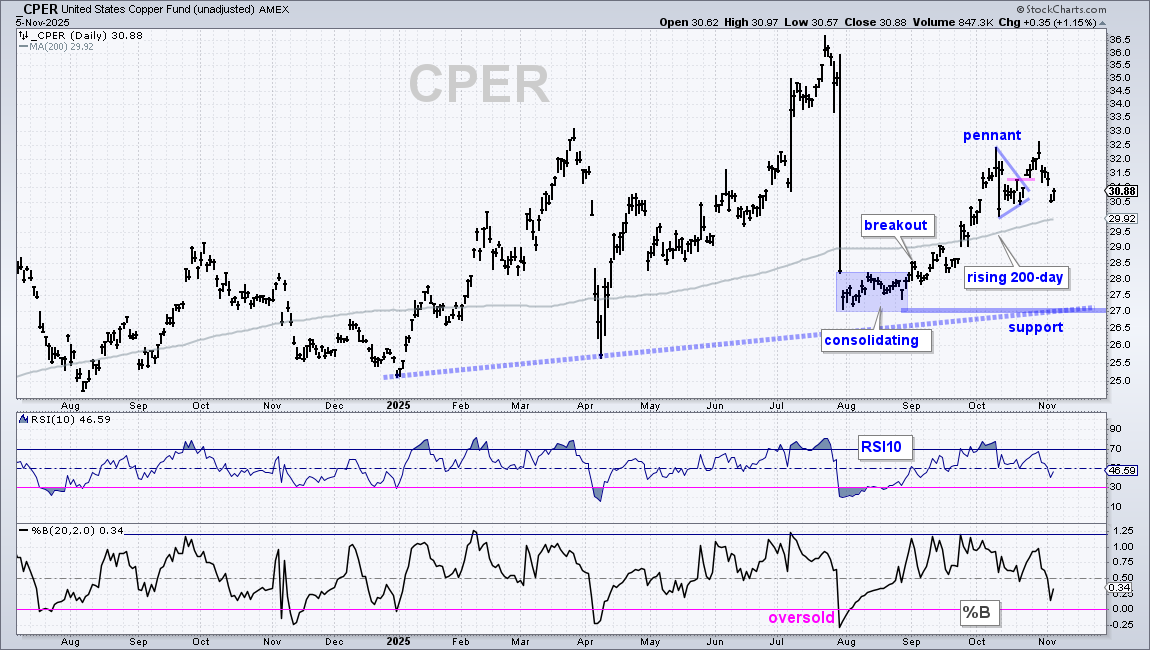
The Copper ETF (CPER) fell hard after the pennant breakout, but remains in a long-term uptrend. CPER sports a series of higher highs and higher lows since January and is above its rising 200-day SMA. While the failed pennant is short-term negative, I would attribute it to short-term volatility within a long-term uptrend. An oversold condition or deeper pullback would lead to the next setup. I will keep long-term support at 27.
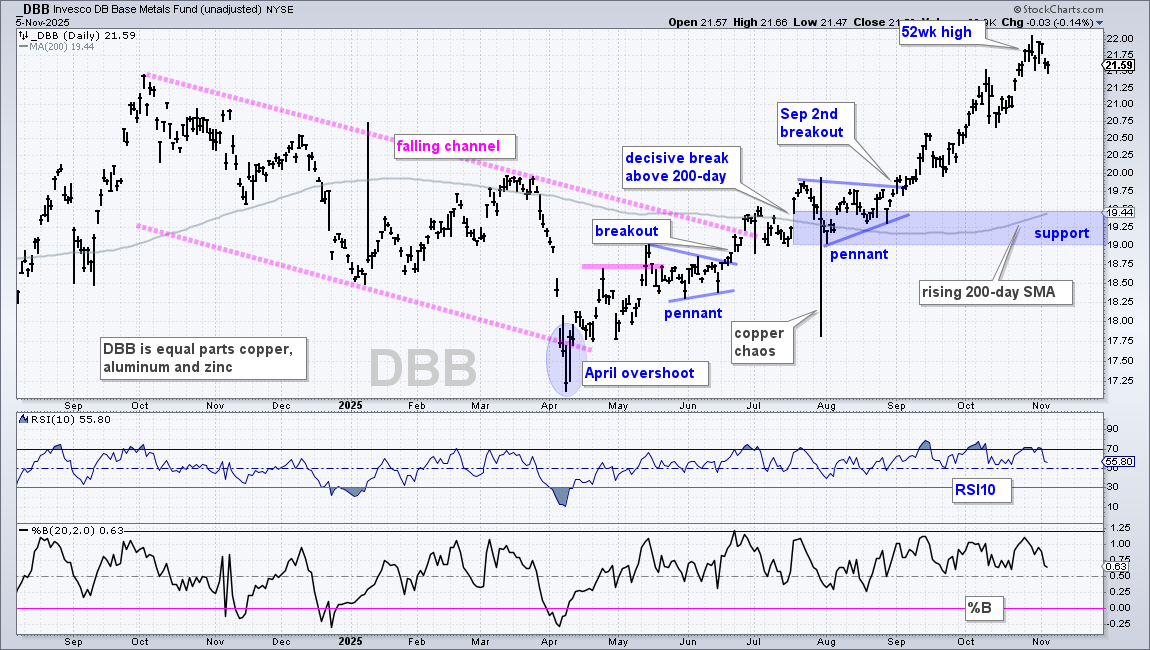
The next chart shows the DB Base Metals ETF (DBB) in a strong uptrend with new highs in late October. DBB accelerated higher in September-October, but did not correct with the other metals in the second half of October. DBB is equal parts copper, zinc and aluminum. Zinc and Aluminum futures hit new highs in October. I do not see a setup on this chart right now, meaning DBB is simply in the trend-monitoring phase. I am placing key support at the August lows and rising 200-day SMA, and will raise this level when a higher support zone emerges.
Uranium Turns Volatile after Breakout
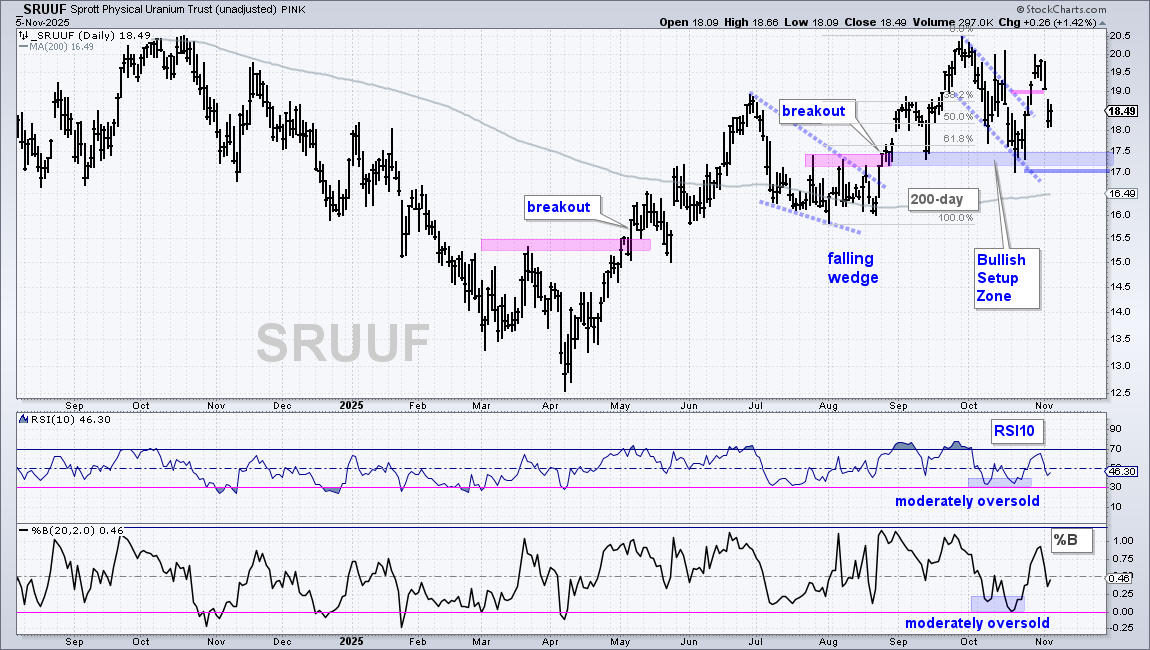
The Sprott Physical Uranium ETF (SRUUF) remains in a long-term uptrend with price above the rising 200-day SMA. After surging in September, the ETF fell back in October with a volatile correction that returned to the prior breakouts (pink-blue shading). SRUUF broke out in late October, but fell back with a decline below 19 this week. I will attribute this week’s decline to short-term volatility, which is normal for this ETF. The September-October lows mark support in the 17-17.50 area. A break below 17 would fully negate the late October breakout.
Bonds Become Oversold within Uptrends
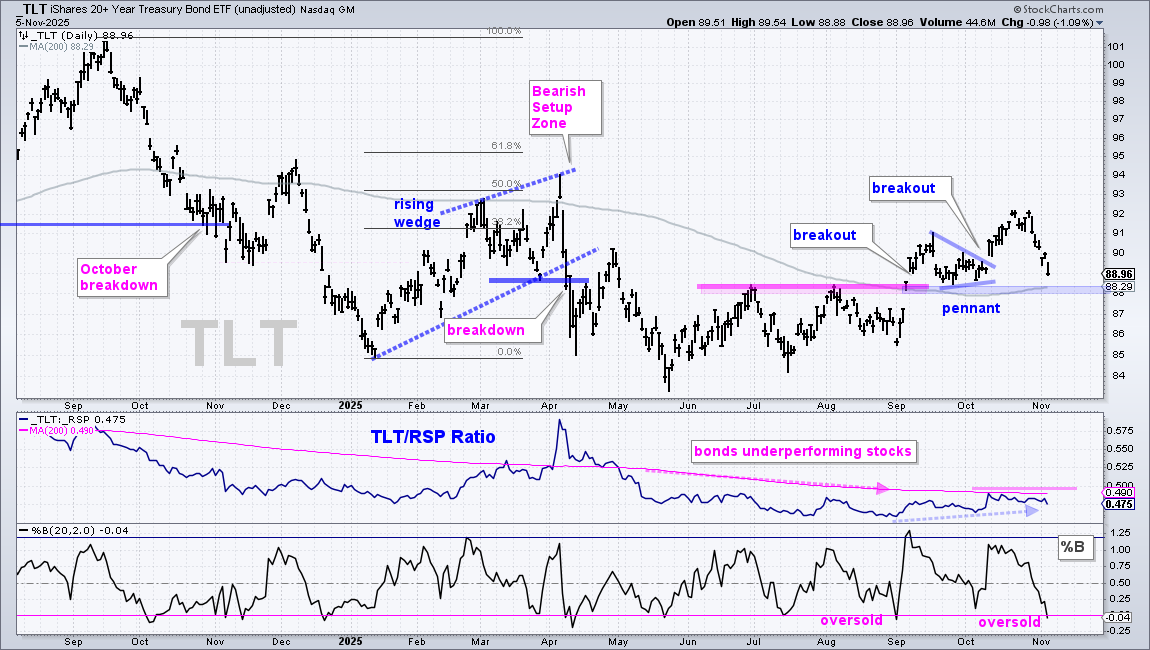
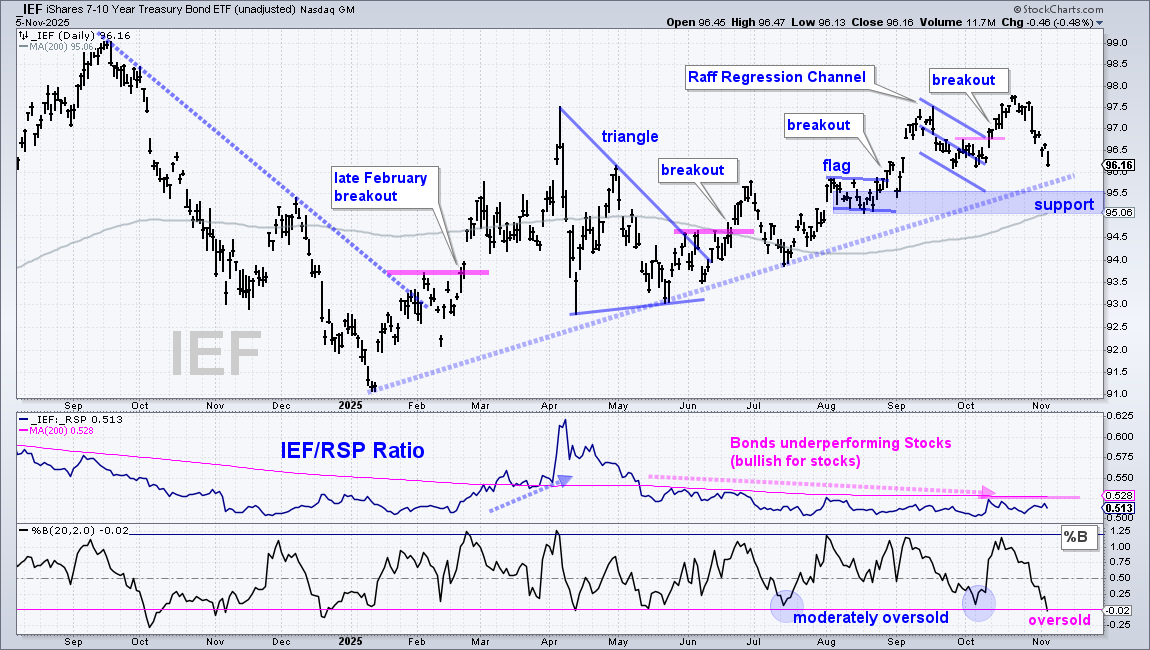
The 7-10Yr TBond ETF (IEF) and 20+Yr TBond ETF (TLT) were hit hard with sharp declines the last six days. TLT is down 3% in six days, which is the highest 6-day ROC since early April. Hmm, that’s an interesting comparison. TLT remains in an uptrend with price above the 200-day SMA, which turned up over the last few weeks. The ETF broke out in early September to reverse its downtrend and the breakout zone turns into support (pink-blue shading). TLT is approaching this zone as %B moved below zero to become short-term oversold. Thus, we have a bullish setup in TLT. Long-term uptrend, pullback to support and short-term oversold condition.
The bottom window shows the TLT/SPY ratio falling from mid April to August, which is when bonds underperformed stocks. This is bullish for stocks because bonds are the safe-haven asset and stocks are the risk asset. This ratio edged higher in September-October, but has yet to break out. A move above the pink line would trigger a breakout, and signal that bonds are outperforming stocks. This would be a negative development for stocks.
Is Bitcoin Sending a Warning for QQQ?
As with meme stocks, Bitcoin and crypto are speculative assets driven by liquidity. Note that RoundHill reintroduced the Meme ETF (MEME) on October 8th and it is down 18% since its debut. Note that RoundHill also introduced a Meme ETF in 2021 – and closed it two years later. IBIT is following MEME lower with a 16% decline since October 8th. Despite this short timeframe, there is a positive correlation between Bitcoin and Meme stocks.
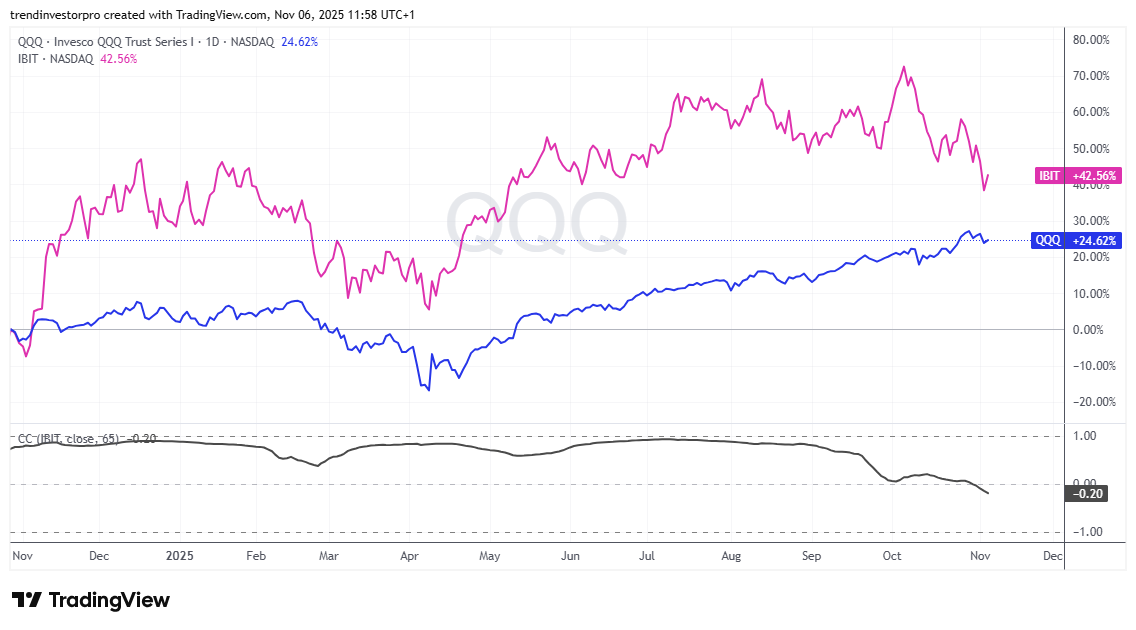
What about Bitcoin and QQQ? The chart below shows QQQ (blue) and IBIT (pink) in the top window and the Correlation Coefficient (65) in the lower window. These two showed a strong positive correlation from November 2024 to September 2025. This changed in October as correlation fell toward zero and then turned negative in late October. This is because IBIT fell as QQQ moved higher. They moved in opposite directions.
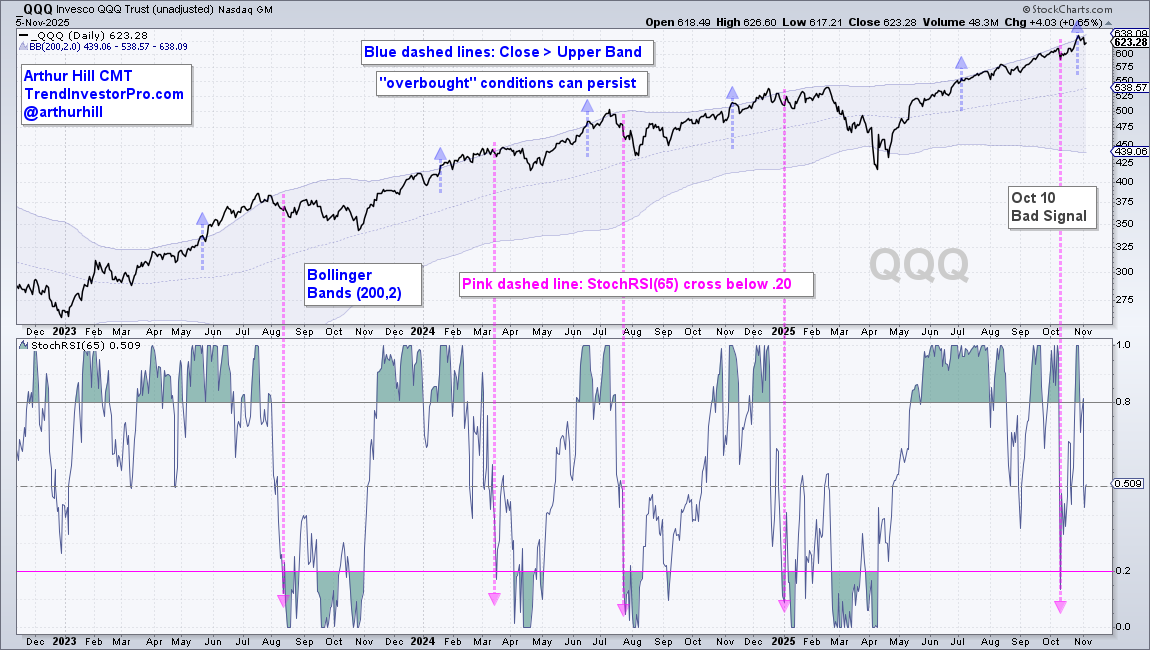
Is there a message here? As with the 18% decline in MEME, the message here is negative for the speculative end of the market. While QQQ remains in an uptrend and has yet to signal a correction, the decline in IBIT could be a warning for the Nasdaq 100. A QQQ correction signal would trigger should StochRSI(65) break below .20.
Bitcoin Lags with Six Month Low
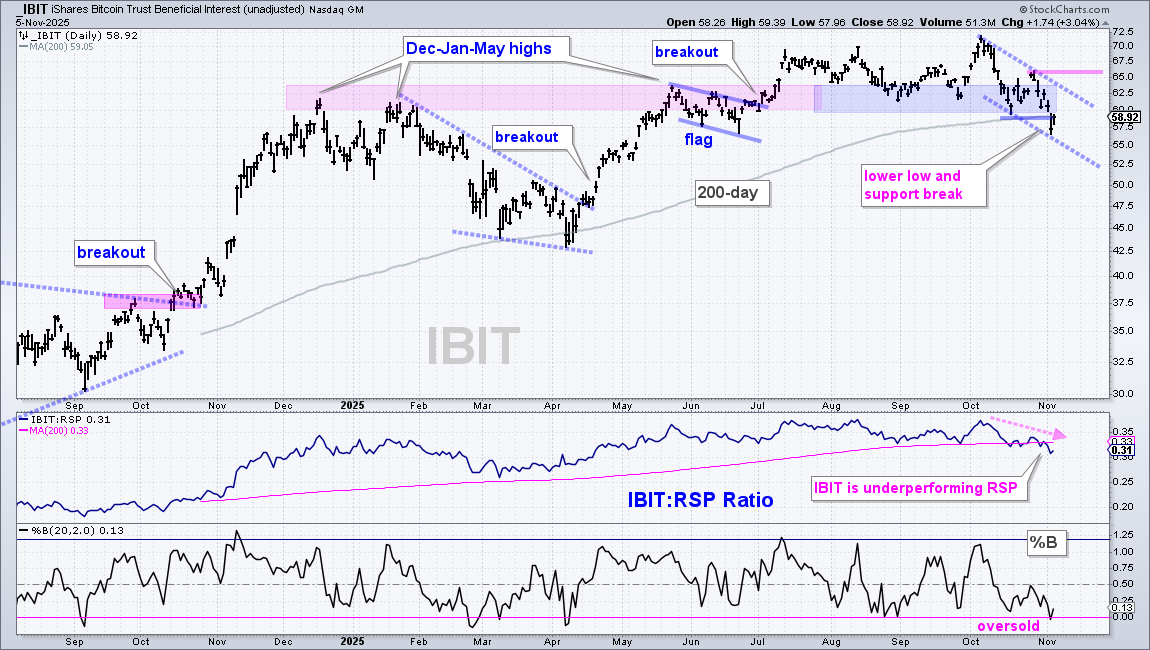
The next chart shows IBIT breaking the August-September lows and closing below its 200-day SMA on Tuesday. IBIT is now trading below its December-January highs and has nothing to show since inauguration day. The ETF could not hold the breakout zone (blue shading) and forged a lower low with the early November decline. At the very least, there are dozens of other ETFs with better looking charts.
DISCLAIMER: This content provided strictly for informational and educational purposes. It should not be interpreted as an offer to buy or sell any security, nor as a solicitation to engage in any investment activity. Nothing here constitutes a recommendation regarding any specific security, portfolio, transaction, or investment strategy.
At times, the author or affiliates may hold positions or interests in securities discussed. Any stocks or examples mentioned are not endorsements or suggestions to purchase. This material does not consider your individual financial goals or circumstances, and you should seek guidance from a qualified financial or investment adviser before making any trading or investment decisions.
Past performance does not guarantee future results.
Send feedback to support(at)trendinvestorpro.com or use the contact form.