

Headlines
- XLP Hits 3 Standard Deviation Extreme
- Costco Bounces Surges off Support
- Gilead Breaks to New Highs
- CSX Forms Bullish Cup-with-Handle
- Heico Extends Consolidation within Uptrend
- Entergy and Xcel Consolidate Near Highs
I will update the Market Regime page later today.
Previous Reports Covering Stock Trends, Setups and Breakouts
October 29th: CDNS, TSLA, BURL, NEM and FCX
October 22nd: CRWD, PANW, SARO, VEEV, ITB, XHB and HD
October 15th: ADM COST TT EMR NTAP and IOT
October 8th: AVGO, CRWD, WMT, AMGN, INCY, COR and CAH
October 1st: COIN, MSFT, CSCO, AMD, HEI and ROK
The weight of the evidence remains bullish for stocks, but there are some sizable pockets of weakness with some 45% of S&P 500 components trading below their 200-day SMAs. This makes it a challenging environment for stock picking. Today’s report starts with an extreme oversold condition in XLP and a key component surging off support. We then feature two stocks from the Industrials sector, a leading Healthcare name and two Utility stocks.
XLP Hits 3 Standard Deviation Extreme
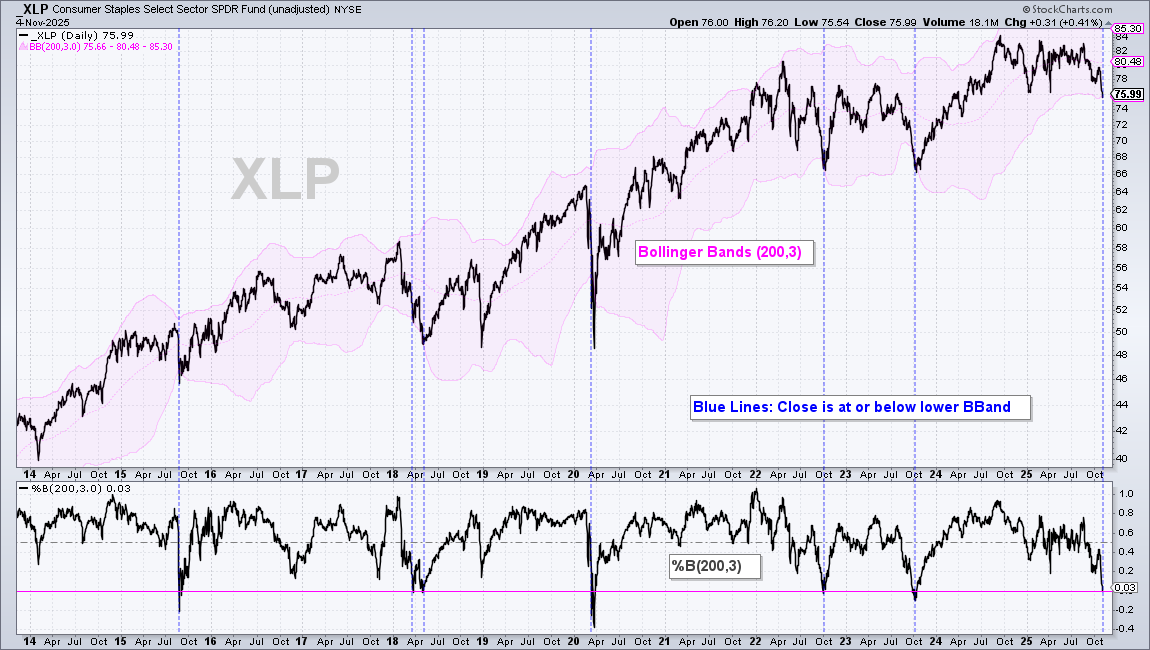
The Consumer Staples SPDR (XLP) is the weakest sector in 2025 with a year-to-date loss of 3.33%. Weakness in XLP makes sense because staples should underperform when tech is leading and risk is on. Despite relative and absolute weakness, note that XLP is long-term oversold as it touched the lower Bollinger Band (200,3) on Monday. This means price was 3 standard deviations below the 200-day SMA, which is an extreme. The lower window shows %B (200,3) moving below zero to confirm a close below the lower Bollinger Band (200,3). The blue dashed lines show prior occurrences for reference. XLP typically bounces after hitting such an extreme and could be poised for a bounce now.
Costco Surges off Support for Second Time
Costco (COST) is the warehouse retailer with a famous hot dog and soda deal. Still $1.50! COST (10.11%) and WMT (10.87%) are the two biggest holdings in the Consumer Staples SPDR. I featured COST on October 15th as it forged a gap-reversal in the support zone (blue circle). The stock returned to the early October lows in the 910 area and surged the last two days. These two moves reinforce support in the 900-910 area. In addition, I view these as short-term bullish reversals that provide an upward bias as long as support at 900 holds.
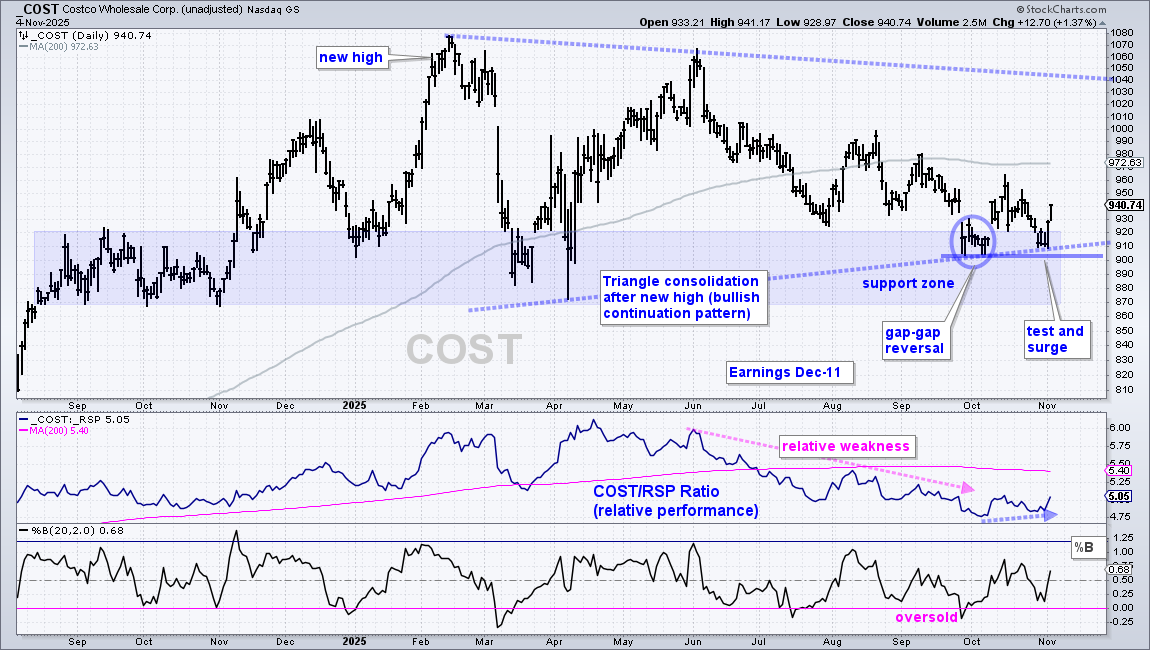
Long-term, COST is forming a large triangle after the new high in February. COST led the market in 2024 with new highs in November and December. It then surged into February and plunged in early March. A long triangle consolidation unfolded and I view this as a big consolidation after the advance into February 2025. A consolidation within an uptrend is a continuation pattern and a breakout at 1060 would be bullish. 1060 is some 12% higher, which is why I am focused on the current bounce off support.
Plan your Trade, Trade your Plan and Diversify
There are two ways to approach these short-term setups.
First, trade them as swing trades. A falling flag or wedge breakout is bullish and this signal remains valid until a break below the re-evaluation level, which is usually the low just before the breakout. For short-term trading, I usually set a profit target and close one third to one half of the position when this target is reached. A trailing stop is then placed to ensure that the entire trade does not result in a loss.
Second, use short-term setups to participate in the bigger uptrend. Bullish setups stem from short-term oversold conditions, falling wedges/flags or pullbacks. Instead of a re-evaluation level, the exit signal is based on a long-term trend change and a trend-following exit. Signals include a cross below the 200-day SMA, a major support break, a Chandelier Exit or a Keltner Channel break. This means the potential loss will be larger, but there is also a possibility to take part in an extended uptrend.
Thus, plan before making the trade, and then trade according to that plan. Also consider position sizing and diversification to spread the risk.
Gilead Breaks to New Highs
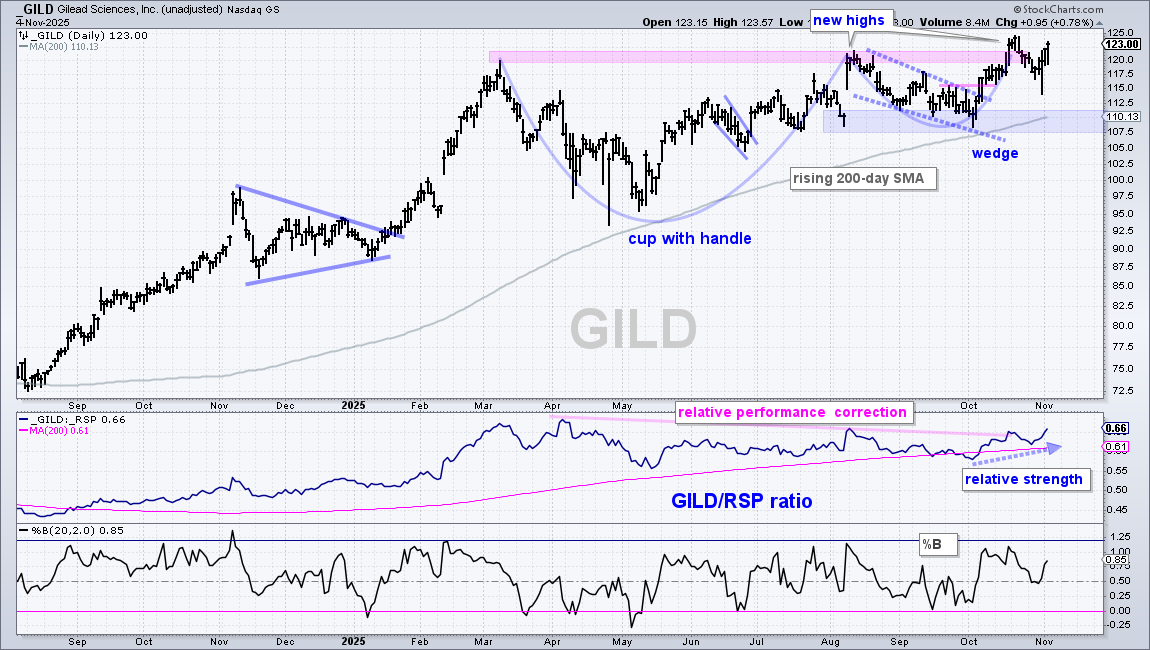
Gilead (GILD) is a biotech stock that is part of the Biotech ETF (IBB) and the Healthcare SPDR (XLV). IBB is outperforming the broader market since early September and XLV is outperforming since late September. GILD is in a long-term uptrend with new highs in August and October. Price is also well above the rising 200-day SMA. The stock largely consolidated from March to mid October as a cup-with-handle formed. GILD broke rim resistance with a surge into mid October. Long-term support is set in the 107-110 area (blue shading). The middle window shows the GILD/RSP ratio peaking in April and falling into September. This is a relative performance correction as the stock traded flat. The price-relative turned up in October, which means GILD is starting to outperform again.
CSX Forms Bullish Cup-with-Handle
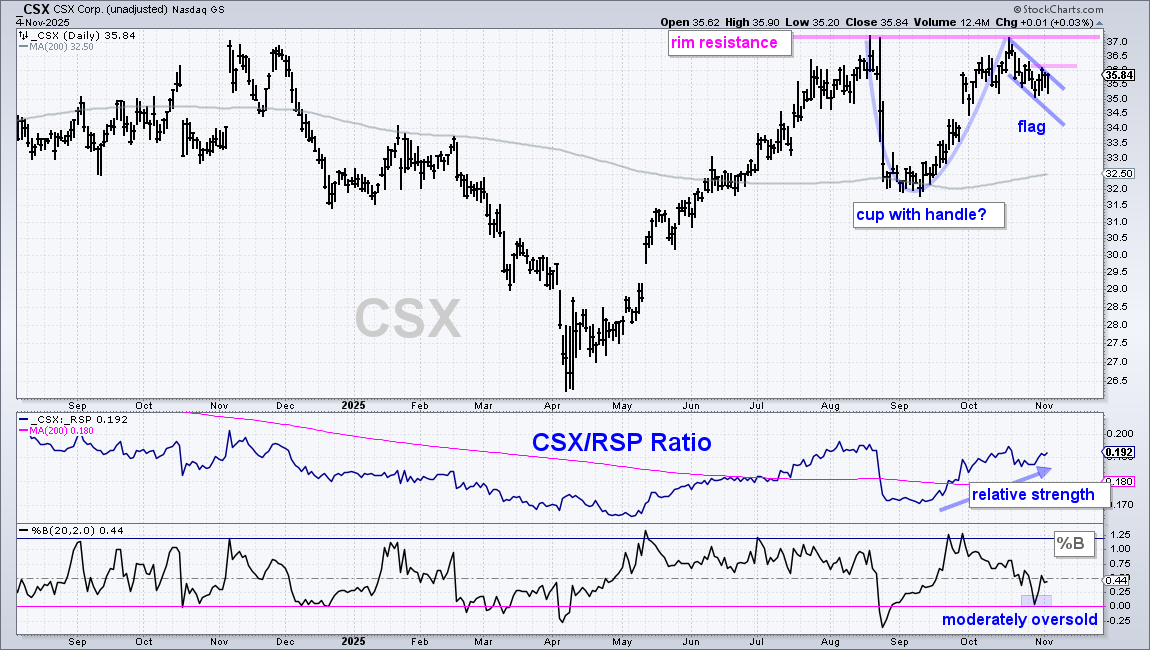
CSX (CSX) is part of the Transports ETF (IYT) and the DJ Railroad Industry ($DJUSRR). The stock is in a long-term uptrend with a cup-with-handle taking shape. These are bullish continuation patterns that mark a consolidation within the existing uptrend. Highs from August to October mark rim resistance and a breakout would signal a continuation higher. Short-term, the stock surged off the 200-day SMA and formed a falling flag into early November. This is a short-term bullish continuation pattern and a breakout would increase the odds of a cup-with-handle breakout. The middle window shows the price-relative moving higher since mid September (relative strength).
Heico Extends Consolidation within Uptrend
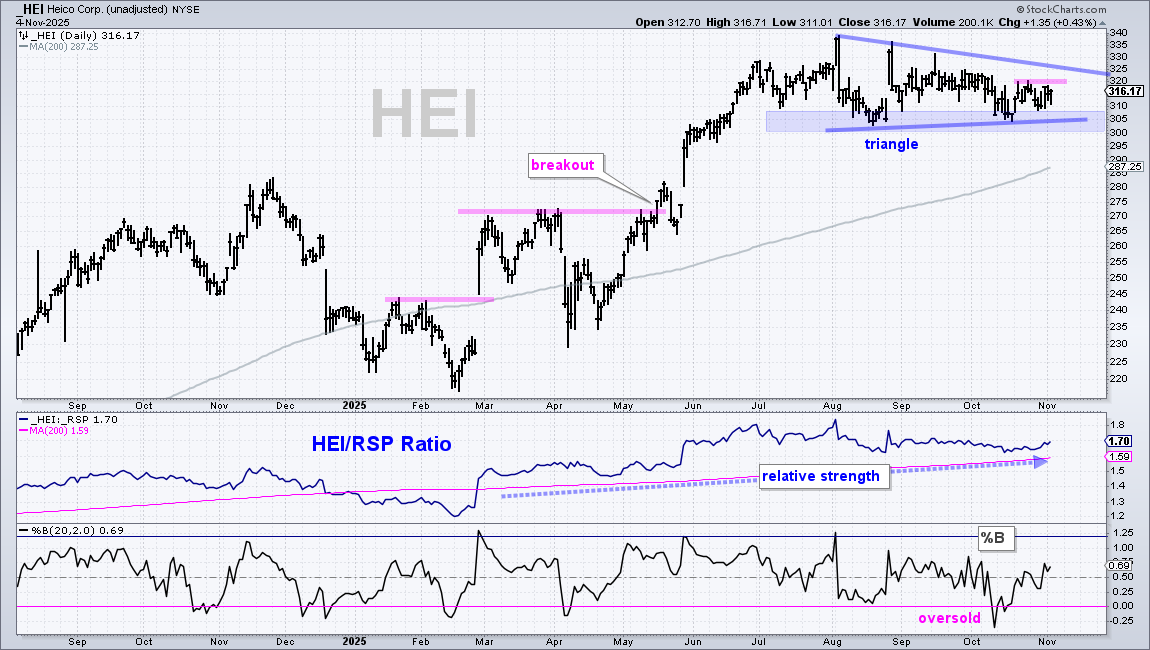
Heico (HEI) is part of the Aerospace & Defense ETF (ITA) and the Industrials SPDR (XLI) – both groups are leading the market. As with XLI, the stock has been stuck in a holding pattern the last few months. Overall, the long-term trend is up and the triangle is a consolidation within this uptrend, which makes it a bullish continuation pattern. A breakout would signal an end to the corrective period and a resumption of the long-term uptrend. Within the pattern, HEI established short-term resistance at 320 in late October. A breakout here would increase the chances of a bigger triangle breakout. The middle window shows the price-relative above its rising 200-day SMA. Also notice that this ratio edged higher the last three weeks. The lower window shows %B dipping below zero to become oversold in mid October.
Entergy and Xcel Consolidate Near Highs
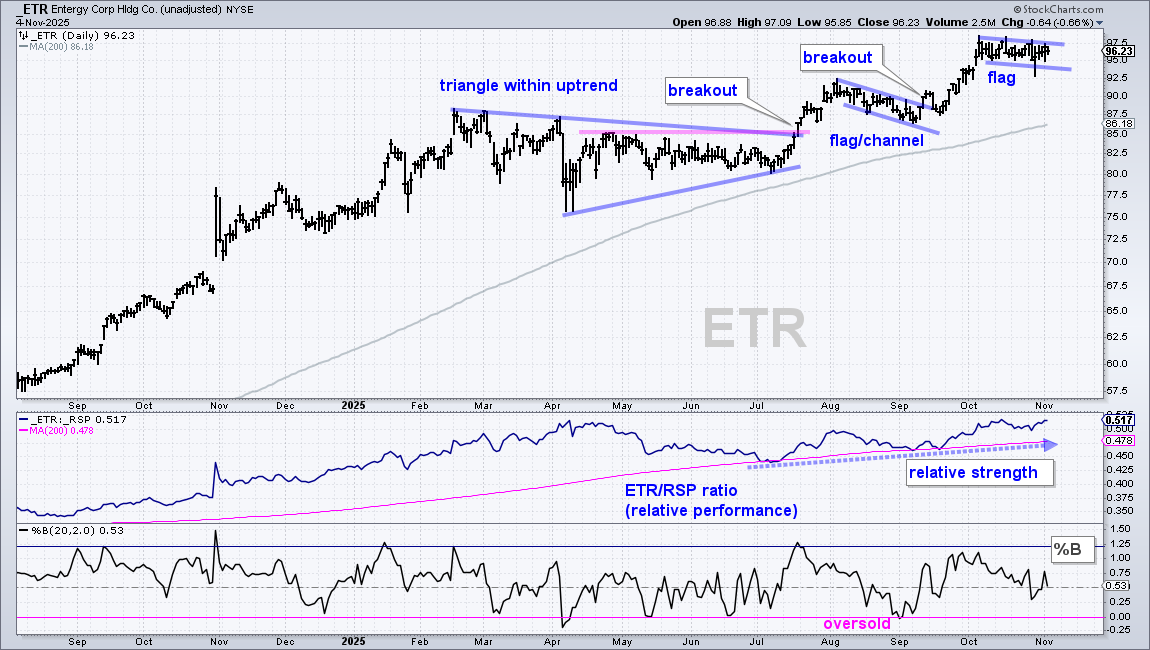
Entergy (ETR) and Excel (XEL) are part of the Utilities SPDR (XLU), which is a leading sector/group. There is some concern because XLU is tied to the AI trade and some leading AI stocks could be poised for a reset (correction). Note that ETR was featured on September 24th with the flag/channel breakout. Overall, ETR remains in a strong uptrend with new highs in price and the price-relative (ETR/RSP ratio). After hitting a new high in early October, the stock corrected with a falling flag, which is a short-term bullish continuation pattern. This pattern represents a rest within the uptrend. A breakout at 98 would signal a continuation higher.
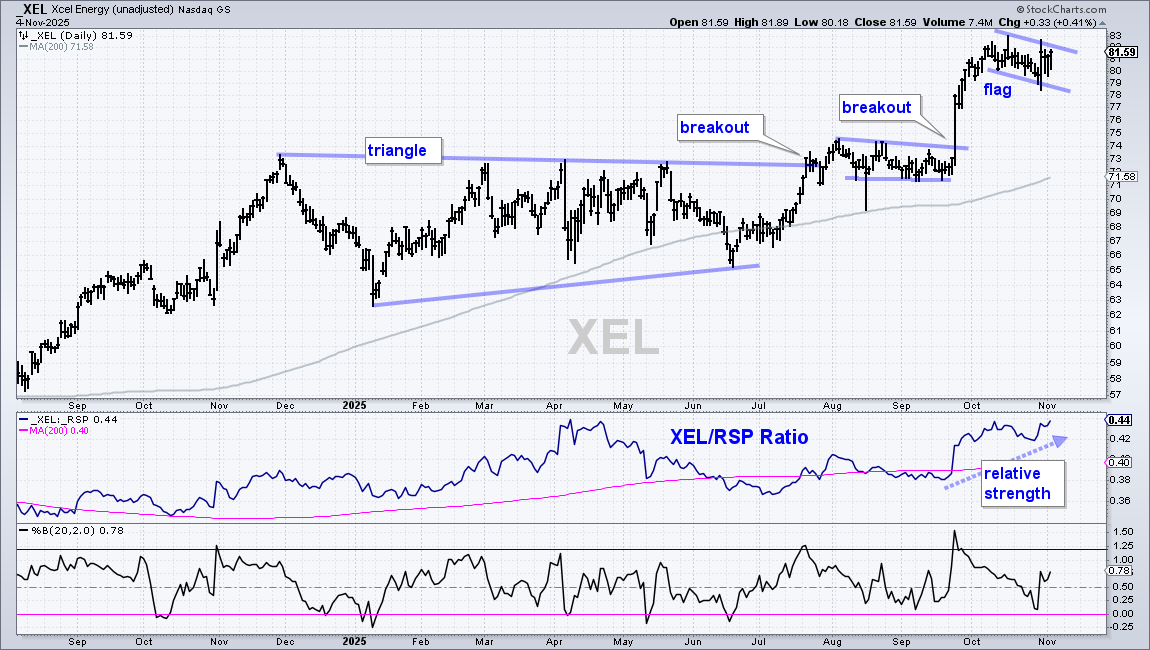
The next chart shows XEL surging in late September and hitting new highs. The stock corrected over the last few weeks with a falling flag. A breakout at 83 would signal a continuation higher. Note that flags are short-term patterns. Anything short-term is subject to noise and random fluctuations. This means price could break out, but then fall below the flag lows. Even with a break below the October low, XEL would still be in a long-term uptrend, which means a pullback is still viewed as an opportunity. This is why it is important to know your timeframe. Plan that trade and then trade according to that plan.
DISCLAIMER: This content provided strictly for informational and educational purposes. It should not be interpreted as an offer to buy or sell any security, nor as a solicitation to engage in any investment activity. Nothing here constitutes a recommendation regarding any specific security, portfolio, transaction, or investment strategy.
At times, the author or affiliates may hold positions or interests in securities discussed. Any stocks or examples mentioned are not endorsements or suggestions to purchase. This material does not consider your individual financial goals or circumstances, and you should seek guidance from a qualified financial or investment adviser before making any trading or investment decisions.
Past performance does not guarantee future results.
Send feedback to support(at)trendinvestorpro.com or use the contact form.