

Headlines
- Signaling a Momentum Shift after Becoming Overbought
- Key Levels for Nasdaq 100 Breadth Indicators
QQQ is looking overbought because it closed above the upper Bollinger Band (200,2) twice this week. As noted in Part 1 (here), stocks and ETFs can become overbought and remain overbought in strong uptrends. This is why we need a momentum indicator to signal a bearish shift. This report will first show how to use StochRSI for momentum shifts and then identify the key levels for Nasdaq 100 breadth.
Signaling a Momentum Shift after Becoming Overbought
I propose StochRSI(65) to identify momentum shifts. This indicator is the Stochastic Oscillator applied to RSI, which makes it a momentum indicator applied to a momentum indicator. It measures the momentum of RSI. Tushar Chande and Stanley Kroll developed this indicator because they wanted more signals and sensitivity from RSI. StochRSI fluctuates between 0 and 1. A surge from below .20 to above .80 signals a bullish momentum shift, while a plunge from above .80 to below .20 signals a bearish momentum shift.
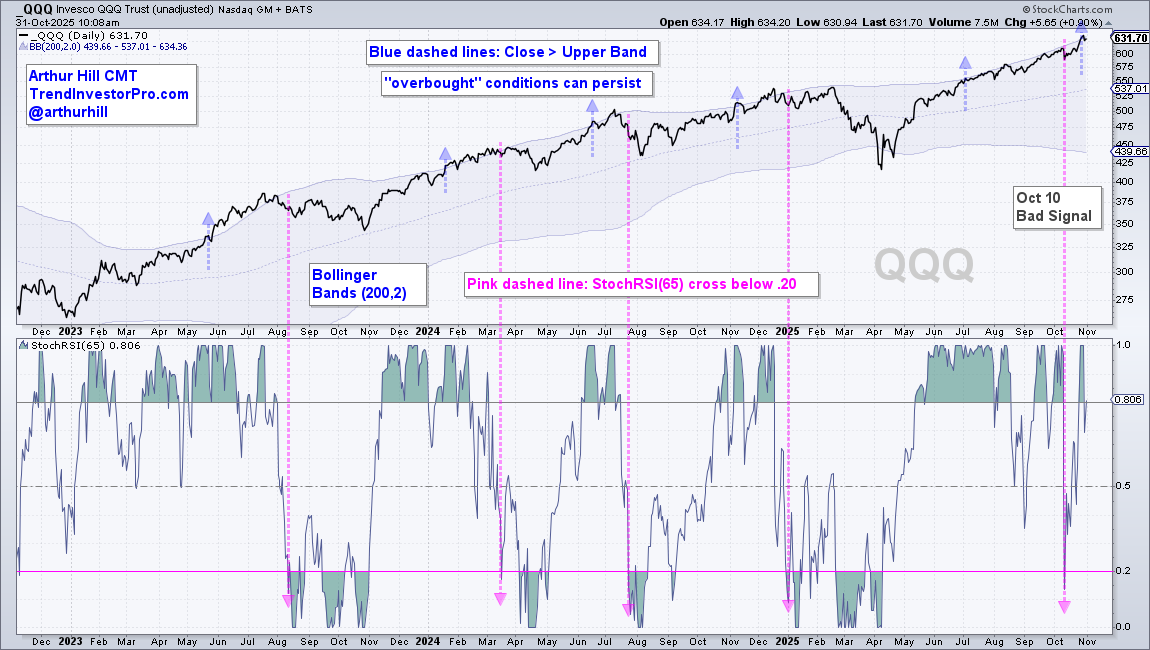
The chart above shows QQQ, Bollinger Bands (200,2) and StochRSI(65). The blue arrow-lines mark the initial cross above the upper Bollinger Bands (overbought). This is the setup to watch for a bearish momentum shift. After becoming overbought, the pink lines show when StochRSI moves below .20 (bearish momentum shift). These shifts foreshadowed extended corrections in August-October 2023 and January-March 2025, as well as short pullbacks in April 2024 and August 2024.
After becoming overbought in early July, a pullback/correction signal triggered on October 10th. This signal did not work out because StochRSI moved back above .80 and QQQ moved to new highs this week. You can’t win them all. With QQQ moving back above the upper Bollinger Band this week, another oversold setup is active. A StochRSI plunge below .20 would signal a bearish momentum shift and increase the odds for a correction.
Key Levels for Nasdaq 100 Breadth Indicators
The next chart shows QQQ, NDX %Above 200-day SMA and NDX High-Low Percent with the key levels to watch. First, QQQ is clearly in a long-term uptrend with price above the rising 200-day SMA. QQQ crossed this key moving average with a gap-surge in mid May and remains above this key moving average.
Now let’s turn to breadth. I use 40% and 60% for my bullish/bearish thresholds for NDX %Above 200-day SMA. Even though 50% is the obvious level for half full/empty, there are too many whipsaws when using this level for signals. Widening signal thresholds creates a little more lag, but it makes up for this disadvantage with fewer whipsaws (bad signals). This indicator turned bullish in mid May with a move above 60% and remains well above 40% right now.
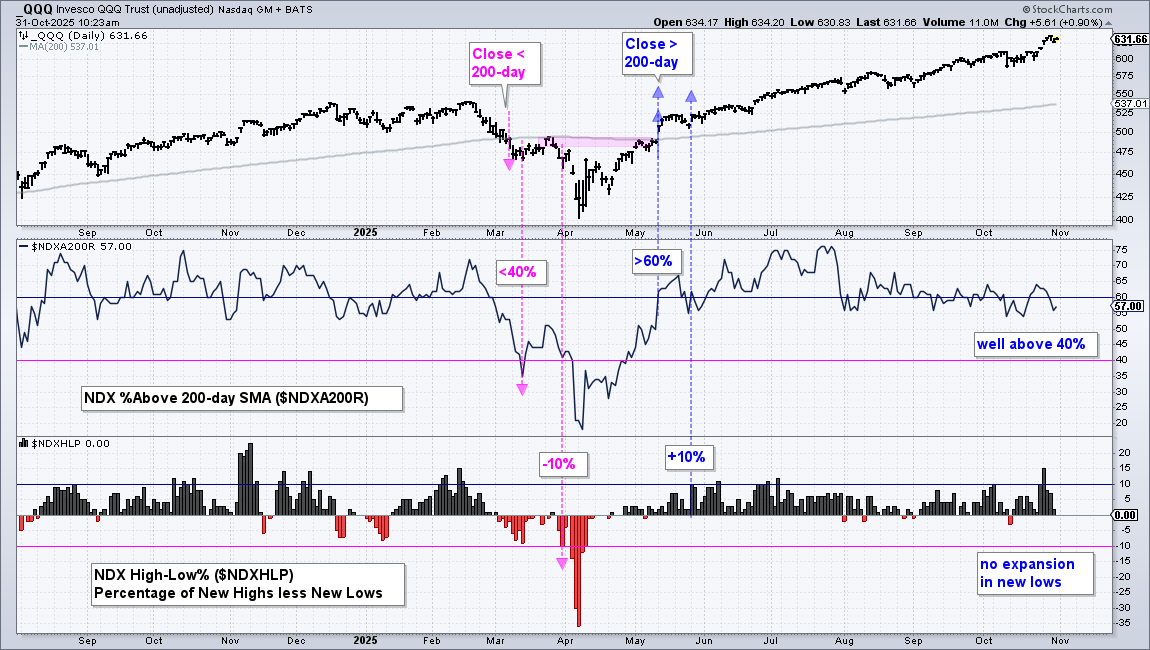
The bottom windows shows NDX High-Low Percent with bullish/bearish thresholds at +10%/-10%. Again, added a buffer to signal thresholds reduces whipsaws. This indicator turned bullish at the end of May and remains bullish. A move to -10% or lower would turn this indicator bearish.
March 2025 shows what a bearish signal sequence looks like. QQQ crossed below its 200-day SMA in early March and NDX %Above 200-day SMA crossed below 40% on March 13th. Two of the three were bearish as of mid March. NDX High-Low Percent followed suit with a move to -10% in late March and QQQ swooned lower into early April.
Bottom Line: QQQ remains in an uptrend and Nasdaq 100 remains bullish. QQQ is overbought, but we have yet to get a StochRSI signal that would point to a pullback or correction. Stay tuned…
DISCLAIMER: This content provided strictly for informational and educational purposes. It should not be interpreted as an offer to buy or sell any security, nor as a solicitation to engage in any investment activity. Nothing here constitutes a recommendation regarding any specific security, portfolio, transaction, or investment strategy.
At times, the author or affiliates may hold positions or interests in securities discussed. Any stocks or examples mentioned are not endorsements or suggestions to purchase. This material does not consider your individual financial goals or circumstances, and you should seek guidance from a qualified financial or investment adviser before making any trading or investment decisions.
Past performance does not guarantee future results.
Send feedback to support(at)trendinvestorpro.com or use the contact form.